

In this article, we will try to map some elements of Facebook’s human fabric, the social structure and the power relations within the company.
We will investigate and reflect upon the phenomenon of Facebook in terms of the social networks of its employees. We will also consider the social relations between the members of Facebook’s management board and other spheres of society. This article is a contribution to the contemporary critique of the strong ties between political establishments and global business, i.e. that of the issue of the revolving door.[2] In short, we will deal with the phenomenon of digital capitalism.
In order to grasp the employment structure of Facebook, we have used public LinkedIn profiles of 1000 people indicating Facebook as their employer as well as the biographies of the entire management of Facebook. By mapping their social background, education, status, and present position in the hierarchy of the company, we gained insights into the various social connections of the “Facebook government” as a whole. These insights can be used to explain some of the actions of the company and the network – related actors and the [evolution of the] business model and can be helpful to try and predict future developments.
Knowledge Labour Aristocracy
We want to learn more about the personalities, their embeddedness into classes and their networks within and outside the closed society of the Facebook corporation; we want to find out how these classes are structured, to know more about the people these classes consist of, how they move or migrate around the world. We are also interested in understanding of roles of all the persons around Mark Zuckerberg who rule or serve this corporation. While asking ourselves about the people who build the Facebook pyramid, we have in mind the notion of class determinism and the idea that the classes reproduce themselves and create the environment in which its members will be able to function optimally. Bourdieu’s notions of social space, habitus, the cultural, educational/informational, and social capital (Bourdieu 1982, 1997) were present in our reflections before and during the research. The mentioned terms introduce Marx’ idea of capital accumulation which shouldn’t be forgotten when thinking about the Facebook collective or any other representative of digital capitalism. Figure 1: Dinner in the salle des spectacles at Versailles – Eugene Louis Lami
Source : Wikigallery.org
We can think about almost any class of the Facebook employees as a perfect example of highly paid knowledge labour aristocracy.[7] This model is the opposite example to other forms of labour hidden behind the surface of IT industry, “such as slave-labour extracting minerals, the labour of militarily controlled and highly exploited hardware assemblers, precarious digital service workers, imperialistically exploited knowledge workers in developing countries, workers conducting the industrial recycling and management of e-waste, or highly hazardous informal physical e-waste labour” (Fuchs 2016: 61). On the top of this pyramid of knowledge labour, we see the small circle of ‘silicon sultans’, network of individuals who control or have significant influence on the biggest companies in the field, sit in their boards or own parts of their shares.
 Figure 2: Robber Barons
Source : Robber Baron or Captain of Industry….What does that mean? (video)
The original accumulation of the capital in the United States shows some intriguing similarities with the oligarchy from the Silicon Valley.[8] The second half of the 19th century was marked by the creation of the infrastructure (railroads) for the American single market, and by the transition to industrial society, bringing innovative products to the doorsteps. The American ‘robber barons’ of the 19th century amassed huge wealth by squeezing out the competition, much like today’s ‘silicon sultans’. An illustrative comparison will show us: “Rockefeller once controlled 80% of the world’s supply of oil; today Google has 90% of the search market in Europe and 67% in the United States while Facebook has 42% of the social media market share in US only” (Economist 2014). Similarities between these two groups of infrastructure pioneers lead to a warning conclusion: the characters spearheading the transformation of an industrial age into an information society on a global scale “stand accused of being greedy business folk who suborn politicians, employ sweatshop labour, stiff other shareholders and, especially, monopolise markets” (Economist 2014). Once regarded as ‘inventive mould-breakers’, silicon sultans now digress into solving mankind’s problems, from ageing to space travel, grounding their entitlement in the data industry the world became dependant on.

On Top of the Pyramid: the Board and the Management
In order to visualise the connections of Facebook’s (FB) management,[9] i.e. its board of directors and advisors, and two executive levels, we used publicly available information provided by the Official Board and Crunchbase websites.[10] For every person on these lists we analysed educational and professional background as presented in his or her official biography. It should be borne in mind that all of these people are in the public eye and that their biographies are not secret. Thus, all of the given information is available to everyone who wishes to find it, and our use of it is not a result of any illegal or covert activity.
The following network should help us deepen the understanding of the connections within the board itself and the ties between the Facebook and the industry, the ties of Facebook and the government, and the ties of Facebook with civic organisations (such as e.g. think-tanks).
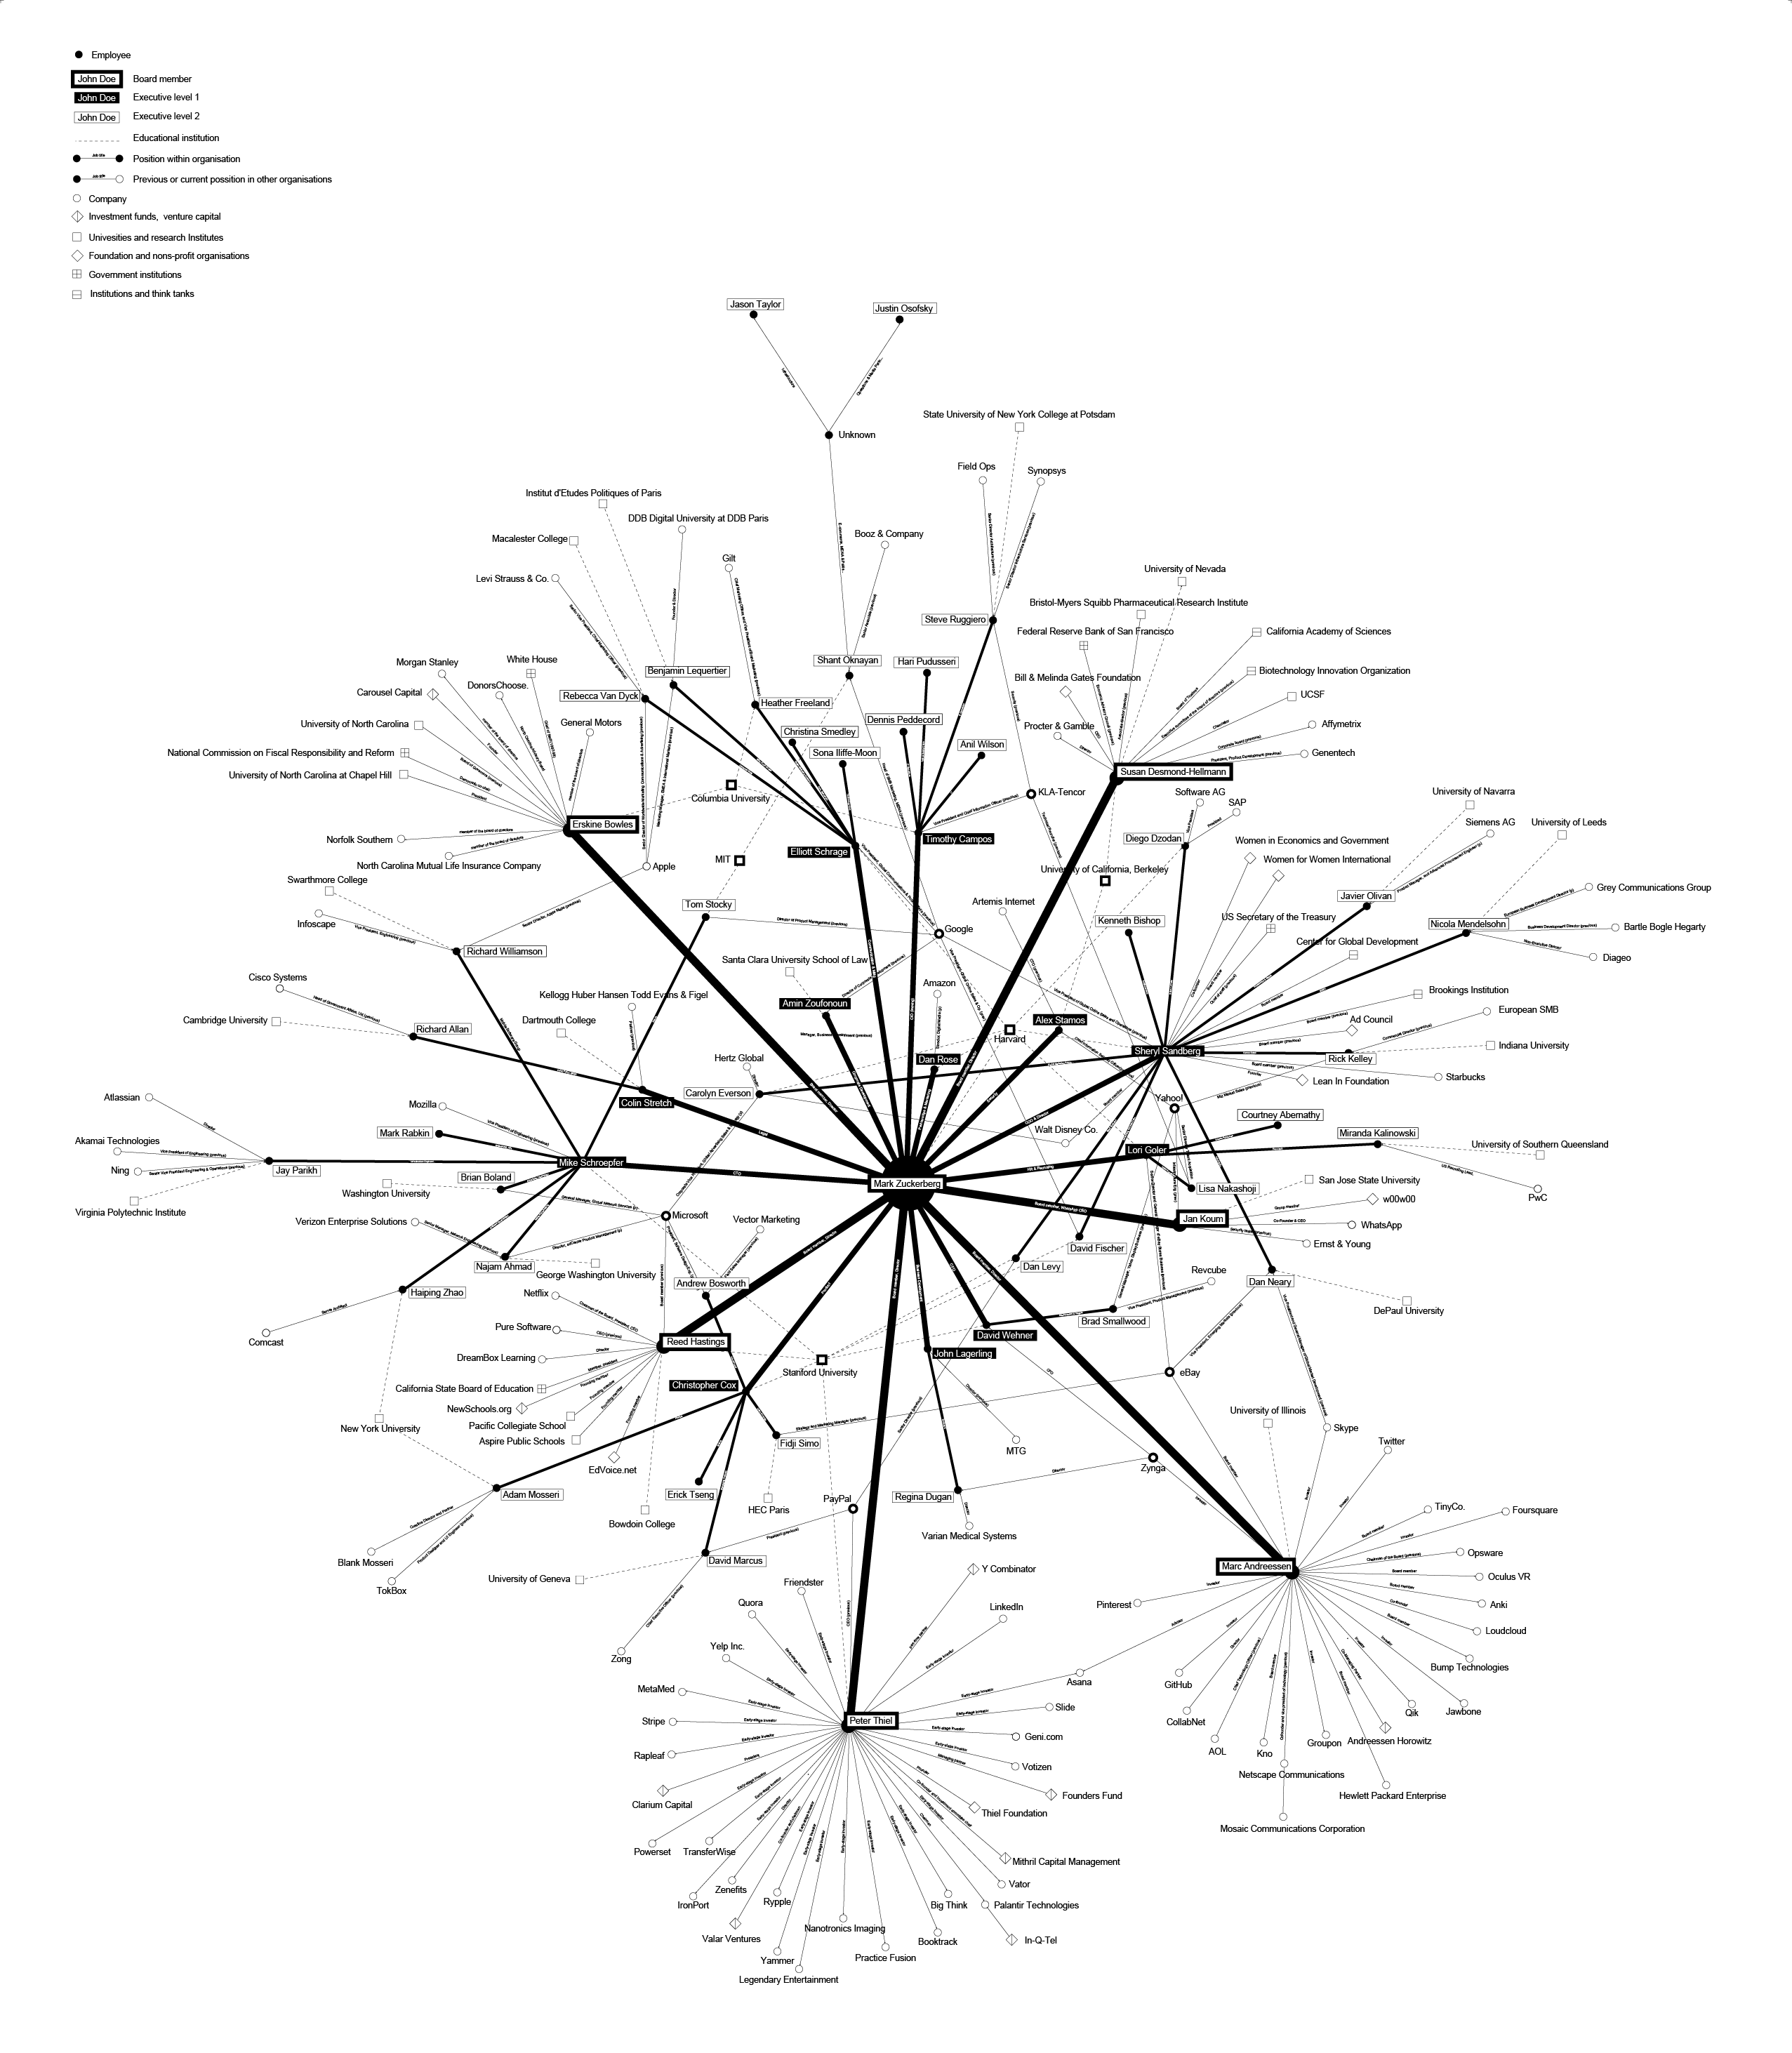
Figure 3: Facebook Management Graph
In the centre of the graph is Mark Zuckerberg, surrounded by the board members. As shown in the upper left corner, the yellow rectangle marks board members, the black rectangle marks the first level of executives, and the white rectangle the second level of executives. The networks surrounding these actors connect the educational institution from which they obtained their degree, their position within Facebook, and/or ties to a previous position in a respective organisation. The organisations can be of different types as mentioned above: company; investment fund or venture capital; university and/or research institute; foundations and non-profit organisations; government institutions; and non-governmental institutions such as think-tanks. Each of the actors is connected with several organisations in different ways.
Here are few examples of how you can read this map:
Marc Andreessen: Nexus of power – In the lower right corner, we find Marc Andreessen, one of the board members in the inner circle of Zuckerberg’s closest colleagues in Facebook. As we can see, he has been educated at the University of Illinois, which is a part of biography which doesn’t connect him with any other of his FB-colleagues. He is, however, also partner in one of the most influential venture capital firms in the Silicon Valley “Andreessen Horowitz”.[11] Through this company Andreessen is connected with very important companies such as Foursquare, Groupon, Skype, Twitter, eBay, AOL and GitHub. He is an example of a very powerful person who has a rather integrative function in the market since his business ties connect major players in the field.[12] This kind of interconnectedness raises the question if the companies of Silicon Valley are in the risk of being in cartels and trusts or if they are already beyond that. In other words, this and similar connections underpin the idea that Facebook has a successful concept because it attracts influential actors. They also do not remove suspicion that the company would not be as successful were it not for these actors. If we decide to follow one of his connections, as depicted on the graph above, we can see that Andreessen has interest in communications and financial services: through his venture capital firm he was an investor in Skype, and he is still the board member in eBay. The previous vice president of both companies was Dan Neary who is presently second level executive in Facebook and works for/with Sheryl Sandberg on the Asia Pacific market.
Peter Thiel: Agencies and Analytics – Peter Thiel (lower left corner), one of the most influential people in Silicon Valley and the member of the FB management, is also an early-stage investor in the LinkedIn network (where the retrieved data about the FB-employees come from). He is co-founder of world known PayPal, Clarium Capital (a global macro hedge fund), Founders Fund (a venture capital firm), Valar Ventures, Mithril Capital, and has served as a partner in Y Combinator, making him one of the most powerful figure in the venture capital sphere, extending his influence over hundreds if not thousands startup companies. One of companies Thiel founded is drawing special attention – Palantir Technologies, an analytical software company. A document leaked to TechCrunch revealed that Palantir’s clients as of 2013 included at least twelve U.S. governmental bodies, including the CIA, DHS, NSA, FBI, CDC, the Marine Corps, the Air Force, Special Operations Command, West Point among others.[13] This company was originally funded from In-Q-Tel, the Central Intelligence Agency’s not-for-profit venture capital arm, and was used by different government agencies. Even though the some of his close colleagues in Silicon Valley do not share enthusiasm about it, Thiel became advisor of U.S. President Donald Trump and his bridge to the tech community. In addition to Erskine Bowles (who will be mentioned further below), this is a second important connection of Facebook management board to politics and political parties.
Sheryl Sandberg: Government, Financial Sector and Corporations – Sheryl Sandberg’s position at Facebook is Chief Operating Officer and the director. She controls operations related to small businesses, advertising and global operations, global marketing, games sales, etc. In the “life before Facebook”, her studies at the Harvard Business School brought her to work as an assistant for her professor and to subsequently become the Chief of Staff at U.S. Secretary of the Treasury.[14]Except for being in the series of foundations and non-profit organisations that gather influential women from the business and government, she is/was also board member in the think-tanks such as Center for Global Development or Brookings Institute which (among other tasks) deals with the defence policy of the U.S. Less important but an interesting fact is that she was the board member of Starbucks Coffee This shows in a rather amusing way, that all the mentioned actors are by no means limiting their business interests to the digital or online economy, but are, on the contrary, interested into other sources of income as well.The example of Sheryl Sandberg clearly shows strong ties on the personal level between state institutions and private capital. She stands for a civil servant who became very influential in the business sector.
Ties to Politics and Parties
The member of the board Erskine Bowles, (upper left corner) from the inner circle around Mark Zuckerberg, has been also Chief of Staff in the White House, and is the co-chair at the National Commission of Fiscal Responsibility and Reform, a governmental body that he himself helped to establish in 2010.[15] His ties to the financial industry through his work experience in Morgan Stanley,[16] and in the technological industry through General Motors[17] show the kind of systemic support that Facebook can rely on through the members of its board. Erskine Bowles stands for the connection of the financial, technological and IT industry with the politics and with the Democratic Party. Even if it is not so easy to talk about the protectionism in the classic meaning of the word, these connections do show the common interest of the actors within the political administration with those of the private business.
This kind of political engagement in the context of mentioned lucrative businesses is problematic from the standpoint of European public and political tradition. From the perspective of civil rights and privacy policy, the strong institutional connections between the governmental bodies, secret services and social networks, i.e., communication infrastructure can only be seen critically. Mentioned examples show how elites merge with political establishment to concentrate power. We remind readers, however, that this phenomenon is generally not seen as something wrong in the U.S. since all these people are publically talking about these achievements as something highly positive. At the same time, similar ties are to be found in other branches of industry and in other countries. By no means advocating it, we think that the global success of a company like Facebook would not be possible without these kinds of capacities.
Google’s kiss to Facebook
As we will see further in this paper, among the transferred professionals working for Facebook, the number of former employees from Google is the highest. Regarding the managing class of Facebook, we can see that the Google node (in the centre, above Zuckerberg) on the graph is also important since it connects several important actors. Shant Oknayan from UAE is responsible for the Middle East and North Africa (MENA) region in the E-commerce, Retail, Online Services and Media. He, however, came from the similar post at Google. Tom Stocky, director of Search department, used to be Director of Product Management at Google. David Fischer and previously mentioned Sheryl Sandberg both used to be vice presidents of Global Online Sales and Operations at Google. A similar situation emerges when it comes to the Microsoft or the Apple nod at this map. According to the graph, in case of the higher management, most of them already had experience of working for some of the top companies in the field. This fact supports the idea that the higher strata of new knowledge labour aristocracy is already defined and is only rarely pulled up from the lower strata.
***
Management ties and education
The following graph is based on the same set of data but visualised in form of the alluvial diagram. It can help us to get a better insight into the educational background of Facebook’s top management and board members.
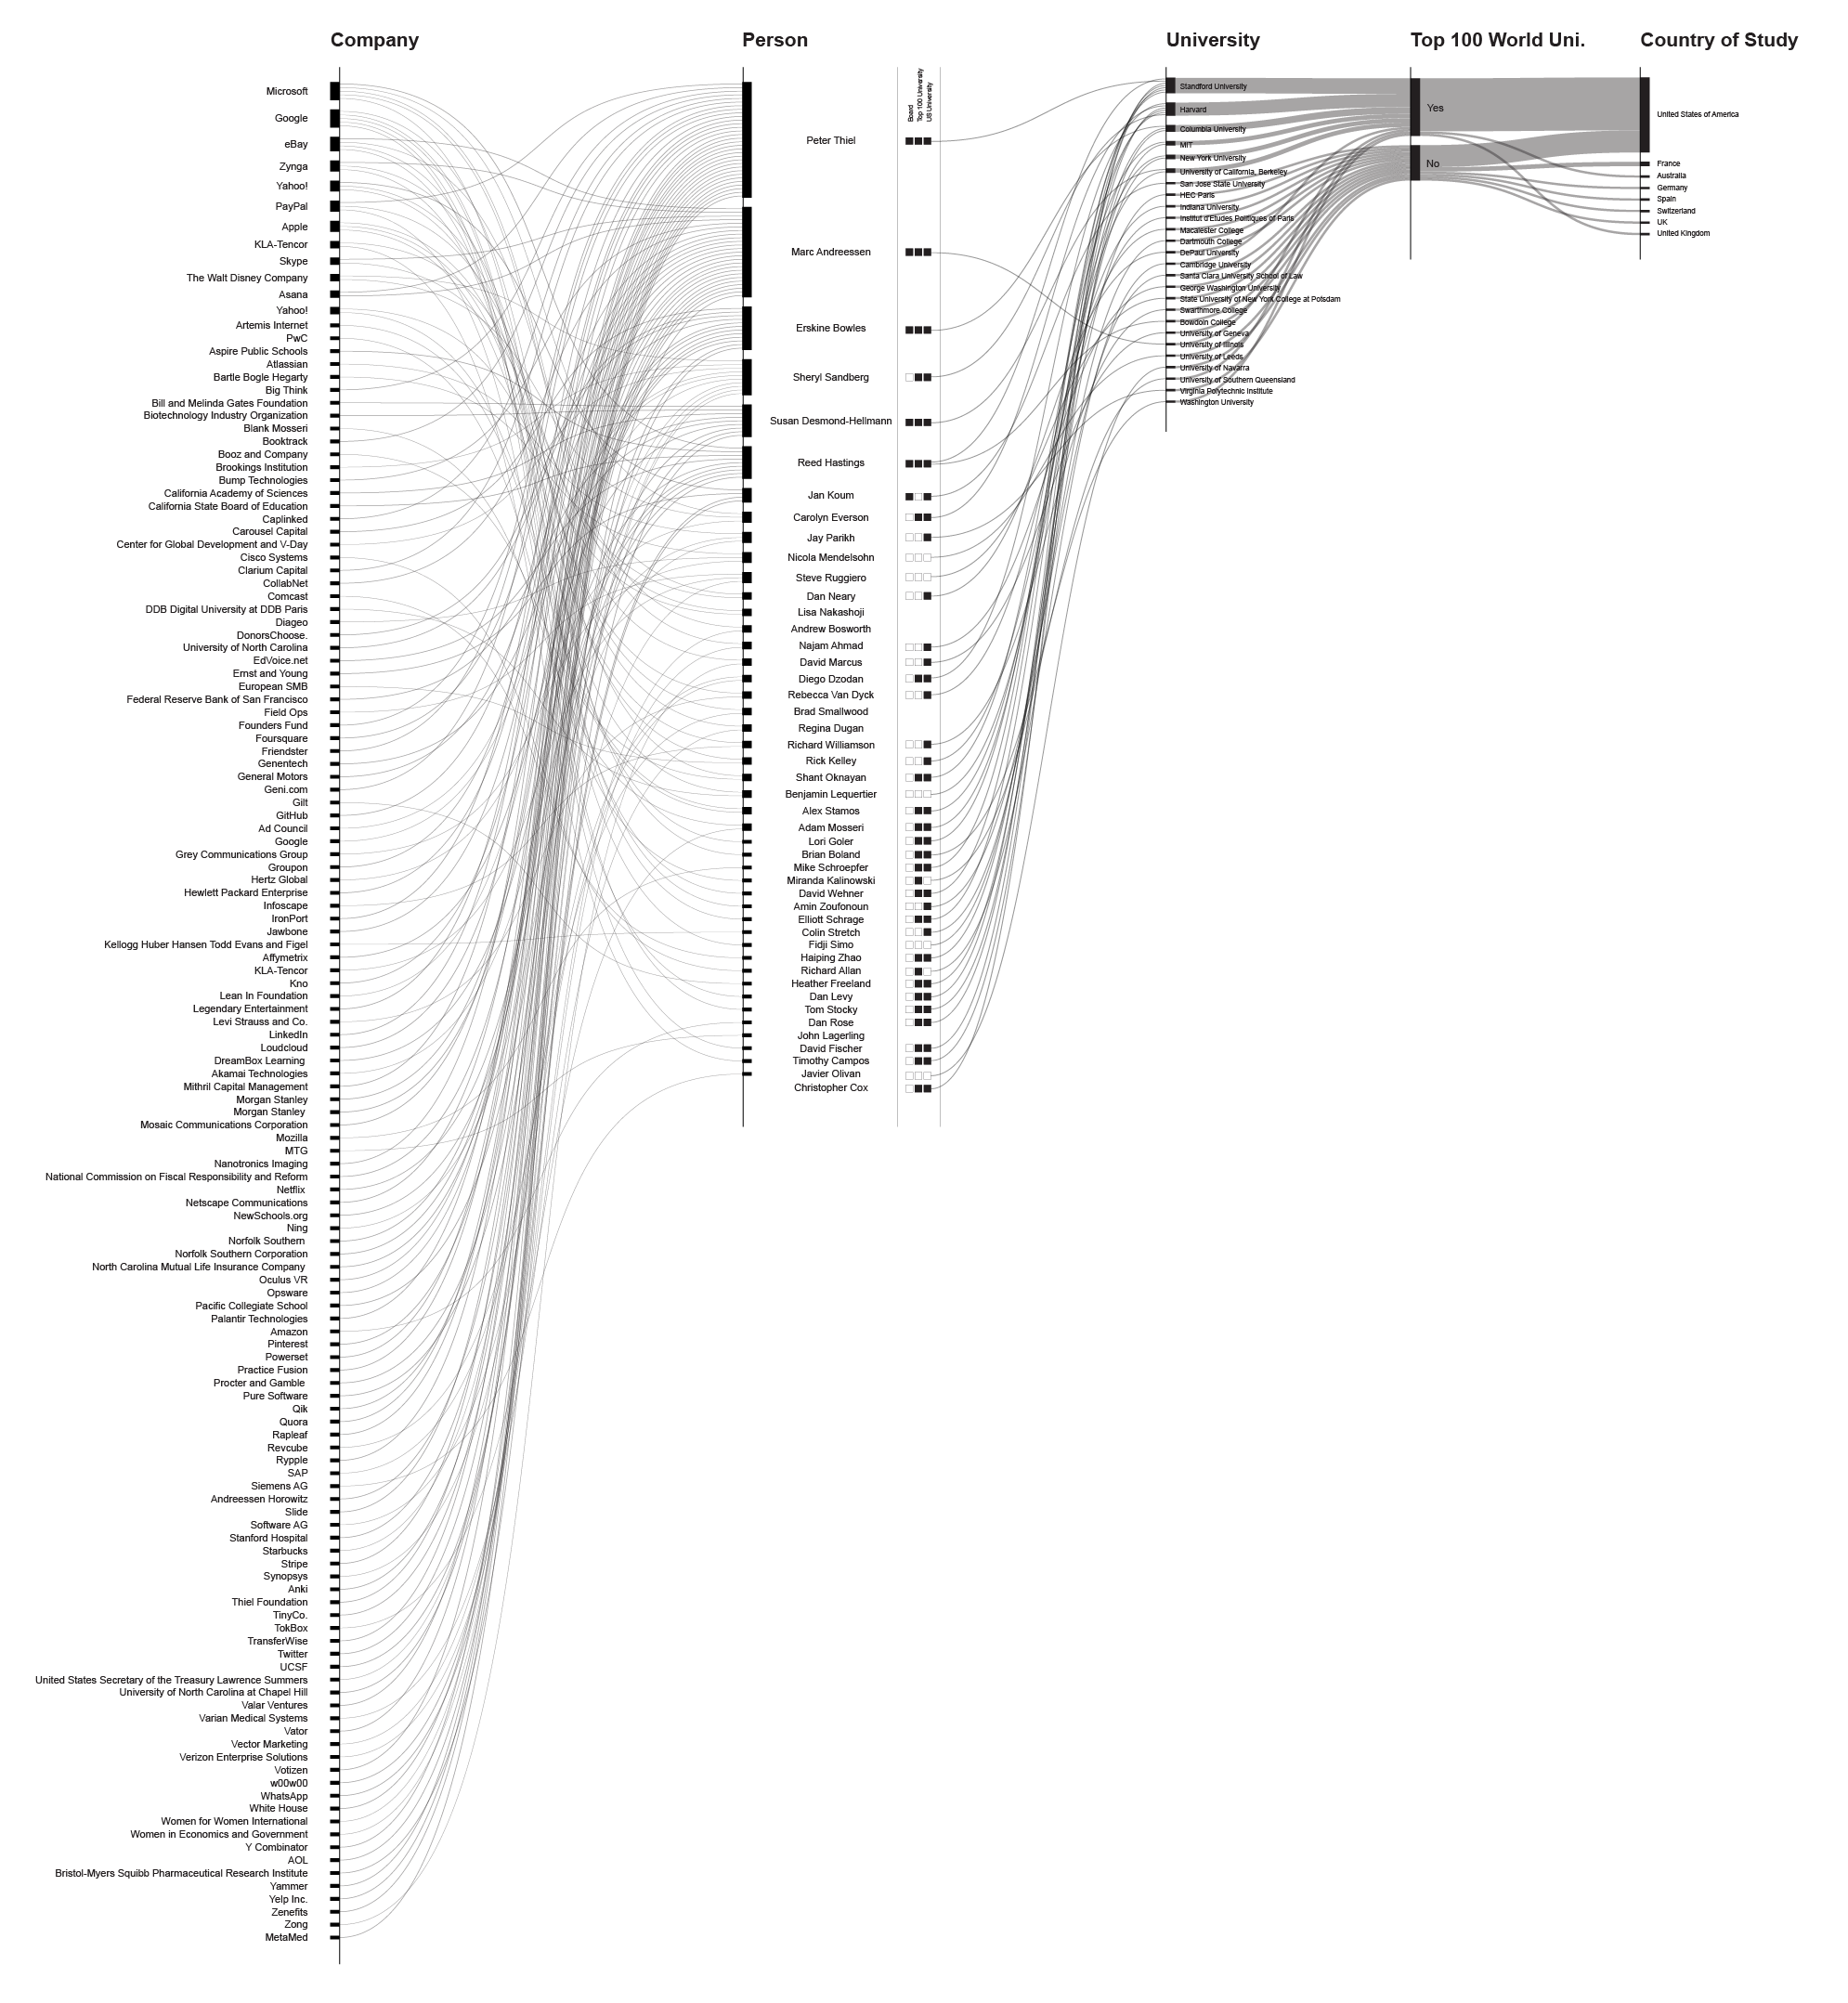
Figure 4: Facebook Management. Ties and Education
It is interesting to notice that people from the managing class of Facebook are not only from the Ivy League universities. They do come mostly from the best ranked U.S. or the best ranked world universities – most of them have been studying at Stanford, Harvard, or Columbia University. However, this is not the criterion for any of them to be at the position they are now. In so far, it could be possible to talk about social mobility concerning the lack of connection between the rise in the company and the educational background. One example is Jan Koum who could be seen as an outsider with his background at San Jose State University, but shows that his experience with Yahoo and Ernest&Young fits the profile of an average Facebook board member – and is benevolent in his own project WhatsApp.[18]

Within the Pyramid: The Adventurous Journey of the Lower Knowledge Strata into Labour Aristocracy
As mentioned above, in order to learn more about the Facebook employees, we were using publicly accessible data from the LinkedIn network. We used modification of Littlefork[19] which scraped the profiles of 1000 people stating in their professional activities that they are or have been working for Facebook. We believe these data are useful only to a certain extent since there is no way of checking their complete accuracy. The total number of Facebook employees in 2015 according to 10-K form was 12,691[20]. We think that for the ethical reasons and social responsibility Facebook should represent in its employee and managerial structure the gender, culture and race of its global market and not only the U.S. American one. The results of our research show that Facebook represents (significant parts of) U.S. political, social, and economic elites instead.
 Figure 5 : Educational and Professional Development of Facebook Employees – PDF Version
Figure 5 shows the professional and educational background of Facebook employees (it does not say anything about the managers and executives). It should be read from the top to the bottom as follows: the country of study on top is the country where the person employed studied, whereas the following category shows the university stated in their LinkedIn biographies. Below that we can see the job position before joining Facebook. The highest number of employees started to work for Facebook right after their studies and majority of them originates from the U.S.A. In other words, only a very small percentage of FB-employees, who began to work for the company immediately after their studies, came from educational institutions outside the U.S.A.
***
The following category shows the professional origin of those employees who came to Facebook as experienced professionals. Most of these people came from the top 20 internet companies in the world; the second-largest group comes with a very similar professional background. However, they did not come from the top 20 companies working online. The third largest group came from the top 20 IT companies.[21] Facebook itself is known for employing in its Research and Development (R&D) department a large number of people with academic backgrounds. According to our data, this percentage is not very high, as can be seen in Figure 5 below. The sectors of consulting, business, finances, and investment together with sourcing and human resources consist of heterogeneous professional backgrounds.
***
After joining Facebook, some employees get relocated. Most of them stay within or move to the U.S.A. However, the number of people working in the U.S.A or moving there is by far larger than the number of Facebook employees anywhere else in the world. The next country with a significant number of Facebook employees is the United Kingdom, followed by India and Ireland. Approximately the same number of employees are located in India, Ireland, and Singapore. The next countries on the list are Japan, Romania, Brazil, and the United Arab Emirates, but these cannot compare in terms of numbers of employees with the places mentioned before. When we talk about urban centres, the largest number of people working for Facebook is located in the San Francisco area. The second-largest city of importance for Facebook is, however, not in the U.S.A. but in the U.K. – London. We see the reason for this large difference in the numbers in the inconsistency and unreliability of the data for the fine-grained personal information such as place of living. One of the facts that confirms problems with the data set is that among the urban centres we also find countries such as Singapore or Ireland. For the same reason, we believe some other cities in the U.S.A. are therefore not represented on this list.
***
Concerning the field of professional activities, the vast majority of the people stated on their accounts that they are working with computer software. The other groups further below are called Internet, Information technology and services, Staffing and Recruiting, Marketing and Advertising. These are problematic and could be regrouped to build larger fields since it seems that at least some of them share the same activity. On the bottom of this graph we see the job list as stated on the LinkedIn profiles. The largest group belongs as expected to Software Engineers. The second largest group goes to Recruiting (HR). Finally, a number of smaller professions are stated (such as Engineering Manager, Research Scientist, Product Manager etc.) which also can be regrouped in larger fields or be to some extent added to the largest group. We don’t doubt the validity of the data for the largest groups and find it plausible that the recruitment takes such an important place for the company. We can conclude from these proportions that the selection process it one of the most important activities in the company’s work (facilitating internal value), and that the engineering field is the most valued one for the company (facilitating products). These relations should be kept in mind while reading the following chapter.
***
Positions at Facebook: Education Profiles and Distribution
The following network and table figures are based on the same database (1000 Linkedin accounts), however, combined with the data about the board members and top management. They show us the institutional and educational background of specific positions and of the members of the management.

Figure 6: Facebook Labour Network Graph – PDF Version
The kinds of nodes are defined as follows (see the upper left corner): white circles mark positions at the company, yellow circles mark board member and the first level executive, and the universities are marked by rectangles.
In the middle of the graph we see the largest accumulation of people and institutions around the job title of software engineer which is not insightful because so many actors are related to it. However, in the upper left corner we can see that engineering managers usually come from seven universities. Colin Stretch, the leading engineering manager in Facebook, studied at one of these universities: Dartmouth College. On the other hand, it should not be a surprise that Harvard attracts the largest number of executives: on the right side of the graph we can see many of them: Elliot Schrage, Diego Dzodan, Lori Goler, Sheryl Sandberg, Carolyn Everson, and Dan Rose. It is especially interesting that the key profession connected here is that of business marketing editor. Mark Zuckerberg, famous as a Harvard dropout, is not directly connected to this school, but is still in its circle. In the upper right corner, an interesting connection appears between the several executive members from different fields such as product engineering and executive recruitment in digital marketing. It is interesting that production engineers are always somehow connected with Massachusetts Institute of Technology (M.I.T.) regardless of the university they originate from. The same goes for the people working in community operations. The executive members concentrated around M.I.T. are Rebecca van Dyck (production engineer), Shant Oknayan, and Tom Stocky. The largest number of board members are concentrated in the lower central part of the map. They are all connected to Stanford University where most of them studied. The job titles related to this institution are People analytics and Payroll associates.
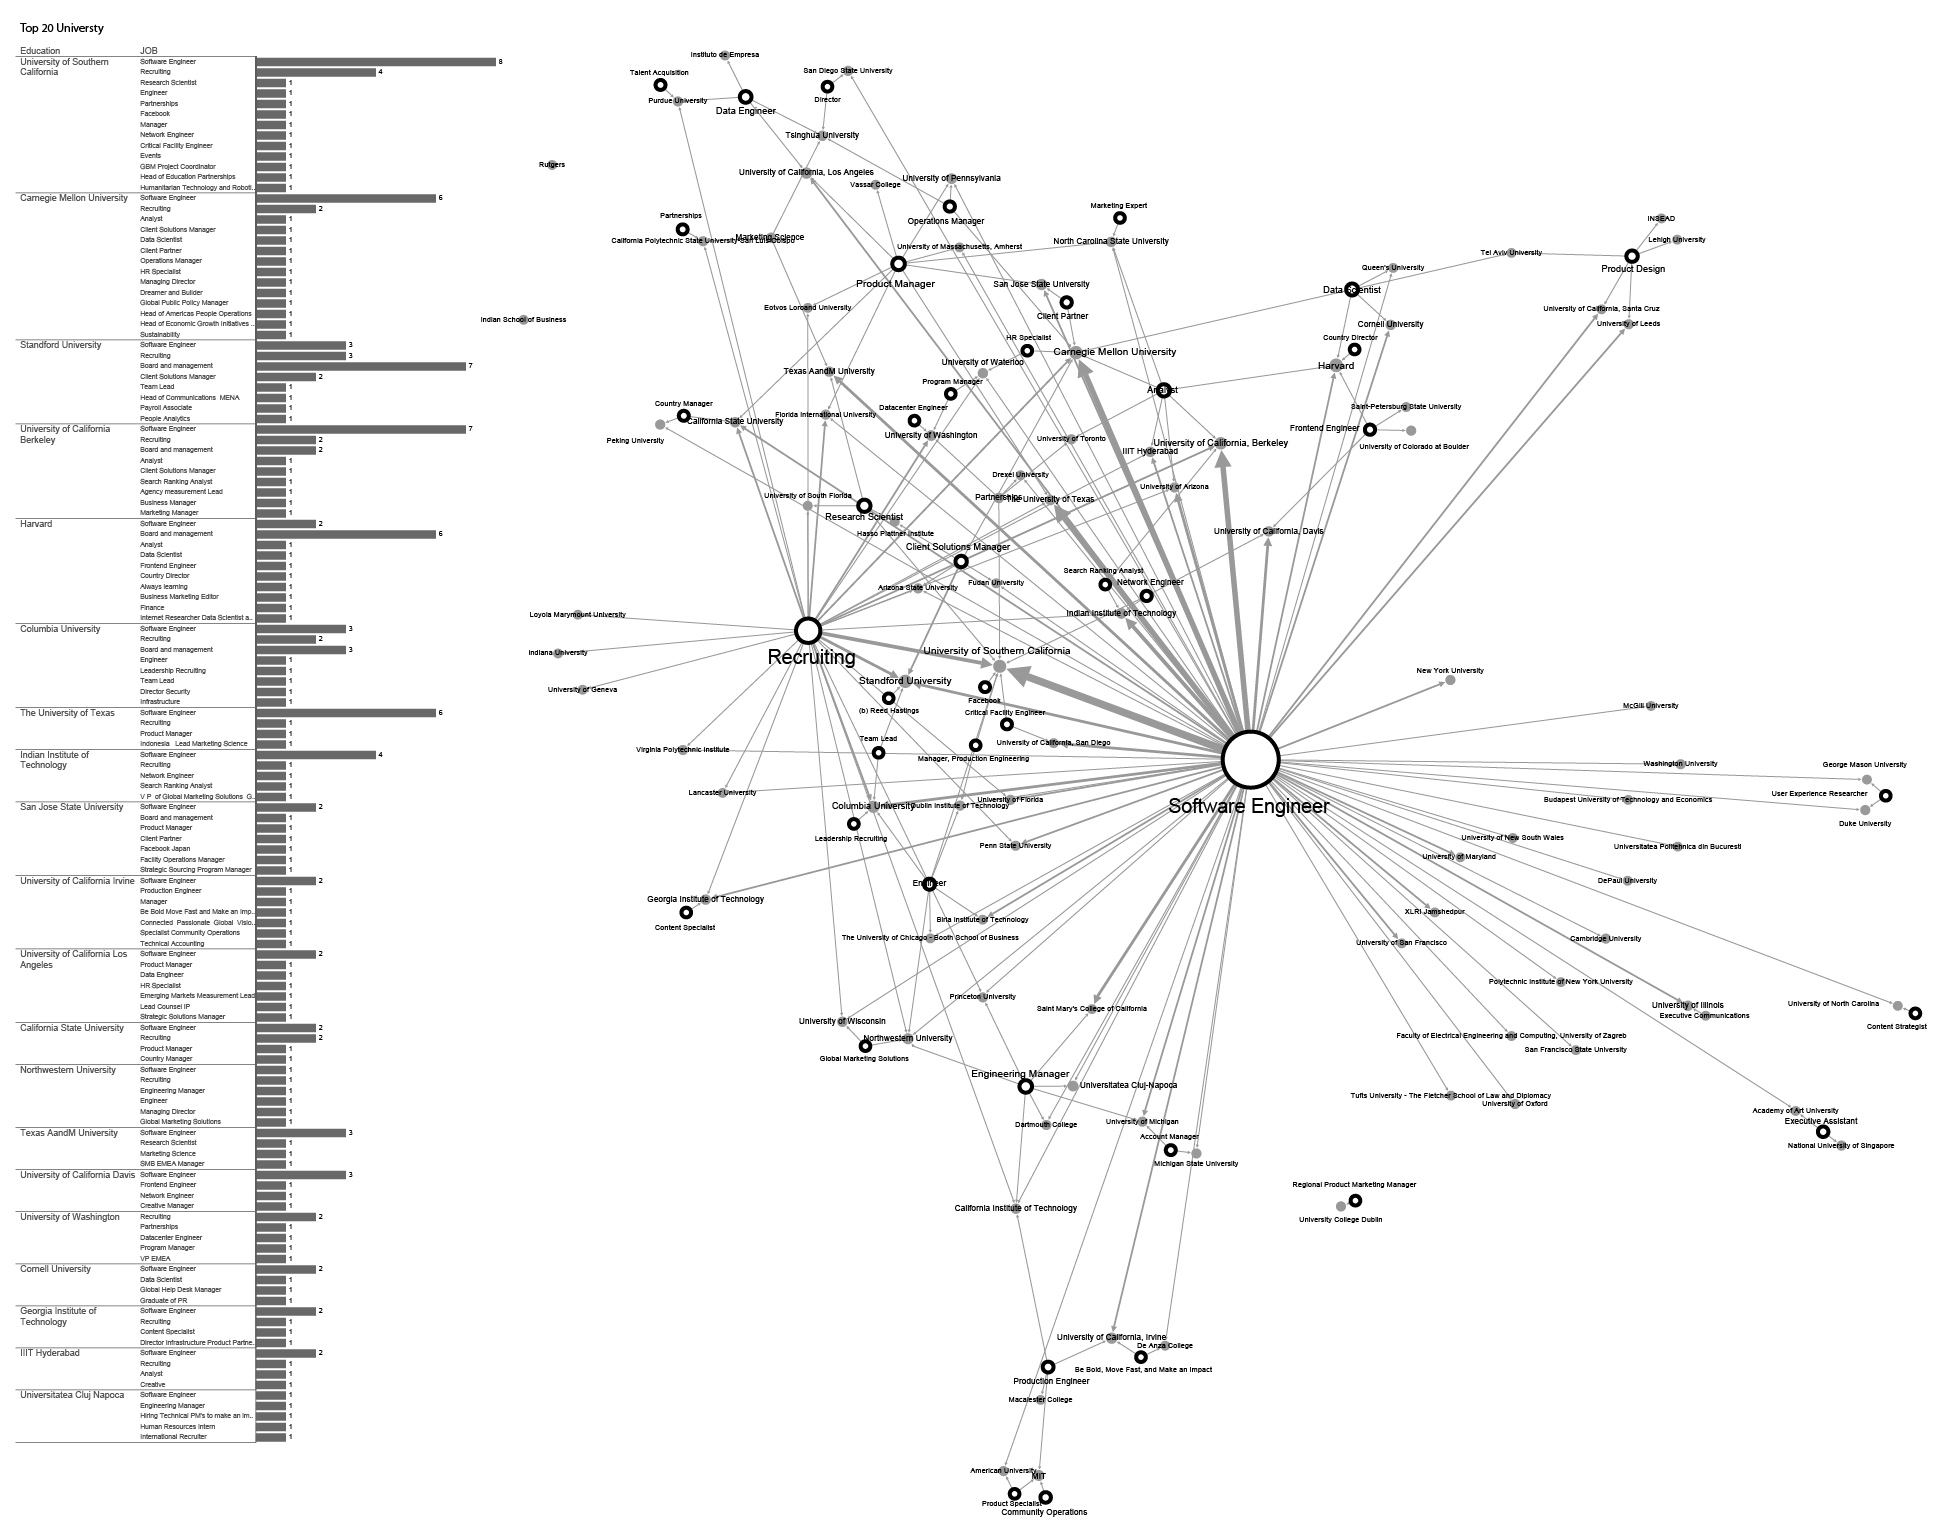
Figure 7: University Background and Position at Facebook
This network and the figure 7 show us even more precisely which job titles and professions are tied to which university. In the table on the left-hand side you can see universities ranked according to how many Facebook employees studied there.
***
Ties and Cuffs
Figure 8 shows previous ties of the board members with significant number of employees who come from the specific company to Facebook. We were interested if we can confirm the tendency that board members bring their colleagues to the new job or at least support this kind of relocation among the companies they themselves are/were connected with.
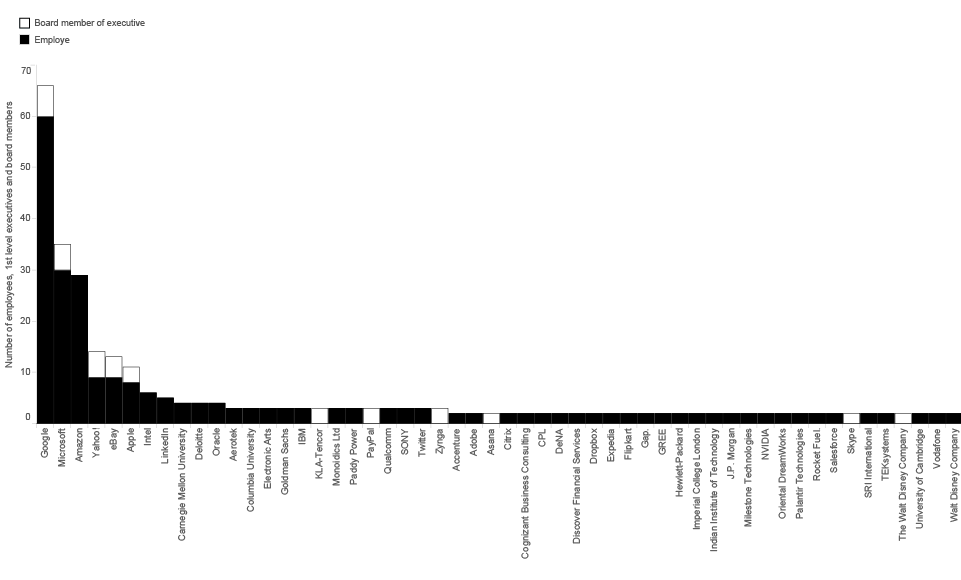 Figure 8: Previous ties
As expected, the largest number of professionals comes from the companies such as Google, Microsoft, Amazon, Yahoo, eBay, and Apple. However, there is significant difference between the ties of Google and Facebook, and all the others. We believe that in spite of all the legal measures against such actions, this graph shows cooperation in competition. Based on the percentage of people circulating among these companies and the positions and professional background of the same employees, this graph makes visible to which extent knowledge and technology exchange takes place between these entities. Such systemic ties could also be seen as building of cartel or some kind of trust which destroys the “industry ecosystem” by the means of controlled monopoly. It is hard to believe in real competition, if the competing companies share the knowledge base, experts and boards. Of course, the public data we are operating with can only indicate the possibility of the problem, they do not serve as the evidence of any kind.
***
Migration of labour: Agglomerations vs. Deserts
We already described some of the relocation processes among the FB employees around the world. On our Migration of Labour chart, it is possible to see the relation between the current country (horizontal, above) and the country of study (vertical, on the left side) of the 1000 evaluated profiles from the LinkedIn.
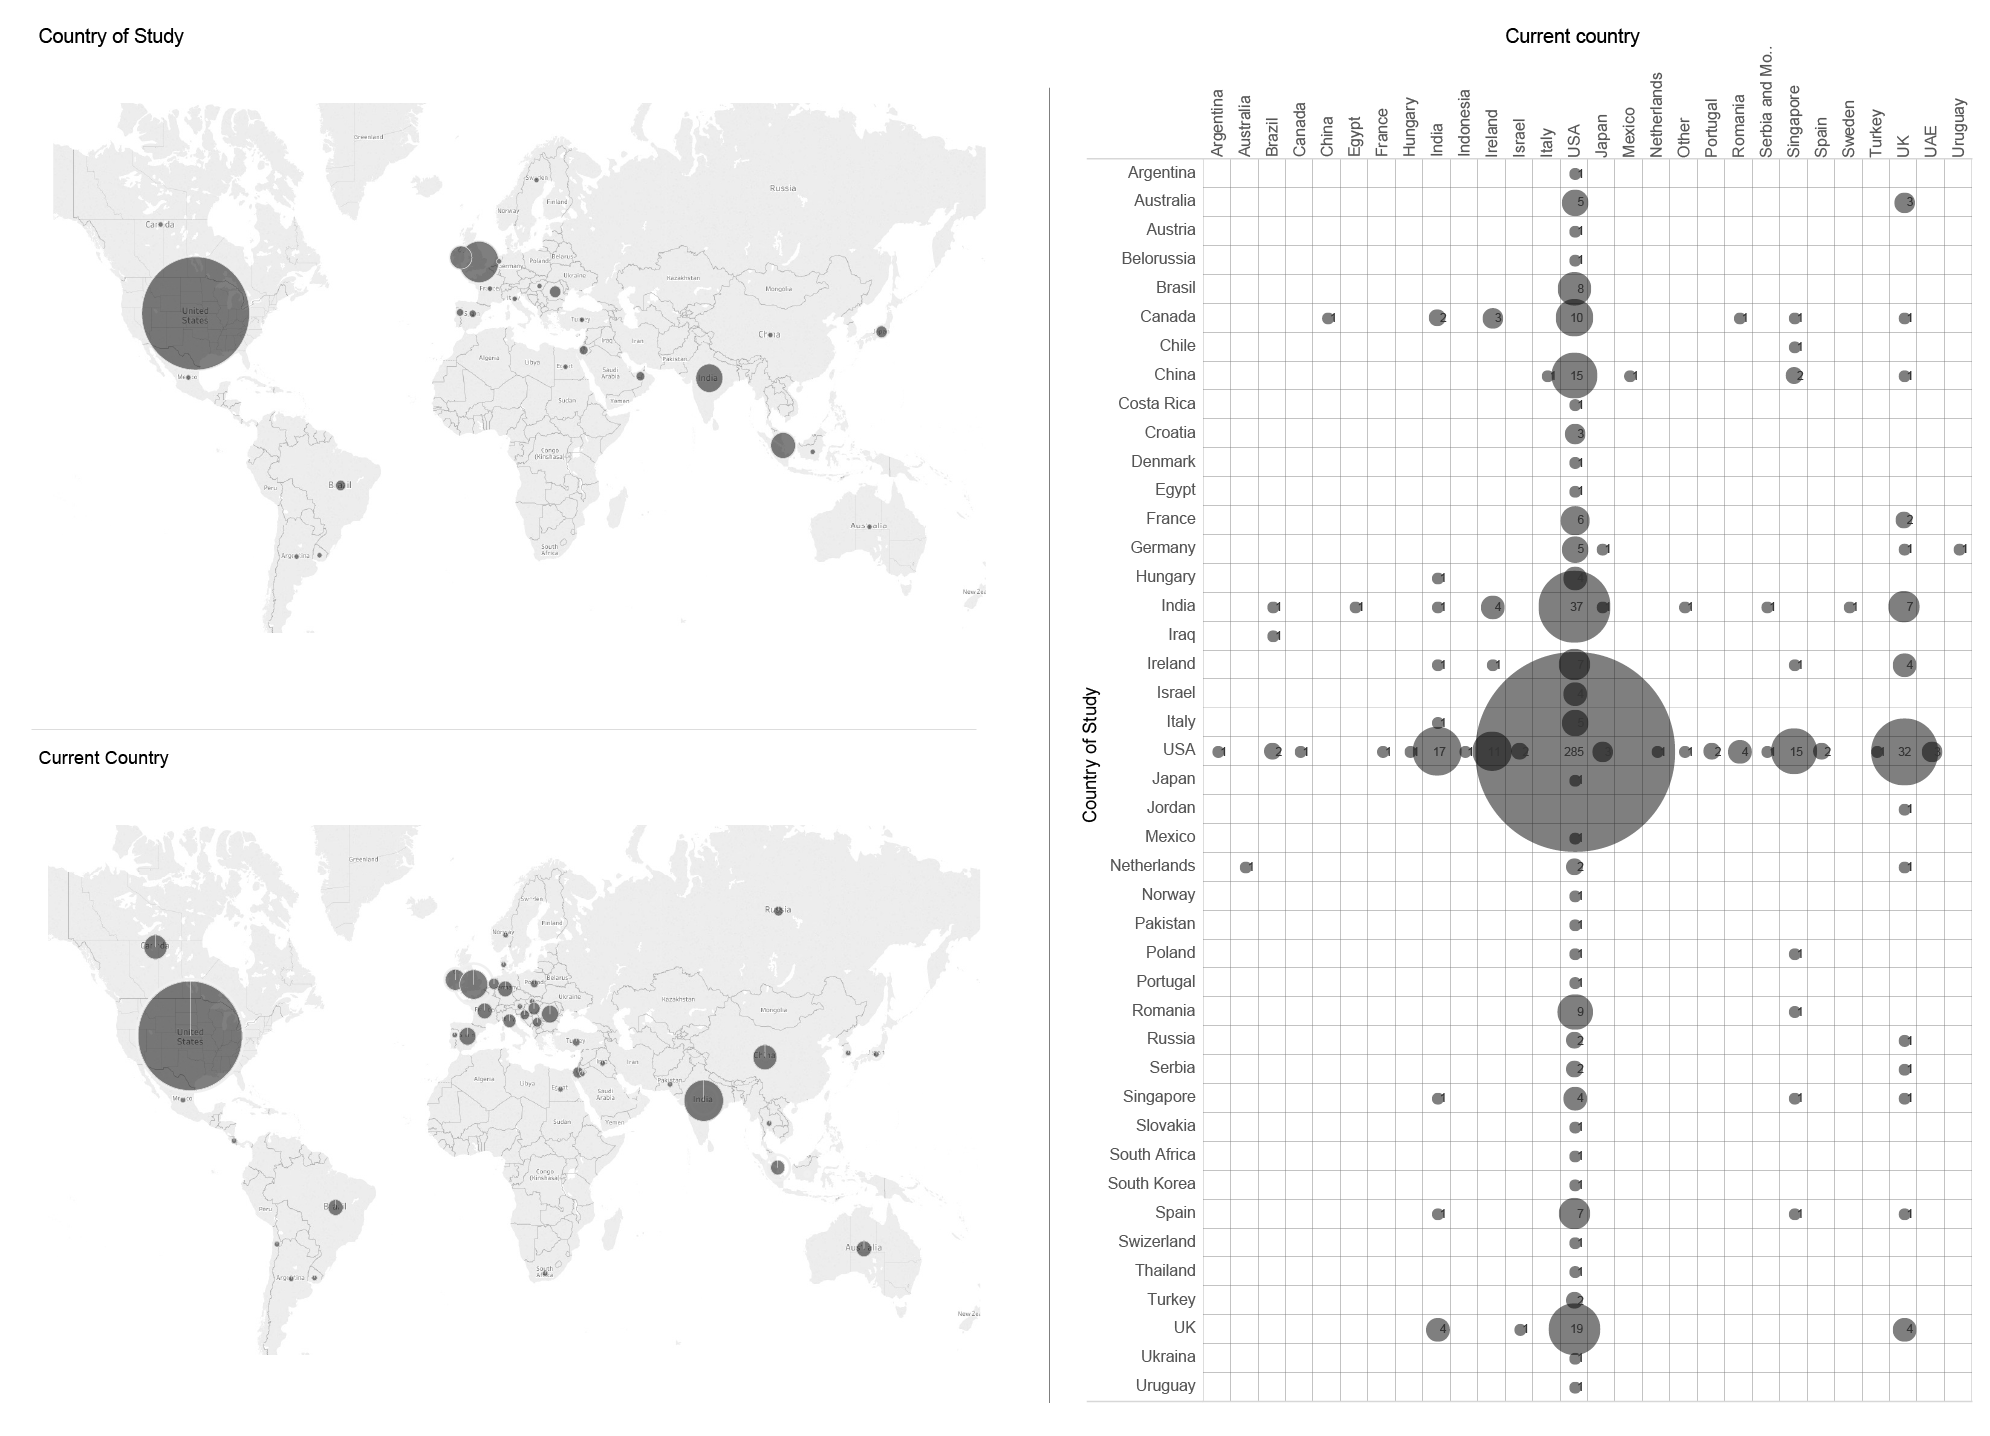
Figure 9: Migration of Labour
By comparing these two axes we can see the country where the person was studying and where he or she went after the studies. Most of the employees are attached to the U.S., as visible in the central crossing point marked by the grey bubble. Also, the largest number of people went to the U.S. after their studies, as visible at the same dot. Most people who left the U.S. after studies, went to work for Facebook in the U.K., India or Singapore. All these places are known for their FB-offices. This chart shows that Facebook as an employer mostly recruits people from U.S. universities. This means that in spite of acting globally, this company does not see the need to represent the structure of its users around the world. As seen before, the dominance of the U.S.-based education is obvious also in the managing board. We can speculate if the HR and Recruiting officers have a policy (which does not have to be an official one or in written form) of focusing on the people from the U.S. education system.
The same data can be visualized in a form of the maps, where current location and country of study of the employees is represented by the dark grey colour.
The Human Fabric of the Web
Sketching out the the social structure of a large company such as Facebook is a task which is important not only in order to understand the impact of such a global internet phenomenon as the social network on the society, local and global economy, and civil freedoms, but also to better understand how the development of high-end technology and communication infrastructures intertwine with the accumulation of capital and political power. Even though the world is at the point of postglobal development (a point where global is already reached and the new local is what the market needs), the deep embeddedness of the company in the economic, political and social elite/establishment of one society/country is what makes the company strong enough to act globally – and not, as is often thought, through the cooperation of the elites around the world. The comparison with the pyramid or the Leviathan comes handy because of the many social tiers and faces that build up to the one which stands in the centre and is known to everyone. At the same time, as our investigation shows, the real fabric of the web consists of the personal social networks of specific people in the higher strata of the company. If anything other than its profit, this is what keeps the whole structure together and safe from any change in the political establishment.
 Illustration by Abraham Bosse for the book “Leviathan” writen by Thomas Hobbes (1668)
Specific ties which create the network are not hidden, even though the myth says that the invisible puppet master pulls the strings. As we can see, it is actually a relatively complex network of many knots with dynamics driven by the interests of specific actors. Companies of this size influence, organise, and determine the lives of elites, the global economy, the everyday life of “small people” or “average users” (as we can define the people today). It is important to describe precisely how and to which part of the network which actors are tied. Once we understand the deep intertwining of the large companies with politics, it is easier to recognise and articulate the support of those forces in the political arena which are pleading for the legal separation of these branches of society.
***
Credits:
Data analysis and data interpretation: Jan Krasni
Data organisation, analysis and visualisation: Vladan Joler
Data collection: Christo and Andrej Petrovski
Thanks to Fieke, Leil, Christo and Claudio from Tactical Tech and Oli, Andrej and Psyho from SHARE Lab for the week of collaborative data collection and investigation that lead to the data set used for this research. Thanks to Kate Maxwell for hints on language and sadistic comments, and Steven Surdiacourt for the help with formulations. Thanks to Jaspal Singh for the challenging comments and the final touch.
–
Share Lab & Tactical Tech
Made mostly in Berlin, Novi Sad and Belgrade in 2016 and 2017
***
Literature:
Bourdieu, Pierre (1982). Der Sozialraum und seine Transformationen. In: Die feinen Unterschiede – Kritik der gesellschaftlichen Urteilskraft. Frankfurt am Main.
Bourdieu, Pierre (1997): Zur Genese der Begriffe Habitus und Feld. In: Der Tote packt den Lebenden, Hamburg.
Fuchs, Christian. 2016. Critical Theory of Communication. London: University of Westminster Press. DOI: http://dx.doi.org/10.16997/book1.b. License: CC-BY-NC-ND 4.0
Krüger, Uwe (2013): Meinungsmacht. Der Einfluss von Eliten auf Leitmedien und Alpha-Journalisten – eine kritische Netzwerkanalyse. IPJ, 2016
Krüger, Uwe (2016): Mainstream. Warum wir den Medien nicht mehr trauen. C.H. Beck, München
Internet sources:
https://www.statista.com/statistics/273563/number-of-facebook-employees/, (15/9/2016)
https://www.statista.com/statistics/311836/facebook-employee-gender-department-global/, (15/9/2016)
https://www.statista.com/statistics/311847/facebook-employee-ethnicity-us/, (15/9/2016)
https://www.crunchbase.com/organization/facebook#/entity, (12/9/2016)
http://www.theofficialboard.com/org-chart/facebook, (20/9/2016)
https://exposingtheinvisible.org/resources/obtaining-evidence/revolving-door-google (10/6/2016)
https://googletransparencyproject.org/articles/googles-revolving-door-us. (15/10/2016)
http://www.economist.com/news/briefing/21637338-todays-tech-billionaires-have-lot-common-previous-generation-capitalist (15/10/2016)
https://www.crunchbase.com/organization/facebook#/entity (on 1/3/2017)
https://www.theofficialboard.com/org-chart/facebook (15/2/2017)
http://a16z.com/, https://en.wikipedia.org/wiki/Andreessen_Horowitz, (11/5/2016)
https://en.wikipedia.org/wiki/Palantir_Technologies, (11-9-2016)
https://techcrunch.com/2015/01/11/leaked-palantir-doc-reveals-uses-specific-functions-and-key-clients/, (3/5/2016)
https://en.wikipedia.org/wiki/United_States_Secretary_of_the_Treasury, (23/11/2016)
https://www.fiscalcommission.gov/, (12/5/2016)
https://en.wikipedia.org/wiki/National _Commission_on_Fiscal_Responsibility _and_Reform, (12/5/2016)
https://en.wikipedia.org/wiki/Morgan_Stanley, (14/5/2016)
https://www.morganstanley.com/,(14/5/2016)
https://en.wikipedia.org/wiki/General_Motors, (17/5/2016)
www.gm.com, (17/5/2016)
Tools:
Data collection – Littlefork (https://www.npmjs.com/~tacticaltech)
Data visualization – Gephi, Tableau, RawGraphs
Footnotes:
[1] The term Dispositif deals with the whole socio-technical network which we cannot always see, but are immersed into in the everyday life. It corresponds rather with the Agamben’s term apparatus than with the Foucault’s original term.
[2] This text is written in the moment of a “power vacuum” and the “regime change” between the Democratic and the Republican party in the United States. This means that the ties between the industry and the establishment are to be rearranged and that this text shows only the present state. Some new social networks between the actors we are analysing here and the political stakeholders will come to place in the near future. There is no doubt that the ties between the establishment and the infrastructures will go loose.
As for the revolving door issue topic, check the: https://googletransparencyproject.org/articles/googles-revolving-door-us and https://exposingtheinvisible.org/resources/obtaining-evidence/revolving-door-google (10/6/2016)
[3] http://www.lombardinetworks.net/
[4] http://www.theyrule.net/
[5] littlesis.org
[6] https://bureaudetudes.org/
[7] Fuchs, Christian. 2016. Critical Theory of Communication. Pp. 47–73. London: University of Westminster Press. DOI: http://dx.doi.org/10.16997/book1.b. License: CC-BY-NC-ND 4.0
[8] This paragraph is based and the quotes come from the Economist’s article from 2014: “Robber barons and silicon sultans”: http://www.economist.com/news/briefing/21637338-todays-tech-billionaires-have-lot-common-previous-generation-capitalist (15/10/2016). We will reference it as Economist 2014.
[9] It is important to state that in this article we did not investigate different shareholders of the Facebook company nor we considered the invisible labour in Facebook related companies in third countries (or in ‘third world countries’). This would take too much time and would go beyond the borders of the topic. However, we do plan to elaborate on this topic in one of our future articles in the Facebook Research series.
[10] https://www.crunchbase.com/organization/facebook#/entity (on 1/3/2017) and https://www.theofficialboard.com/org-chart/facebook (on 15/2/2017)
[11] http://a16z.com/, https://en.wikipedia.org/wiki/Andreessen_Horowitz, (11/5/2016)
[12] Having percentage of stocks does not mean one is also in command (of technology for example). However, Andreessen is usually either investor or the board member of the mentioned companies, which certainly gives him possibility to help his companies both with technology and insider knowledge and to get any kind of information from them. Competing and cooperation of those companies gets through this a new quality.
[13] https://techcrunch.com/2015/01/11/leaked-palantir-doc-reveals-uses-specific-functions-and-key-clients/, (3/5/2016)
[14] https://en.wikipedia.org/wiki/United_States_Secretary_of_the_Treasury, (23/11/2016)
[15] National Commission of Fiscal Responsibility: https://www.fiscalcommission.gov/, (12/5/2016) and https://en.wikipedia.org/wiki/National _Commission_on_Fiscal_Responsibility _and_Reform, (12/5/2016).
[16] Morgan Stanley: https://en.wikipedia.org/wiki/Morgan_Stanley, (14/5/2016), and https://www.morganstanley.com/,(14/5/2016).
[17] General Motors: https://en.wikipedia.org/wiki/General_Motors, (17/5/2016), and www.gm.com, (17/5/2016).
[18] It is clear that people like Koum are not on the board because of their education, but because of what they brought to Facebook – in this case it was the WhatsApp with all of its user data. But it is also clear that some (sets of) skills correspond with the rest of the community.
[19] https://www.npmjs.com/~tacticaltech (15/08/2016)
[20] https://www.sec.gov/Archives/edgar/data/1326801/000132680116000043/fb-12312015x10k.htm (16/09/2016), check also: UNITED STATES SECURITIES AND EXCHANGE COMMISSION Washington, D.C. 20549 FORM 10-K
[21] There are important differences in the field of work between internet and IT companies, and there is usually not too much significant overlap between their primary purposes. In order to understand this better, one may think about Yahoo and Microsoft and their official division of work.
]]>

The room in which Mr. J woke up was situated in a unique 103-metre tall building called People’s Park Complex, the first shopping centre of its kind in Southeast Asia that has set the pattern for later retail developments in Singapore. That Friday morning, the view from the 22nd floor of this soc-extravagant building was gorgeous.

The weather was clear, hot and humid1, usual for April, so the fact that the water in the shower was not hot enough did not bother Mr. J too much. Who needs hot showers in the tropical climate of Singapore, anyway?

This place was the home base for Mr. J’s quest during his last couple of days in Singapore, where he flew in from Hong Kong on April 7th. The previous week was the mix of different meetings around town, and there were few things on Mr. J’s mind other than his love of burgers (something that he really likes to explore in different places on his travels). This time his main interest was a combination of online dating websites for singles, night clubs around town, immigrant women workers’ issues and expat situation in this busy and hectic Southeast Asian port. Being an expat in Switzerland himself2, this topic probably resonated with him.
This was almost a relief, since the thoughts occupying him in the previous weeks, stimulated by dozens of texts, YouTube videos and documentaries, were mostly focused the on dark aspects of war mercenaries, British and American forces in Afghanistan.
The day started like any other. It was 01:36:04 at his home in Zurich 3 and 8 hours more in Singapore when Mr. J took his laptop computer and went on to browse the web.
He started at slow pace for the first 20 minutes, on and off his keyboard; he googled “Singapore young actress”, watched LinkedIn page of one of the managers of the FehrAdvice & Partners AG4 from Zurich area, took a look at the “starlet in Singapore Joicy Chu” and read Wikipedia article about the Academy Award winning documentary “Taxi to the Dark Side”5, about killing of an Afghan taxi driver who was beaten to death by American soldiers while being held and interrogated at Bagram base.

Before diving deeper into his Singapore explorations, he checked out two websites about job interview tips and tricks. Looking for new job opportunities online was part of his morning routine for some time now. Incidentally or not, around an hour later his thoughts would wander off to the matter of mid-life crisis. After a 12-minute break, he started to plan his day around town. First thing that he needed to do was to pop by 354 Admiralty Drive, an hour long ride on the public transport to the north of the city.
Probably feeling uncomfortable with the idea of going to such a faraway place at the completely opposite part of the city, Mr. J was zooming in and out Google map and checking different options several times.
Next location that Mr. J was interested in was more promising – The Swiss Club, founded in 1871 when it was known as The Swiss Rifle Shooting Club of Singapore, where friends of Mr Otto, the founder of this place, gathered with their rifles for some serious shooting practice in the forest at Balestier Road. Today it is a fancy upper class club with a swimming pool, a restaurant and a guest house.
At this point we will leave Mr. J to the privacy of his own thoughts.
I
Exploring Browsing History
This story was based on just a tiny excerpt, a two-hour sample, from the internet browsing history of a Swiss journalist J. B. In late June 2015 he visited the Tactical Tech office in Berlin as he was assigned to lay open his private life and see what can be told from the data he creates on his devices.
A year later, we gathered in Berlin for a week of data investigations and one of the data sets that we explored was the browsing history collection of Mr. J. Our goal was to find out how much we could learn from someone’s browsing history or, to rephrase it, what others can learn by exploiting data from our own browsing history.
Finding the real name and social graph behind browsing history
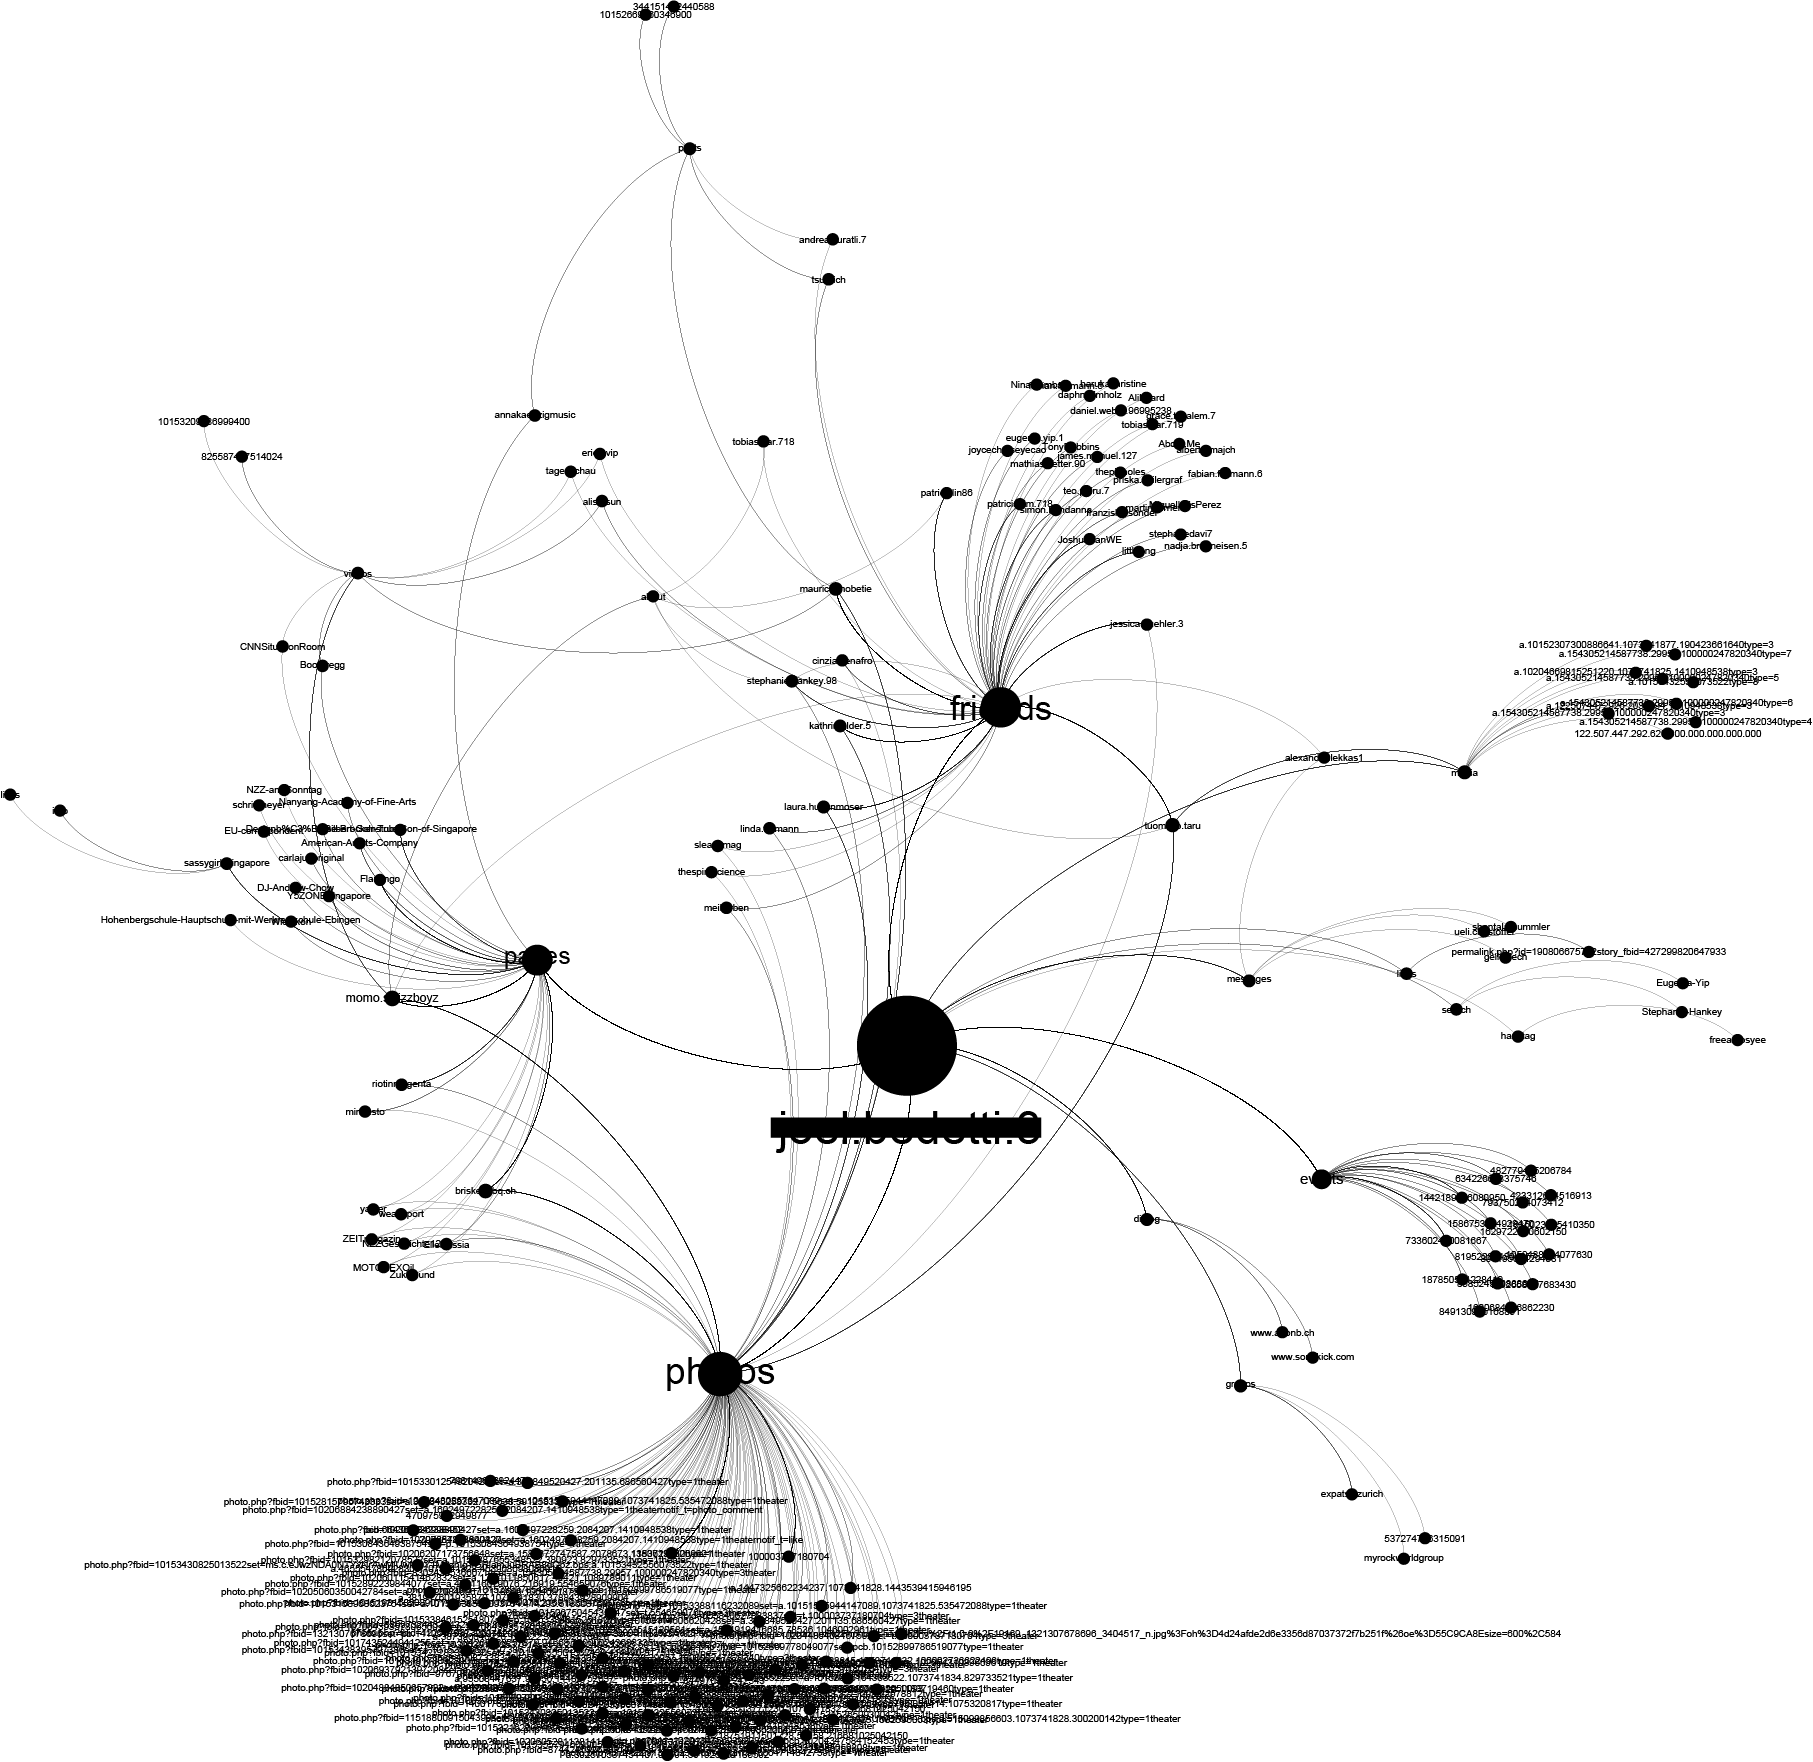
It took us just a few minutes of looking into the dataset to associate the real name of the person behind this browsing history. Just by sorting his Facebook traffic, i.e., the profile pages he visits, we were able to identify the real person. Since Facebook is enforcing a “real name policy” this is a neat way to link someone’s browsing history with their real name. For a more structured approach, there are numerous academic papers6 and models on how to uniquely identify users according to their browsing patterns and behaviors. Exploring Facebook URLs reveals much more than someone’s identity. Based on the structure of the URL we were able to reconstruct a part of this person’s social graph.
Mr. J’s intentions, desires, needs, and preferences
In his 2005 study, the industry analyst John Battelle describes Google as a ‘database of intentions’, ‘a massive clickstream database of desires, needs, wants, and preferences that can be discovered, subpoenaed, archived, tracked, and exploited for all sorts of ends’7. Exploring search queries from someone’s browsing history can give us some clues about this common relationship, probably the most personal one, between a person’s mind and this giant company.
Different forms of Google related URLs can reveal different interesting information. First, the most basic info is hidden in the country domain. Based on this alone, we were able to discern from which country Mr. J was browsing the web.
The following graph represents the online universe of Mr. J’s, consisting of all the websites that he had visited in a period of two months. From this social network analysis, we can see that Google has a dominant, central place in his online activities.
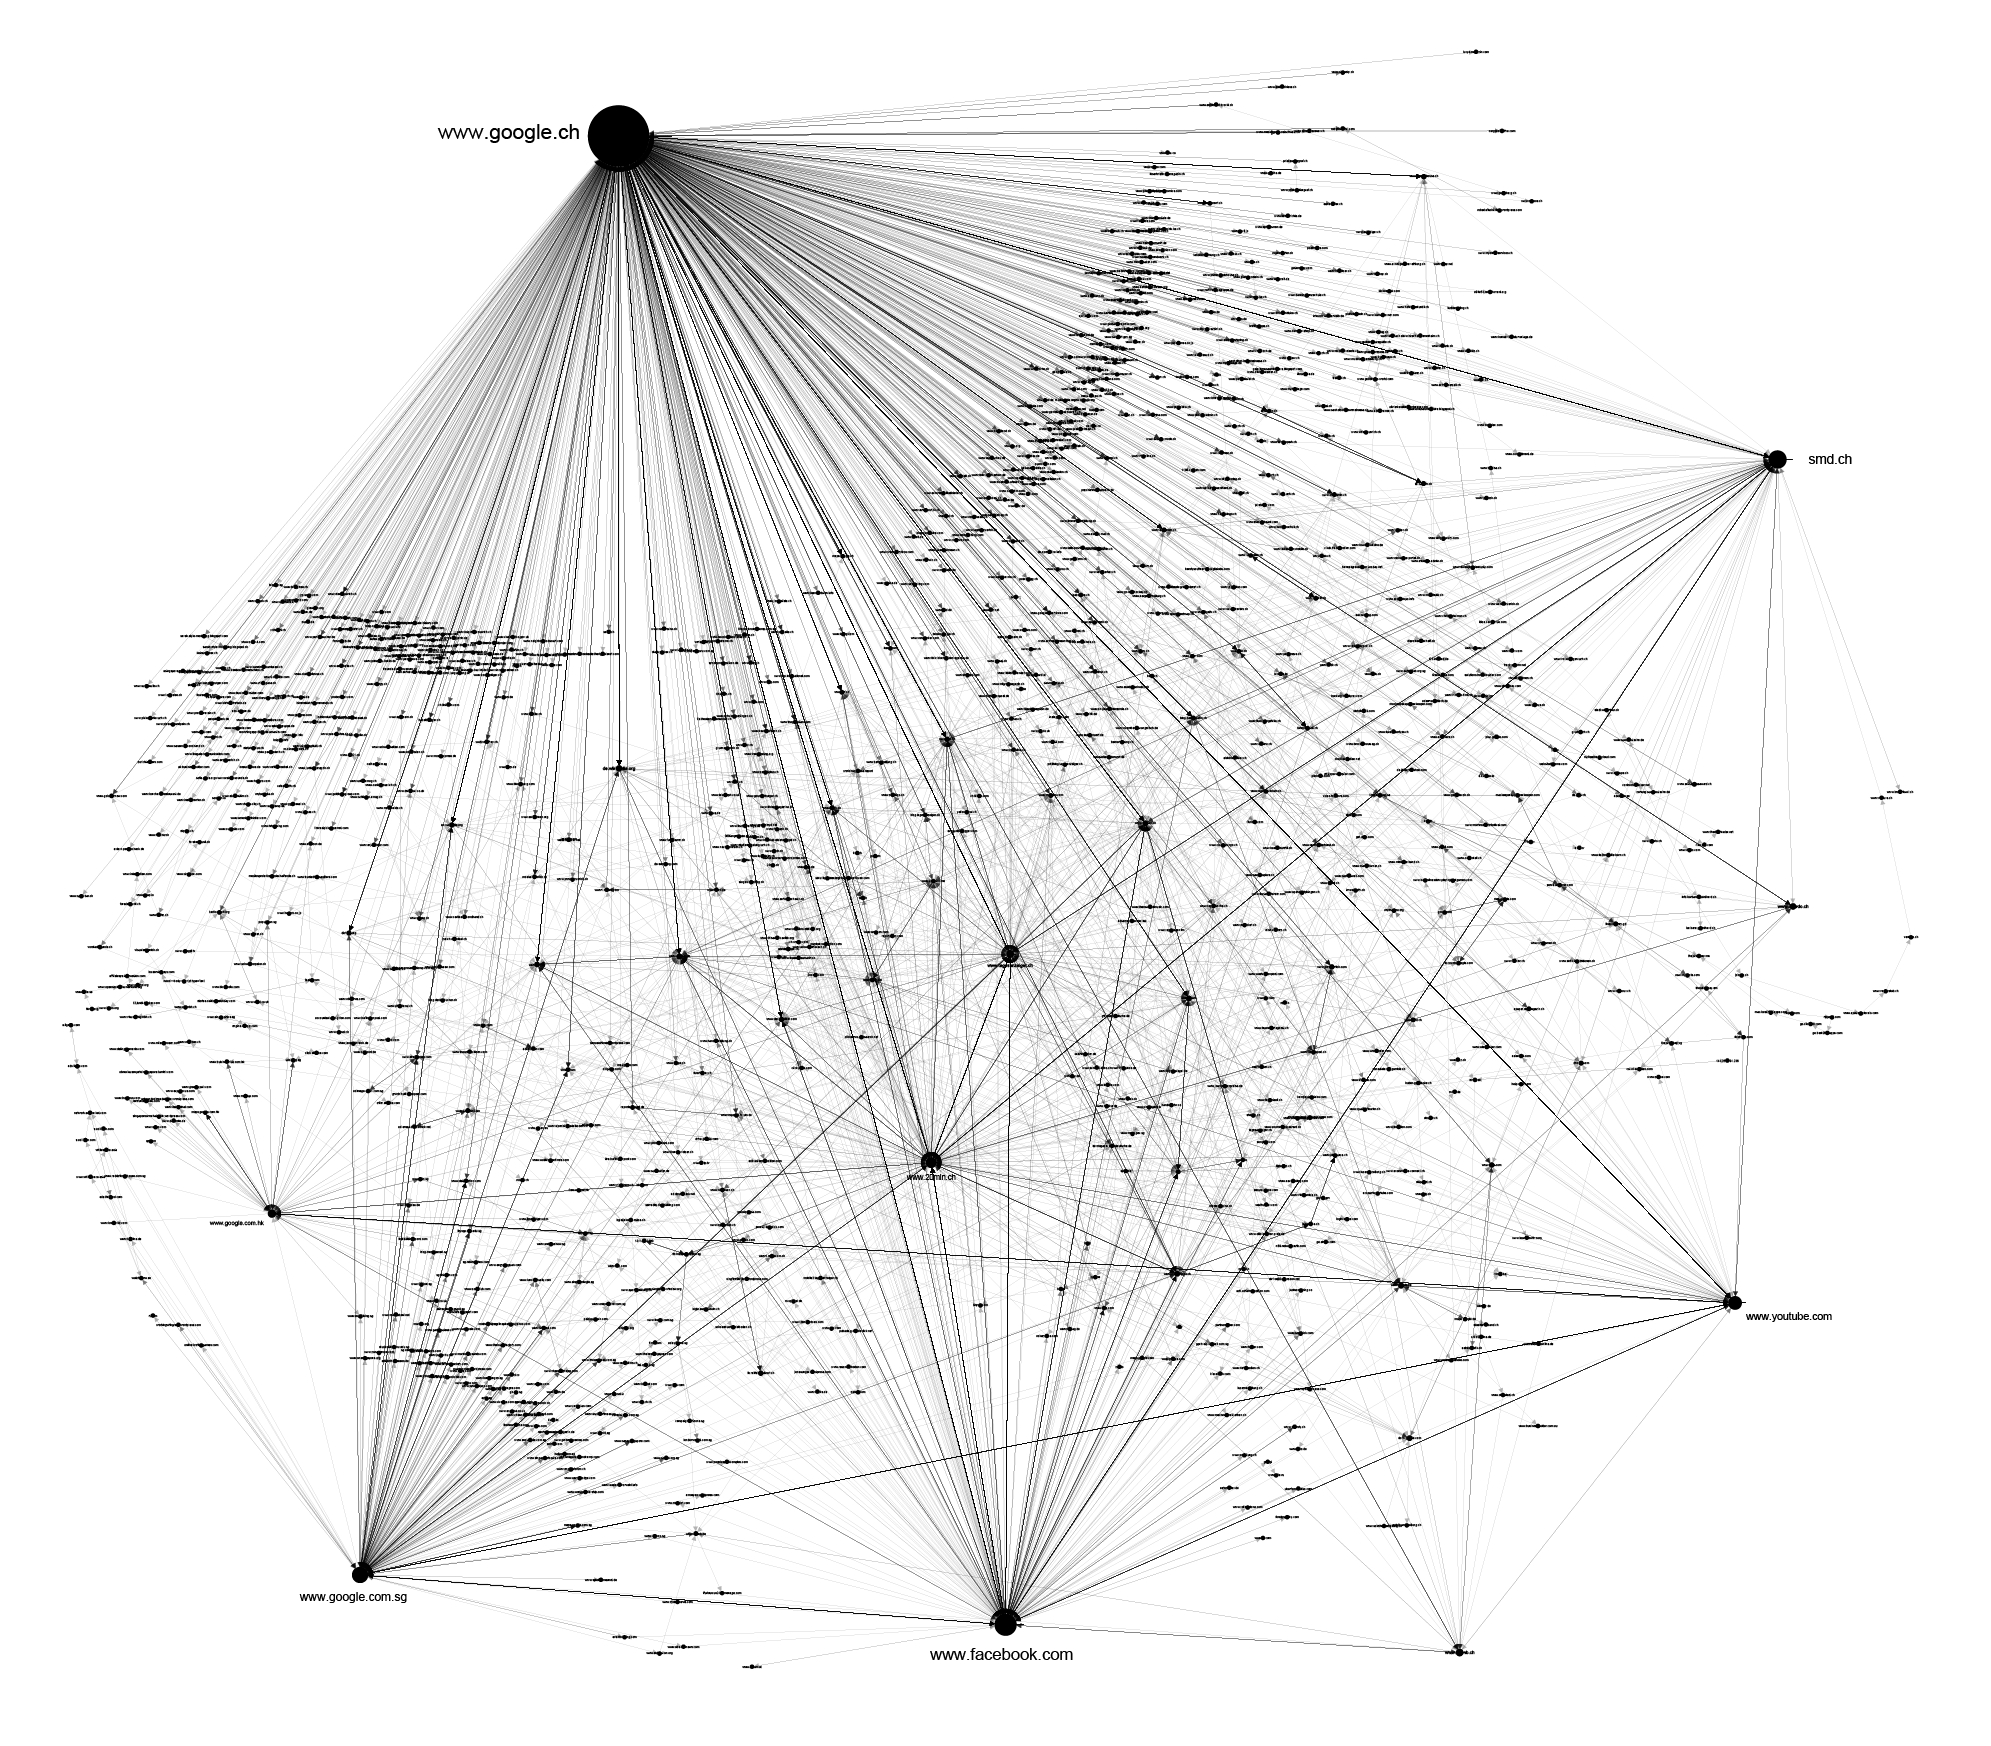
By parsing just query segments of Google URLs we can follow the dynamic of Mr. J’s interests, needs, and lines of thought during that time. If URLs from YouTube, another Google service, are added to this, the ‘cloud’ of Mr. J’s thoughts is even more complete.
Reality mining: Where is or where Mr J wants to be
These days it is hard to avoid geographic information systems, such as Google Maps. By merging the physical layer with multiple information layers, enhanced with location data from your mobile phones, they have established themselves as an essential tool for navigating the physical space, complex public transportation systems of big cities, commercial and social services, historical information, and even spaces consisting of wild Pokemon creatures and their training centers. They allow us to move through the physical space on an autopilot.
But those geographic information systems provide us services that collect not only our online behaviour data but also information on how we interact with physical space.
When Mr. J searches for some location on Google Maps, or tries to find a route to his next destination, we can easily extract information about that from his browser history. It feels really intrusive to see, for example, URLs that represent the exact routes and transportation that Google Maps suggested to him, or to see from browsing logs the spots on the maps he was zooming in or out. Not all of those location tags represent his exact location in time, some of them can be interpreted as his intentions, desires or preferences. Put together, this information can outline a profile in physical-informational landscape, where his actual locations in time are mixed with locations of his interests or desires.
Bed and Breakfast
Exploring other services that we can find in someone’s browsing history, can provide more insight into someone’s life. We started this story with the bed in which Mr. J woke up in Singapore. We got the picture of his bed from the Airbnb page we found in his browsing history. There is a clear pattern that we can discern when someone is choosing which apartment to rent on Airbnb.

Usually it begins by browsing different options, but then, when a decision is made in the mind of a user, they need to get in touch with the apartment’s owner, and that is an event that can be seen in the browsing history. Crossing this information with URLs from Google Maps for example, can help us confirm the location and time of someone’s stay in that particular apartment.

There are numerous other services that we can explore. For example, browsing through someone’s Yelp history can help us get a picture about their food preferences. Again, a combination of different services can reveal a line of thought and events, and help reconstruct someone’s behaviour. At one moment, for example, Mr. J was browsing the web, exploring his usual topics of interest, then he started exploring Yelp for restaurants in one particular area of the town, used Google Maps to navigate to the exact location, and then logged out.

Exploring Patterns: Creatures of habits in the eyes of the algorithms
We are creatures of habits, and we tend to create repetitions and patterns in our everyday behaviour. We tend to go to bed and wake up at similar times, to create our morning routines and create rituals of our social interactions. Since many segments of our lives are mediated by technology, those patterns are replicated and visible through the different digital footprints. When patterns are recognised, anomaly detection is born. As stated by Pasquinelli8, the two epistemic poles of pattern and anomaly are the two sides of the same coin of algorithmic governance. An unexpected anomaly can be detected only against the ground of a pattern regularity.
Both pattern recognition and anomaly detection are used as methods for understanding the vast quantity of data, our digital footprints that are being collected by many actors, from government agencies around the globe, internet companies and service providers or data dealers.
Something recognised as an anomaly in the eye of the algorithm can put you on the watchlist of a government agency or some behavioral pattern can label you as a target for an online advertisement. In the case of Mr. J simple bar charts and heatmap based on the number of browsing actions in time can reveal few patterns of behaviour.
As we explored earlier in our investigation of email metadata9, pattern-of-life analysis is a method of surveillance specifically used for documenting or understanding subject’s habits. It is a computerised data collection and analysis method used to establish the subject’s past behavior, determine their current behavior, and predict their future behavior.
Just a quick glance at this heatmap can expose differences in behaviour of Mr. J during time of his travels in Hong Kong and Singapore (April 05-26) and a more structured behaviour during his stay at home in Switzerland. We can detect a potential holiday (offline) period from May 1st until the evening of May 7th, differences between working days and weekends, as well as his favourite time for lunch breaks. Patterns can be explored not only on the level of frequency of someone’s browsing, but we can also explore which particular websites or services feature in browsing history over the time.
Trackers
Different actors are trying to acquire different parts of one’s browsing history, depending on their position in the data flow. Almost each move in the online environment is tracked and recorded by hundreds of different invisible trackers, a network of hidden and soundless ”sensors” that are collecting information about your online movements, without any sign of their existence at all. We used a methodology for mapping the trackers behind websites that Mr. J was visiting based on the tools developed for the Trackography10 project by Tactical Tech. In the following graph you can find all the trackers and companies behind them that were collecting information about Mr. J’s visits during the two months we examined.
![]()
Deep mining
Dave: Hello, HAL. Do you read me, HAL?
HAL: Affirmative, Dave. I read you.
2001: A Space Odyssey (1968)
Previous examples were just exploring a surface level of Mr. J’s browsing, relations and meaning extracted only from the URLs themselves. The real meaning of all the text, pictures or videos that occupied his attention is of course not always visible from just a URL of a page visited. In order to go deeper into his experience, we will need to dive into the content itself.
If we give up the unreasonable idea to read every article from someone’s browsing history and tag each content by using our human brain, an obvious choice would be to find a methodology for automated extraction of keywords and meaning from the content. For this investigation we chose to test one of the available solutions that is using a type of artificial intelligence, machine deep learning method for text analysis – Cloud Natural Language API11. According to Google, this tool attached to its deep learning platform, can be used to extract information about people, places, events, and much more, mentioned in text documents, news articles or blog posts. It can be used to understand sentiment on social media or parse intent from conversations happening in a call center or a messaging app.
Back to the beginning of our story on that Friday morning, when Mr. J read Wikipedia article about the documentary “Taxi to the Dark Side” – this is what Google natural language, deep learning platform understands what Mr. J was reading about:
It is clear that this kind of tool is or can be used for analysis of our online behaviour, more precisely for identifying the keywords, persons or locations that we are interested in, by various actors in the game. This is the step forward in understanding and classifying someone’s behaviour, needs, and interests on a deeper level. Similar practice, as we explained in our previous research, is used to extract and cluster topics and keywords from created content within Facebook platform in process of transforming user behaviour into profit. But, the same process can be potentially used for different purposes, for example associating users with keywords, people or locations “of special interest” for a government agency.
Who Has Access To Browsing Data?
Understanding who has access to our browsing histories and the possibility to analyse it will give us an insight into the new power structures and distribution of wealth in the information society.
Lieut. Maury. Map from 1852. Source: raremaps.com
IV – From Past to Present
19th century roots
In 1850s U.S. Navy Lieut. Matthew Fontaine Maury uncovered an enormous collection of thousands of old ships’ logs in the US Naval Observatory. At the time, logs were not considered important information after the voyage was completed. Following his obsession, he developed a method to systematically extract key information from each log book and started to draw a map by hand with weather and currents information, using more than 1,2 million data points in order to increase navigation speed and safety of ships at sea. He is considered to be one of the pioneers of what we today would call the big data analysis, someone who was among the first to realise the value of information created from thousands of smaller chunks of data. But for our context there is another interesting aspect around this story. His maps were proven to be highly useful and successful, not just within the Navy, but also among merchant ships. Knowing the importance of new data collection, Maury established the principle of exchanging maps for the ships’ logs. This practice of offering a product or service, maps in his case, in exchange for sailing logs, like today’s browsing histories, is a fundamental part of the main business model of contemporary information technology giants such as Google or Facebook 150 years later.
A decade earlier, in 1840s, on the other side of the Atlantic, in the UK, there was another important historical event relevant to our story. According to David Vincent13, this period promoted the creation of what we would now term social networking, the use of the information technology of the time (postal service) to extend the realm of personal interactions. It was possible to conduct conversations, arrange and engage in meetings within cities, by exchanging mail back and forth in a single day. Prior to 1840 the postal services were mostly run by decentralized networks of informal letter-carrying outside of government control, developed to circumvent the high costs of the Royal Mail.When Penny Post was introduced as a centralized, low cost, government run postal service, the issue of privacy was written off on account of keeping the nation safe from internal threats, fueled by fears of the growing working-class movement.This allowed government the access to postal communication of citizens, and for the first time the communication practices of a nation were systematically counted and generated statistics.
As framed by Vincent, the same kind of statistical testing is available now. It is more granulated, more voluminous, more instant, and unlike the nineteenth century, involves the profits of multinational corporations.
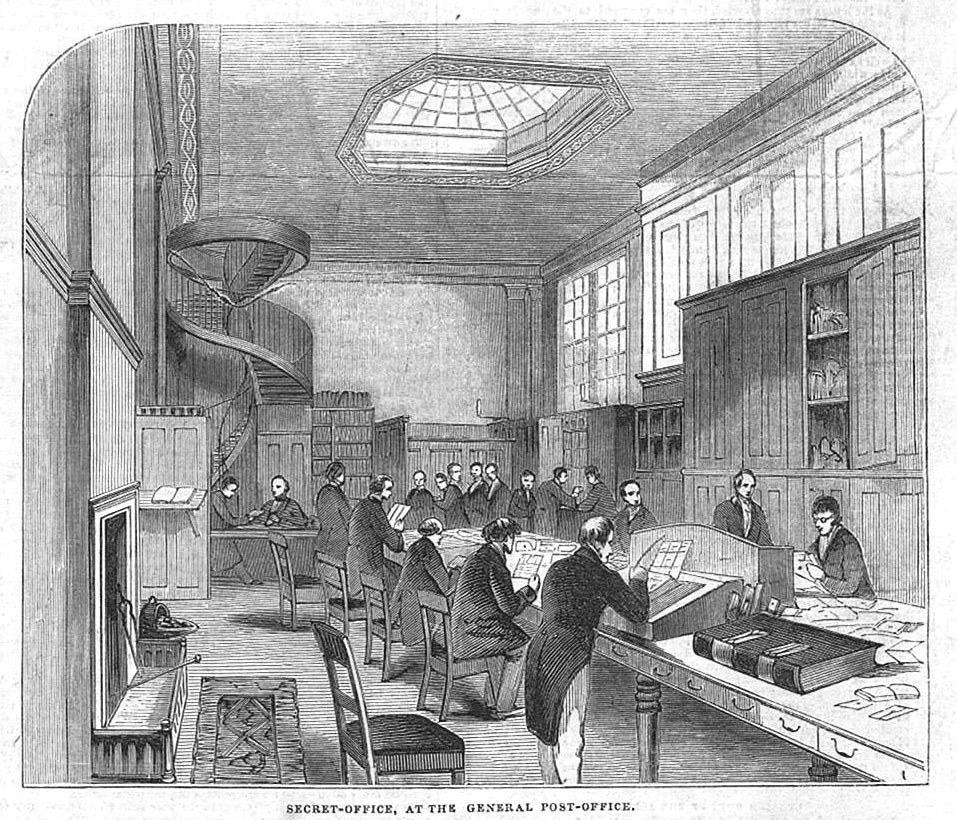
‘Secret Office’ is formed much before, in the 1650s and operated within the General Post Office as an undercover state spying institution. The main role of this office was to intercept mail between Britain and overseas, and to read it. During the 1840s, the Secret Office was somehow exposed and an inquiry was held to investigate its activities.14
Present : Towards Thought Police
“There was of course no way of knowing whether you were being watched at any given moment. How often, or on what system, the Thought Police plugged in on any individual wire was guesswork. It was even conceivable that they watched everybody all the time. But at any rate they could plug in your wire whenever they wanted to. You had to live — did live, from habit that became instinct — in the assumption that every sound you made was overheard, and, except in darkness, every movement scrutinized.”
1984, George Orwell
 George Orwell’s 1984 – 1954 BBC TV Movie
There is a persistent effort to dwindle down the “electronic communication transactional records” to mere additional information of a person’s whereabouts, much like those the investigators would get from a cooperative bystander providing insight to someone’s comings and goings. Or those obtained through the so-called “national security letter”, an administrative subpoena that enables US federal agencies to gather information without prior judicial oversight.15
Sitting in front of the US Senate Select Committee in a hearing session held in February 2016, the head of the FBI allegedly referred to the proposed addition of the disputed phrase as fixing a “typo” 16. Six years ago, before a similar editorial intention failed, the US administration flashed their utter indifference to the content of communication, seeking only its technical records. “It’ll be faster and easier to get the data”; all the data that is already there, produced on a mass scale with every single click.
But the electronic communication transactional records, or the communication data – such as the numbers dialed, recipients of text messages sent, IP addresses of the devices involved, and particularly records of web domains visited – sometimes reveal more than the content itself, as we can see from this and our previous research. In the words of privacy groups: “These information could reveal details about a person’s political affiliation, medical conditions, religion, substance abuse history, sexual orientation, and even his or her movements throughout the day,“ painting an incredibly intimate picture of a person’s life.17.
The true scope of this hunger for communication data was revealed when Snowden blew the whistle on the National Security Agency and one of its handy tools, a computer system called Xkeyscore used for searching and analyzing global internet data, which NSA collects daily. As a “widest-reaching system for developing intelligence from the internet”, including the content of emails, websites visited and searches, as well as their metadata, Xkeyscore allows NSA analysts to search its vast databases with no prior authorization.18.
Another project, funded by DARPA can give us an interesting insight into the future applications of data collection and analysis. The Anomaly Detection at Multiple Scales (ADAMS) program creates, adapts and applies technology to anomaly characterisation and detection in massive data sets. Anomalies in data cue the collection of additional, actionable information in a wide variety of real world contexts. The initial application domain is insider threat detection in which malevolent (or possibly inadvertent) actions by a trusted individual are detected against a background of everyday network activity.19.This 35 Million USD project is intended to detect and prevent insider threats such as “a soldier in good mental health becoming homicidal or suicidal”, an “innocent insider becoming malicious”, or “a government employee abuses access privileges to share classified information”.This project is basically creating platform for recognition of the next Edward Snowden or Chelsea Manning within the big systems such as Military by analysing browsing habits of individuals among other data sources such as mobile phone logs or location data for example.
The data craze is in no way limited to the Western managers of war on terror and other interesting parties, but it holds the same universal pretext, national security. The difference is that China, for example, feels it is time to move the game one step forward, literally: one of its largest state-run defense contractor, China Electronics Technology Group, now works on order to develop software to collect and combine data on jobs, hobbies, consumption habits, and other behavior of ordinary citizens “to predict terrorist acts before they occur”20.Officials announced that this “united information environment”, dubbed predictive policing data platform, would first be tested in territories with mostly ethnic minority population21. Apart from conventional means of data gathering, such as extracting financial records and security cameras footage, or plain old neighborhood denouncing, more efficient in rural areas, the pre-crime platform also collates data on online behaviour of Chinese citizens.22
If it’s not national security, then it’s profit that craves for online behavior patterns, and not much room is left to decide which is the lesser between the two evils. Both a government and a corporation would surmise consent to being tracked from mere existence within their domain, while the limits are negotiated with each tool discovered.
Who is Mr. J?
So, can we really know who Mr. J is just by sifting through the URLs in his browsing history?
He may be an extremist in the making, sickened by crimes committed in the name of democracy stripped of any meaning in a relentless pursuit of profit. Or – was it in fact that Mr. J was contacted by yet another Swiss bank whistleblower, with leaks about worldwide financial fraud? Circumstantial as they are, the data gathered from Mr. J’s browsing history offer a striking insight into his stream of consciousness on a particular day. Knowing his thoughts, real investigators would need more data to confirm any of the possible theories as to what practical significance those thoughts bear. Either way, Mr. J remains exposed In the end, Mr. J is probably just an ordinary, decent, somewhat tired guy seeking a respite from a job treadmill. Fully deserving of his privacy.
Credits
This investigation was the join data adventure of Tactical Tech and Share Lab team conducted in August 2016 in Berlin.
Tactical Tech Crew
Fieke Jansen, Tactical Tech,Politics of data – data collection, analysis and investigation
Leil Zahra Mortada, Tactical Tech – data collection, analysis and investigation
Christo, Tactical Tech – data collection
Claudio Vecna, data collection
Share Lab Crew
Vladan Joler, investigation, analysis, visualisation and storytelling
Olivia Solis Villaverde, analysis, investigation and data visualisation
Mr. Andrej Petrovski, data collection and analysis
Dušan Ostraćanin, data collection and analysis
Milica Jovanović, text, editing and storytelling
COVER PHOTO: Nicolas Lannuzel via Flickr
Special thanks to Mr. J for providing and giving us possibility to investigate his browsing history
***
]]>
Communication, Power and Counter-power in the Network Society, Manuel Castells
Part 1 : Index
Politics of hidden internet interventionism
Neverending reality show of online media
Conquering spaces of public discussion
DDoS Attacks
Content Takedowns
Targeted attacks on individuals
PART2 : SOCIAL MEDIA BATLLEFIED, ARRESTS & DETENTIONS

Our story begins in a snowstorm. A long line of cars is stuck on the road for hours. It’s freezing and people in the cars start to panic. Response teams are there but the machines are still not moving to clear the road. At that moment, a military helicopter arrives. A man with no hat and wearing only jeans jumps out to the heart of the snowstorm, takes one kid, struggles to carry him through the deep snow and strong wind, and brings him back to the helicopter. That man is about to become the Prime Minister of Serbia and this will be one of his most memorable heroic acts campaigning for the seat.
Everything would have been great if only there were no public broadcaster (RTS) crew already waiting with cameras for this heroic act to happen, and a number of staff that helped to pick up the kid, bring him out of the car and hand him over to the future PM. Simply put, everything would have been great if this heroic act were more of a real life situation and less a TV show, an ongoing, never ending spectacle, a social relation among people mediated by images16, that will last for years.

The video is broadcasted as the headline on the national television and uploaded on its official YouTube channel. And that is basically where our story really begins. The uploaded video became the material for numerous parodies, mostly presenting PM as a wannabe Superman. But then at one moment, all those videos started to disappear from the YouTube. This event in February 2014 was the official first case of our newly formed SHARE Defense crew, a group of lawyers, cyber forensics and policy experts formed to watchdog, assist and study cases of attacks against our rights and freedoms in the online sphere23.

Politics of hidden internet interventionism
As framed by the media theorist Manuel Castells, we should not overlook the oldest and most direct form of media politics: propaganda and control. This is: (a) the fabrication and diffusion of messages that distort facts and induce misinformation for the purpose of advancing government interests; and (b) the censorship of any message deemed to undermine these interests, if necessary by criminalizing unhindered communication and prosecuting the messenger24.
Governments are now experimenting with more sophisticated ways of exerting [Internet] control that are harder to detect and document25. It is the goal of this text to examine some of those methods based on our local experience, and we believe that they are used or can be used worldwide in similar forms.
From our ‘Superman case’ three years ago until now, we have witnessed a variety of violations in the online environment in Serbia. Specific cases of breaches of online rights and freedoms that our small team has been monitoring are made of arbitrary blocking or filtering of content, cyber attacks on independent online and citizen media, arrests and judicial proceedings against social media users and bloggers, manipulation with the public opinion through the use of different tech tools, surveillance of electronic communications, violation of rights of privacy and protection of personal data; pressure, threats and decreasing the security of online and citizen media journalists and individuals. We filed more than 300 different cases in almost three years, and created a monitoring database that is a foundation for this analysis26.
Source : Share Foundation – monitoring.labs.rs
Our main interest in this analysis is to try to explore some of the forms and methods of interventions that different political actors or power structures can use to control and conquer online sphere. Here we will mostly speak about hidden, indirect actions, interventions done by the unknown actors, individuals with hidden or fake identities, companies without visible ties to government officials, political troll armies and troll lords, or even “artificial” entities.
As usual in our investigations we will try to quantify and visualise some of those forms and try to detect and understand some patterns.
– I –
Neverending reality show of online media
According to the media theorist Douglas Rushkoff, we live in the age of the present shock.27 Most of the information we get from the multiple sources simultaneously, at lightning speed, is so temporal it gets stale by the time it reaches us. Everything is live, real time and always-on. This is why narrative structure collapsed into a never ending reality show.
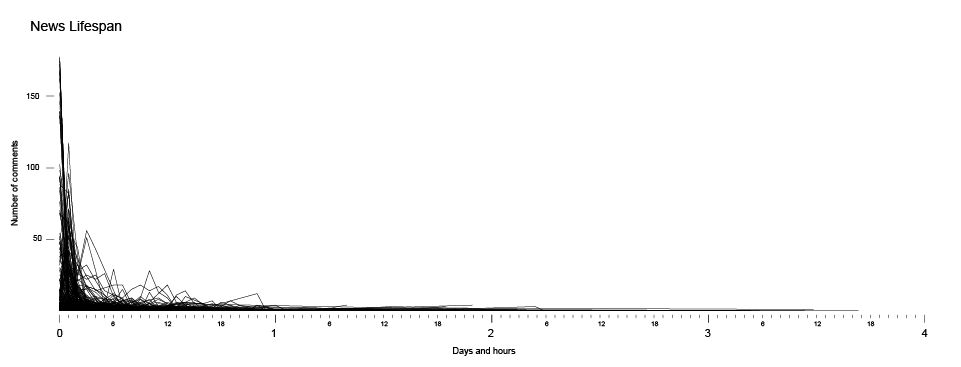
The lifespan of a single piece of information, a single piece of news in this flickering reality show, is short. According to our research28, an average lifespan of the news in Serbian online media is between one and two hours. During the first two hours, the news is being commented and shared, and then it disappears among the vast contents from the past, to be replaced by another short-lived news, and probably never to be seen again.
 Source: Share Foundation – Monitoring of online and social media during elections ( in Serbian )
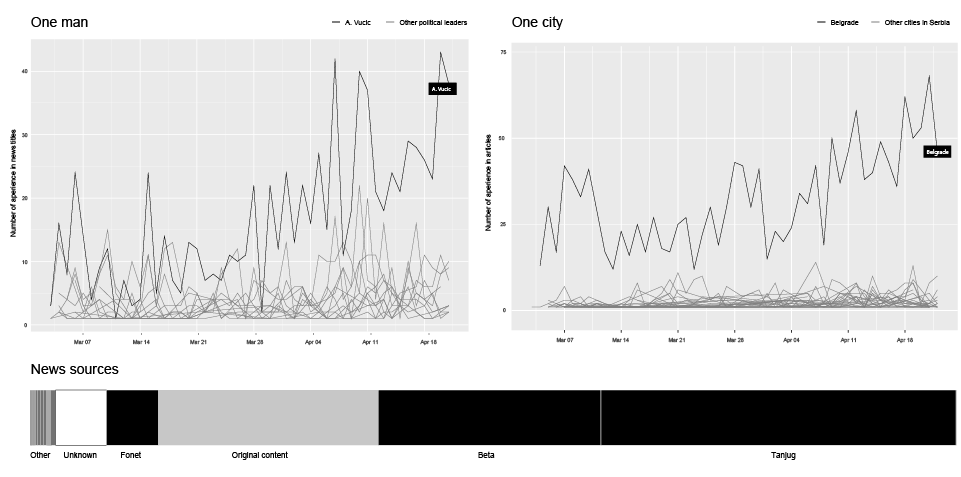
This ongoing open-end reality show, a stream of thousands short-lived news, has its own main actors and main locations. What we have here in our case is a strong domination of one main actor, a political figure (Aleksandar Vučić, prime minister of Serbia and the hero from the beginning of our story), and domination of one city, the location of this reality show (Belgrade).
 SOURCE: SHARE FOUNDATION – MONITORING OF ONLINE AND SOCIAL MEDIA DURING ELECTIONS ( IN SERBIAN )
According to our research, this supreme leader is playing a dominant role by far, managing to appear in over 40 news titles on 10 examined online media in a single day. Countless media statements and conferences, interviews and live acts are pumping the rhythm of his constant presence in our information stream.
This fast information production pace (as we can see on the horizontal bar chart of news sources), is fueled by three biggest news agencies in Serbia (Tanjug, Beta, FoNet) producing together more than 60% (black) of the news that are just being disseminated by the online media. The original content produced by the media outlet itself makes only one quarter (gray) of the analyzed news.
Politics is media politics, and affecting the content of the news on a daily basis is one of the most important endeavors of political strategists29. But, as we will see in the following chapters, conquering the field of the news content is just the first layer, first field of the battle over the minds and attention of the people in the networked societies.

– II –
Conquering spaces of public discussion
”In ‘normal war’, victory is a case of yes or no; in information war it can be partial. Several rivals can fight over certain themes within a person’s consciousness.”30
Information-Psychological War Operations: A Short Encyclopedia and Reference Guide
In not so distant past comments on the main news portals were still a place for the public discussions important for the general public in Serbia. But in recent years those places are being conquered by the armies of orchestrated entry level political activists, empowered with tools that allow them to use multiple identities, misuse voting mechanisms, distract public discussion and create fake picture of public opinion online. This information warfare doctrine, is known as “astroturfing”, or as some authors name it “reverse censorship”31.
 Mirror maze scene from the Charlie Chaplin movie ”The Circus” (1928)
With inserting the multiple fake players in the public discussion, they created discourse filled with noise where real public opinions are being flooded, lost in the mirror maze of the artificially created and orchestrated political statements. By this, those places previously used for public discussion are losing their primary role and becoming battlefields for political soldiers equipped with various weapons.
As more and more places for open discussion are being conquered, there are less and less places where your voice as an individual can be heard.
On the other hand, we can believe that such practice is discouraging individuals to express their opposite opinion and participate in the discussion where they will be automatically attacked by many. As framed by Nietzsche, ”The individual has always had to struggle to keep from being overwhelmed by the tribe”. In our case, the tribes are even on steroids, their performance enhanced by different technical tools (magical potions of multiplicity and invisibility) acting not as headless crowd but as a targeted weapon of the information warfare. But, as the philosopher continues, “If you try it, you will be lonely often, and sometimes frightened. But no price is too high to pay for the privilege of owning yourself”.
Arms depot
According to a series of leaks32 published by the web portal Teleprompter.rs in 2014 and 2015, the ruling party SNS has been using (at least at some point in time) different types of software that could be used for astroturfing and other means of the public opinion manipulation. There is a special “Internet team” within the party, made of people with knowledge of PR, media, Internet and social media work. Some of them also hold public positions, like councilpersons at the City of Belgrade, or positions at the Office for Media of the President of the Republic. It is important to notice that the software has evolved to a more sophisticated tool, and since the last leak was published in 2015, we can assume that if there is any such software currently in use, it should be even more sophisticated.
Inside look into 3 known tools for manipulation with comments and votes :
Valter
SkyNet
Fortress

Gamification of the information warfare
An interesting aspect is that in this segment of the information warfare and public manipulation there is a system of gamification33 embedded in the process. Manipulation of the public opinion in this case is transformed into a game in which each user is being awarded with the points for each comment on a news portal. News portals are ranked by the numbers of points that user can get for one comment depending on the political affiliation of the portal. For commenting on the media portals close to the official government politics, they will get less points than for commenting in a more ‘hostile’ environment where there are other commenters with potentially opposed opinions. In cases of the media that are gathering public mostly affiliated with the ruling political party, there is even technical rule of limiting number of comments per user, not allowing them to get the ‘easy’ points.
Quantification of the troll productivity is the root of this gamification model. By quantifying their activity an information warfare general is able to control and command more efficiently and by gamification he/she is able to gain competitive atmosphere among players, to compete between each other or to compete against their own previous results.
The rewards for gamers stretch beyond pure psychological gratification, allowing them to climb up on the ranking list where they would gain a better status within the political party and, if they get lucky, they would eventually get a job in any of the public companies controlled by the members of the ruling party.
The style of the game
A combination of two distinct strategies of astroturfing developed within the Serbian online sphere in recent years, evolving from approaches that, based on their origin and geographical prevalence, could be referred to as Russian and Chinese. While the Chinese approach is marked by the strength of sheer numbers and mostly just cheerleading, the Russian one deals more with the personalised content, active political discussions and attacks on the “internal enemy“.
 Polemics with the Internal Enemy – In his manual style blogpost Aleksandr Dugin, a Russian right wing political scientist, is proposing a rhetorical frame, which is quite similar to one that we can find in Serbian online sphere. “It is obvious that we have two camps in our country: the patriotic camp (Putin, the people and ‘US’) and the liberal-Western camp (‘THEY’, you know who)… A system of synonyms to be used in polemics should be developed. However, it should be kept in mind that such synonyms need to be symmetrical. For example, THEY call us ‘patriots’, and WE in response use the terms ‘liberals’ and ‘Westerners’ (Russian западники). If THOSE WHO ARE NOT US call us ‘nationalists’, communists’, ‘Soviet’, then our response will be: ‘agent of US influence’ and ‘fifth column’. If they use the term ‘Nazi’ or ‘Stalinist’, our cold-blooded response should be ‘spy’, ‘traitor’, ‘how much did the CIA pay you?’ or ‘death to spies’… An automatic patriotic trolling software, demotivators, memes and virus videos … or similar visual agitation materials for beginner level patriots could also be used against them.”
  CHEERLEADING – The Chinese government has long been suspected of hiring as many as 2,000,000 people to surreptitiously insert huge numbers of pseudonymous and other deceptive writings into the stream of real social media posts, as if they were the genuine opinions of ordinary people. In June 2016, Harvard researchers published research34 exploring this massive government effort where, according to them, every year the so-called 50c Party writes approximately 448 million social media posts nationwide. But despite previous claims from journalists and activists that the 50c Party vociferously argue for the government’s side in political and policy debates, research showed that approximately 80% of analyzed posts fall within the Cheerleading category, 13% in Non-argumentative praise or suggestions, and only tiny amounts in the other categories, including nearly zero in Argumentative praise or criticism and Taunting of foreign countries.
Polemics with the Internal Enemy – In his manual style blogpost Aleksandr Dugin, a Russian right wing political scientist, is proposing a rhetorical frame, which is quite similar to one that we can find in Serbian online sphere. “It is obvious that we have two camps in our country: the patriotic camp (Putin, the people and ‘US’) and the liberal-Western camp (‘THEY’, you know who)… A system of synonyms to be used in polemics should be developed. However, it should be kept in mind that such synonyms need to be symmetrical. For example, THEY call us ‘patriots’, and WE in response use the terms ‘liberals’ and ‘Westerners’ (Russian западники). If THOSE WHO ARE NOT US call us ‘nationalists’, communists’, ‘Soviet’, then our response will be: ‘agent of US influence’ and ‘fifth column’. If they use the term ‘Nazi’ or ‘Stalinist’, our cold-blooded response should be ‘spy’, ‘traitor’, ‘how much did the CIA pay you?’ or ‘death to spies’… An automatic patriotic trolling software, demotivators, memes and virus videos … or similar visual agitation materials for beginner level patriots could also be used against them.”CHEERLEADING – The Chinese government has long been suspected of hiring as many as 2,000,000 people to surreptitiously insert huge numbers of pseudonymous and other deceptive writings into the stream of real social media posts, as if they were the genuine opinions of ordinary people. In June 2016, Harvard researchers published research34 exploring this massive government effort where, according to them, every year the so-called 50c Party writes approximately 448 million social media posts nationwide. But despite previous claims from journalists and activists that the 50c Party vociferously argue for the government’s side in political and policy debates, research showed that approximately 80% of analyzed posts fall within the Cheerleading category, 13% in Non-argumentative praise or suggestions, and only tiny amounts in the other categories, including nearly zero in Argumentative praise or criticism and Taunting of foreign countries. Quantifying contamination of the public discussion sphere
Except looking into the leaked material and software, we tried to search for some methods of quantifying and analysis the corpus of the comments and user votes in some of the largest online media outlets in Serbia during the pre-election period.35
Galaxy of comments
We have analyzed comments created from May 4th until April 21st 2016 from political sections of 5 biggest online media in Serbia (b92, blic, n1, kurir, telegraf.rs). Here we will present a few ideas on how we tried to visualise and understand different anomalies that can point out to potential forms of organised political astroturfing.
This is the comment universe in which every of the 105.227 comments is represented as a little circle. Bigger “stars” on this map are the same, identical comments that are appearing multiple times in different articles and different online media portals.
Here we can clearly spot that except political slogans (such as “Dosta je bilo”) there is a large number of identical comments, used by the different users and distributed across wide range of media portals and for different news articles.
Voting machines
Third field of battle, within news articles, after content and comments, are votes on the user comments.
Most of the websites we examined are allowing users to vote on the user comments. As noted before, there were several leaks suggesting the use of different tools and techniques for manipulation with number of votes on the comments. This is how overall picture related to votes on comments looks like in form of the 2 graphs.
We can clearly see that there are some anomalies, for example comments with more than 5000 positive or negative votes appearing almost on regular basis. Some comments even have more than 50.000 votes. Such big numbers are actually often in disproportion with number of unique visitors of examined websites.
To view how this dynamic of number of comments and votes looks like in time, we visualised them in a form of multiple bubble charts where every comment is one bubble and its size is determined by the total number of votes. This is attempt to capture the flow of the attention of the public and potential political voting and commenting agents.
But in order to explore in depth we should go a bit deeper at the level of a single article. We chose one article that based on our collected data showed some anomalies.
Looking into data On April 16th, 2016, the website of the cable news channel N1 /rs.n1info.com/ had approximately 28.92036 unique users during the entire day. But at the same time, a total of 183.630 votes were cast at the single news article (about opening of a textile factory in the 3rd largest city in Serbia) that we have examined. In order for this to work, each of the unique visitors of the website needed to go to the same article and to cast 6 votes. There are few other strange things hidden behind numbers. Until 10:54am there were approximately just a few hundred votes per comment, and then 4 minutes later it jumped to a 10 times higher level; it would remain more or less like that for comments posted until 2:35pm. Then it rapidly went down to just 50-60 really polarised votes per comment. This strange difference can be explained by an assumption that the examined news was probably removed from the homepage. But still, we don’t find reasonable enough explanation for the first jump. At the moment of the great fall at 2:35pm there was another interesting event. Being kind of late for the voting and commenting ‘party’, a user by the handle “dddd” posted 3 comments, one after another, with typical cheerleading style praising the great achievements of the leader. It’s hard not to think that this user just forgot to change his user name while trying to comment from different accounts.
In this example we can spot traces of (1) a number of votes are disproportional compared to unique number of users on website; (2) there are strange peaks in number of votes casted over time (3) there are examples of clumsy astroturfing. But another interesting point that we can read from this sample is that astroturfing is not only limited to the pro-government actors – it’s more like the common activity of different political options.
We examined three fields (content, comments and votes) of the battle for the domination in online media sphere and methods that can be described as a reverse censorship – contamination of the people attention and flooding with constant spectacle of constructed images of political propaganda.
In following chapter we will explore different forms of targeted and aggressive practice – attempts to censor content deemed to undermine interests and interfere with constructed image of the power structures.

– III –
DDoS Attacks
In 1998, art and media activist group Electronic Disturbance Theater launched a series of DDoS attacks on US and Mexican servers with custom based tool FloodNet, claiming this was a form of electronic civil disobedience in favor of the Zapatistas movement37. According to them and other media theorists at that time, a collective action of blocking servers of power structures can be understood as a digital equivalent of sit-ins, nonviolent form of protest, borrowing the tactics of trespass and blockade from earlier social movements and applying them to the Internet38. Almost 20 years later, this form of action is widely used by the decentralised affinity group Anonymous and other digital activist groups for numerous attacks on different targets including various government, religious, and corporate websites. But a lot of things changed during those years. DDoS attacks became available as a commodity, a service that you can buy in the dark, provided by the entities that have under their control huge botnets, networks of infected computers worldwide, ready to be used as a source of attack on any given target for a certain price.This is broadly used form of attack, since it does not require a huge amount of knowledge, or resources to be executed. Botnets can be rented online for as low as 20-30 USD, which makes this attack one of the most effective and common.
Distributed Denial of Service (DDoS) attacks are such attacks that exploit infrastructures called botnets by sending requests from them to a host (server) that is a target of the attack. In essence, these attacks make use of the hardware and software limitations of a server to handle a certain amount of requests. Every server, depending on its resources (bandwidth, ram memory, CPU etc), can handle a certain number of requests per second, once the number of requests goes above that number, the server gets saturated and if the number of incoming requests persists, the server will probably stop handling the requests and become unresponsive.
In Serbia, during the past couple of years, this method of attack has been often used by different actors, with the targets varying from online media and NGOs, to the website of the ruling party and even the website of the President of Serbia.
From electronic civil disobedience to bullying and censorship methods
The crucial difference is that in most of the cases that we analyzed, the targets were not elements of the power structure, but mostly small independent online media and blogs, websites that criticise the government, published texts that expose corruption or point out to the inefficiency of the government or the ruling party members. It’s symptomatic that such attacks happened usually just after publishing of stories or investigations that were not in favor of power structures. In those cases it is hard to define this practice as an electronic civil disobedience act, but more as a form of intended censorship, since the primary functions of servers that host media websites is to inform the public (well, at least in some cases). On the other hand, DDoS attacks are rather ineffective method of censorship, they last for limited amount of time, do not destroy content permanently and, what’s probably most important they often attract even bigger public attention. Taking this into account, perhaps we can think about those cases as a form of bullying, closer to traditional forms of pressure, intimidation and attacks on journalists, than as an effective way of online censorship.
This trend begun in spring 2014 with attacks on websites that deal more with investigative journalism rather than daily politics, most notably the CINS (The Center for Investigative Reporting in Serbia)39 and Peščanik (“Hourglass”, an independent online media outlet)40 being targets of DDoS. However, as the attacks became more common, all sorts of websites were targeted. At some point it even seemed as if one of the tabloids used the alleged DDoS attacks to generate some PR.
In this example we visualised server logs of one of the attacked websites, where we can see different traces, footprints of the attack that happened on February 12th, 2015. Every IP address is one horizontal line, but in this visualization,we hide the addresses to protect the privacy of the regular visitors
It’s really important to say that there still is no hard evidence that any government body or any political party is behind the DDoS against online media. The nature of the DDoS and the network structure is making those attacks almost impossible to track by independent researchers, and attackers are usually well hidden behind anonymity networks and multiple IP addresses in foreign countries. And even when there is a lead pointing to an individual or an organization, it is really hard to get information on who has ordered the attack. What we do have is the correlation between the content, political context and the attack.
Except DDoS attacks there are numerous other forms of activities, cases of technical attacks that we detected in previous years.

IV – Content Takedowns
It was at the end of 2013 that Serbian web witnessed a new form of brash activities from its underground.
The case of National Bank of Serbia’s Governor, Jorgovanka Tabaković, first started off as a more traditional censorship event. A local radio station from Novi Sad, the northern province capital, ran the story about the Governor’s daughter exploiting perks of having a powerful mother for her own benefits. The text appeared on “Radio 021” website on 9 December 2013, only to be promptly removed due to the political pressure “from above”, as the chief editor explained. Soon it became clear that the pressure had to change its form, since the text reappeared on a variety of personal statuses, blogs, and even some independent media sites. One of them, the Center for investigative reporting (CINS) fell victim to a hacking intrusion a couple of days later, when unknown perpetrator(s) forcefully removed just the ‘Governor’s daughter’ text from its website.
Though far from spectacular in deeds or consequences (both websites restored their content41), this case was one of the early signs that within the Serbian Internet underground a new type of activities is emerging. Driven not only by some general political convictions about rights and wrongs from the recent wars and loss of territories, this time illegal activities closely followed the ruling party political agenda.
The following year confirmed this impression, but with a twist provided by institutions that should have known their legal grounds better.
The blizzard that struck that little village of Feketić in February 2014 from the beginning of our story, made clear that the public broadcast service RTS, or the state-run television as it is more popularly known, was outsourcing its digital rights management. In this case, however, instead of flagging and delivering take down notices for reposted videos or audios of copyrighted folk singers, this mechanism was used to hunt down satirical versions of now famous video showing the then future prime minister campaigning in the snow with the help of a freaked out boy he ‘rescued’ from the storm. The event was also an opportunity to get familiar with the YouTube policy of removing contested material without any due process whatsoever.
It was particularly chilling to discover that this YouTube practice was exercised two years later, in August 2016, when Serbia’s own Ombudsman temporarily lost access to his YouTube channel42 for the unknown reason. As a response to an appeal, the Ombudsman’s office was offered to read YouTube’s Community Guidelines and Terms of Service. The email account that was used for servicing Ombudsman’s YouTube channel was also blocked, and although the incident was happily resolved in the end, it became clear that general terms & conditions of global social media prohibiting copyright infringement, hate speech or child pornography, became tools for the abuse of rights in censoring the internet.
Particularly in areas on the outskirts of the developed world, such as Serbia.
But, back in 2014 the local community was still naive, facing only traditional government action.
So, after the blizzard in February, there came floods in May. A town close to Belgrade, Obrenovac, was severely struck and left with dozens of dead, thousands evacuated and property destroyed. From the beginning it was clear that the public services was either overwhelmed or incompetent to deal with the situation, and the social media quickly turned into bulletin boards for volunteers, gathering aid, and exchanging information. This last point was particularly important since conventional media lacked resources or interest to cover the events from the spot. The latter group, formed mostly of pro government tabloids, ran false but click-baiting stories of hundreds of dead bodies floating around and Roma looting gangs on the loose.
When the first calls for accountability appeared online, the censors awoke. Several blogs and websites were taken down, to the extent that the OSCE representative issued a statement43. One page was deleted from the official city website, calling for citizens of Obrenovac to remain in their homes, after questions of adequate flood response were raised. Citizens’ testimonies were removed from the portal dedicated to volunteer aid, that was explained as withdrawal of possibly controversial content44. In combination of computer intrusion and ‘offline’ political pressure, numerous portals suddenly lost an open letter addressed to the prime minister, calling for his resignation. A group of social media users, bloggers, and online journalists started a petition against censorship45.
The momentum was lost when another social ‘disaster’ soon shook the internet in Serbia again, when allegations of senior officials plagiarism were published, and it became clear that the other branches of government were not planning to further investigate neither incidents surrounding the floods nor any other case of breaching online freedoms and digital rights. The mainstream offline media spinned most of these incidents as cases of technical ignorance and self-victimization of opposition supporters.

-V-
Targeted attacks on individuals
Although the attacks on media present a severe violation of the freedom of expression and access to information, when these attacks target persons, i.e. journalists, the assault is even more intrusive. The impact of those attacks is not as visible to the public and in many cases goes unnoticed, but for the journalists themselves they can cause fear, pressure and chilling effect.
Phishing is a form of attack in which the attacker spoofs (fakes) a legitimate website in order to obtain login credentials or other sensitive details. In the case of investigative journalist Stevan Dojčinović it was a spoofed Google account login page, distributed to him by a link he got into his email. Even though investigative journalists are well trained when it comes to physical and cyber security, the nature of their job is such that sometimes they need to pay attention to links shared by unknown sources, let alone the email addresses that look familiar (similar to the one of a colleague or an old source). Implementing a multiple factor verification solves this issue to some extent, making it harder for the attackers to get into an account, but it is not impossible to also spoof a phone number and get the SMS containing the security code.
The case of Miljana Radivojević, a Cambridge University researcher, and her emails was particularly interesting. The contents of a private email correspondence she had with a colleague that worked with her on a story about the plagiarised thesis of the Minister of Interior, Nebojša Stefanović, were featured on a talk show on a national TV, by the owner of the private university where Stefanović supposedly obtained his degree. Besides being illegal (on several different counts) the goal of this act was to destroy the reputation of Miljana Radivojević and discredit her in the public eye.
Another act of discreditation was carried in the case of Dragana Pećo, an investigative journalist. She regularly sends Freedom of Information Act requests to Serbian institutions electronically, using a standard form and a digital copy of her handwritten signature to compose the requests, which she then sends by email. At some point, she received a call from a PR representative of a state-run company that received a FOI request, signed and submitted by the journalist. As it would turn out, the identical request signed by the same journalist was sent to several public institutions, state and private companies, using an email account registered at Gmail that the journalist had never used, nor created. This was also a way of tampering with someone’s reputation, and assuming someone’s professional identity, which in the case of journalists can be considered an aggravated circumstance.
> PART 2 : MAPPING AND QUANTIFYING POLITICAL INFORMATION WARFARE : SOCIAL MEDIA BATLLEFIED, ARRESTS & DETENTIONS
Detailed monitoring data sets, results and analysis can be found here:
Monitoring of attacks
Monitoring of online and social media during elections ( in Serbian )
Monitoring reports
Credits
Vladan Joler – text, data visualization and analysis
Milica Jovanović – text
Andrej Petrovski – tech analysis and text
This analysis is based on and would not be possible without two previous researches conducted by SHARE Foundation:
Monitoring of Internet freedom in Serbia (ongoing from 2014) by SHARE Defense – project lead by Đorđe Krivokapić, main investigator Bojan Perkov and Milica Jovanović..
Analysis of online media and social networks during elections in Serbia (2016) by SHARE Lab – Data collection and analysis done by Vladan Joler, Jan Krasni, Andrej Petrovski, Miloš Stanojević, Emilija Gagrcin and Petar Kalezić.
SHARE LAB, October 2016
SOCIAL MEDIA WARS : THE GAME OF TROLL
MAPPING THE TWITTER BATTLEFIELD
CASE OF ARTIFICIAL POLITICAL HASH AGENTS ON TWITTER
POLITICAL BUBBLES WITHIN FACEBOOK AQUARIUM
ARRESTS AND DETENTIONS
CONSEQUENCES
This is the second part of our story about information warfare. for first part, please read
MAPPING AND QUANTIFYING POLITICAL INFORMATION WARFARE : PROPAGANDA, DOMINATION & ATTACKS ON ONLINE MEDIA

– VI –
Social media wars : The Game of Troll
Initial concept of internet and its architecture promised us a decentralised and democratic possibility where every person is a medium. But 50 years later, not a lot of this dream is left. In reality, infrastructure and services became highly centralised, controlled by the internet service providers and gigantic internet companies such as Google or Facebook for example. Yes, we still have a chance to be the media, but in most cases only within the bigger social and media structures, owned and controlled by someone else. But still, even in this case it is much more harder for governments or political actors to have control over media than 20 years ago, when nodes that they needed to control were highly centralised around just a few national TV stations and newspapers. In that sense, a new form of battleground appears with the birth of the social media.
It is a battle for domination over the individual nodes (people) and their social graphs.
By instrumentalizing and conquering individual nodes, they are able to interfere and influence their social graph (see: Human Data Banks and Algorithmic Labor, SHARE Labs 201629) consisted of their social circles, hundreds of friends, colleagues and relatives. This doctrine is about conquering information streams of others through proxies. Social network ecosystems are fertile ground for different form of disinformation or smear campaigns against opponents, or just a cheerleading activities, depending on the style of the political warfare. In such environment, political propaganda (spreading of ideas, information, or rumor for the purpose of helping or injuring an institution, a cause, or a person 34), can be executed through individual nodes that are anonymous or without visible, direct connection of their real-life identities to a political party.
Mapping the Twitter battlefield
When it comes to personalizing the actors and marking their influence in a certain network, the Social Network Analysis (SNA) is the horse to bet on. This method has been used in different forms and variations thereof, and it is based on graph theory as a scientific discipline.
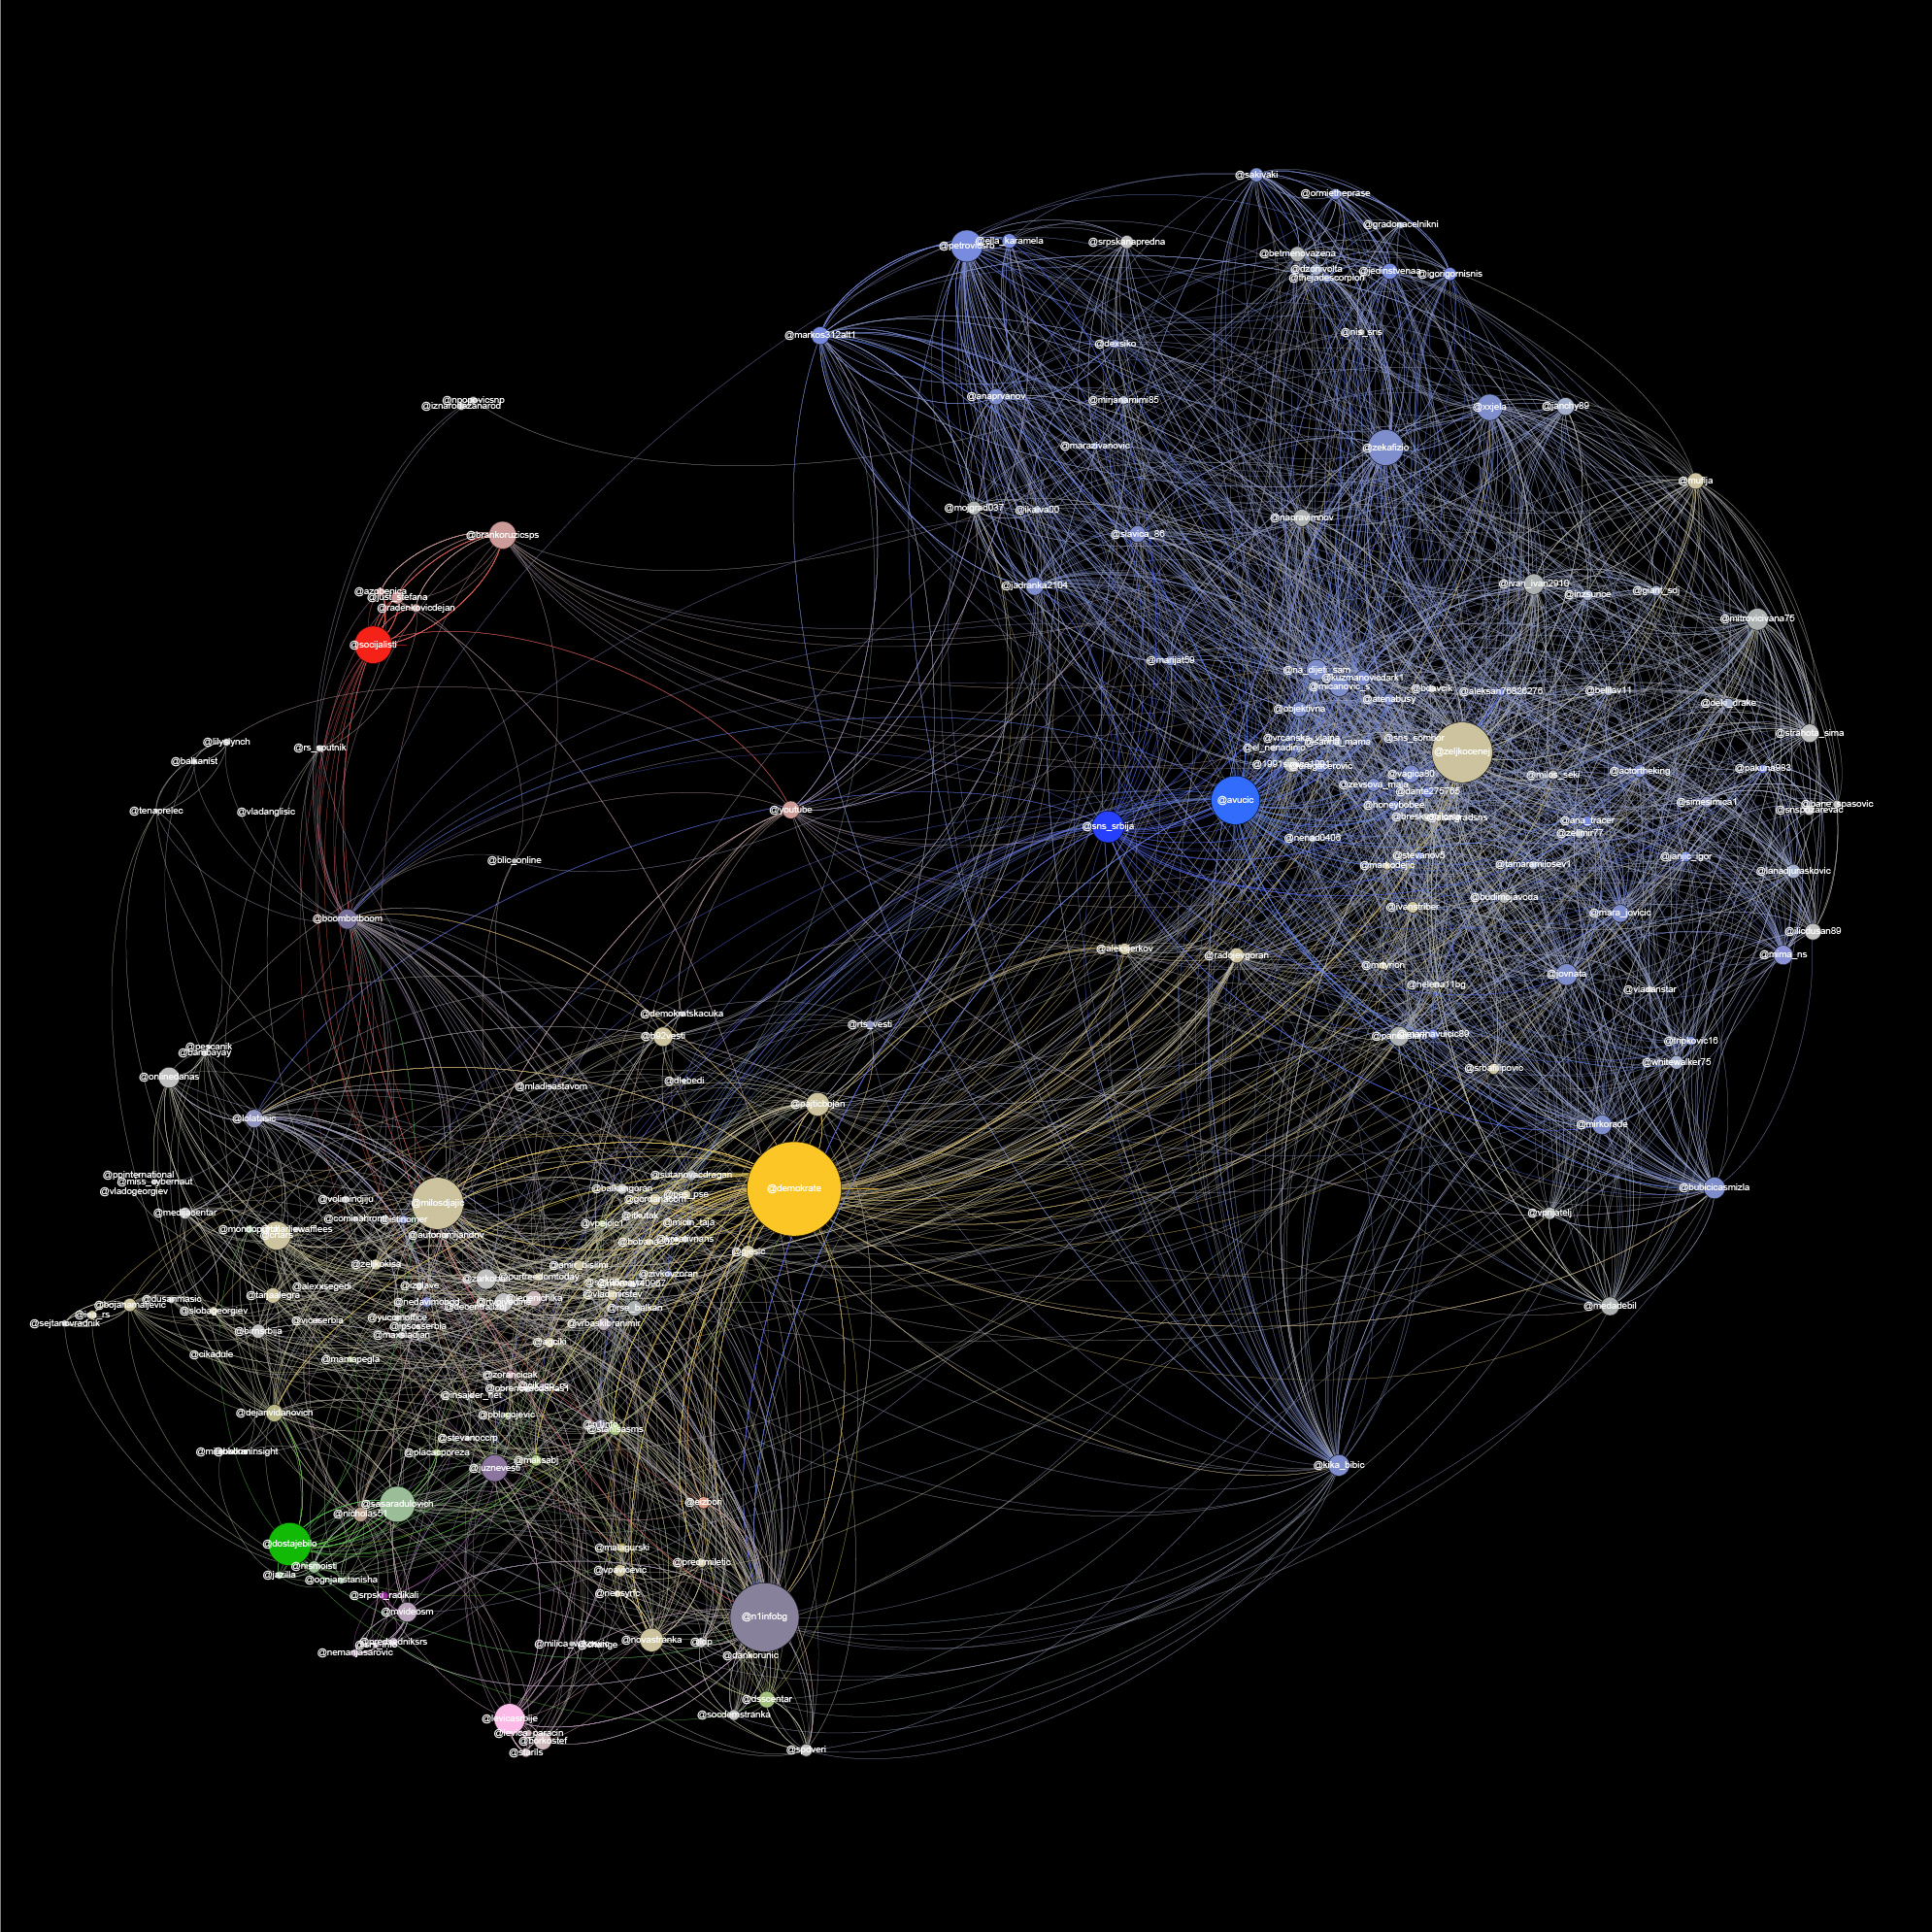
Social network analysis based on the corpus of all interactions containing hashtag #izbori2016 (#elections2016) during pre-election period in Serbia
How to read this graph?
When looking at the presented graph there are a couple of things one should keep in mind. The nodes in the network are people/entities (organizations), and the edges are the interactions between them. (1) The size of the node reflects the amount of interactions (tweets to, replies) that particular node has been into, it is a sum of the incoming and outgoing interactions. (2) We colored the biggest nodes of the political organizations (thus coloring their immediate neighbors in the network with a less intensive variant of the same color) according to the political structure they represent.
What this graph shows is in many ways a reflection of Serbian society, or at least of the Twitter community in Serbia. It is strongly polarised, with the ruling party being on one side (the blue node), and the rest on the other side; with a few nodes gravitating on the sides, not meaning they are neutral, rather that they have a micro cosmos in which they operate. In Serbian political rhetoric, for a while now, the tone of “us” vs. “them” is very much present. With the necessity for self-victimization and populism, being among the strongest traits of modern Serbian politicians, the general tone of the 2016 election campaign was much more negative (towards the opponents) than affirmative (towards their own program and promises).
We can easily spot two different types of troll-lord activities on this graph.
Attacker: First one is located at the right side of the graph, and in the heart of the “blue team” (ruling party) there is one big pale yellow node (@zeljkocenej). This user is connected (retweeted, liked) by other blue team nodes, but in his tweets he is frequently attacking yellow (opposition) team (@demokrate) and that is why the SNA algorithm assign him a pale yellow color. According to this graph, he is the most powerful troll-lord, one of the engines of the blue team propaganda machine. Bridge: Another interesting example can be spotted on the lower middle part of the graph. The account @Kika_Bibic is kind of a bridge, boosting (retweeting and replying to) a wide range of blue team attacks on the opposition parties official nodes, accounts of the individuals linked to the opposition nodes and accounts of the media (e.g. @n1infobg)
Case of artificial political hash agents on Twitter
Except the real human troll lords, by using social network analysis we can spot the traces of the primitive artificial actors trying to participate in the information warfare.
The case of the hashtag #slozno (“unanimous”), which was the campaign slogan for the electoral list “Složno za Srbiju” (“Unanimous for Serbia”), is somewhat curious. The list did not have the acclaim of the public on the social media, especially on Twitter, where even members of the list themselves were not active, and there was no community discussing their suggestions or program (in the context of the campaign). However, there was a single tweet using this hashtag by an obviously fake account “@najludja” (created couple of hours prior the tweet in question was published). This tweet got retweeted over one thousand times by accounts that did not usually engage into campaign-related discussions, and were not even from Serbia. This is an example of “outsourcing” supporters, and it might have served as a test case, for someone who wanted to see how effective artificial astroturfing can be in the context of elections. The tweet was deleted soon afterwards, but it had already been registered by the software we used for live data gathering35.
The phenomenon of this case can be clearly seen in the left side of the graph below.
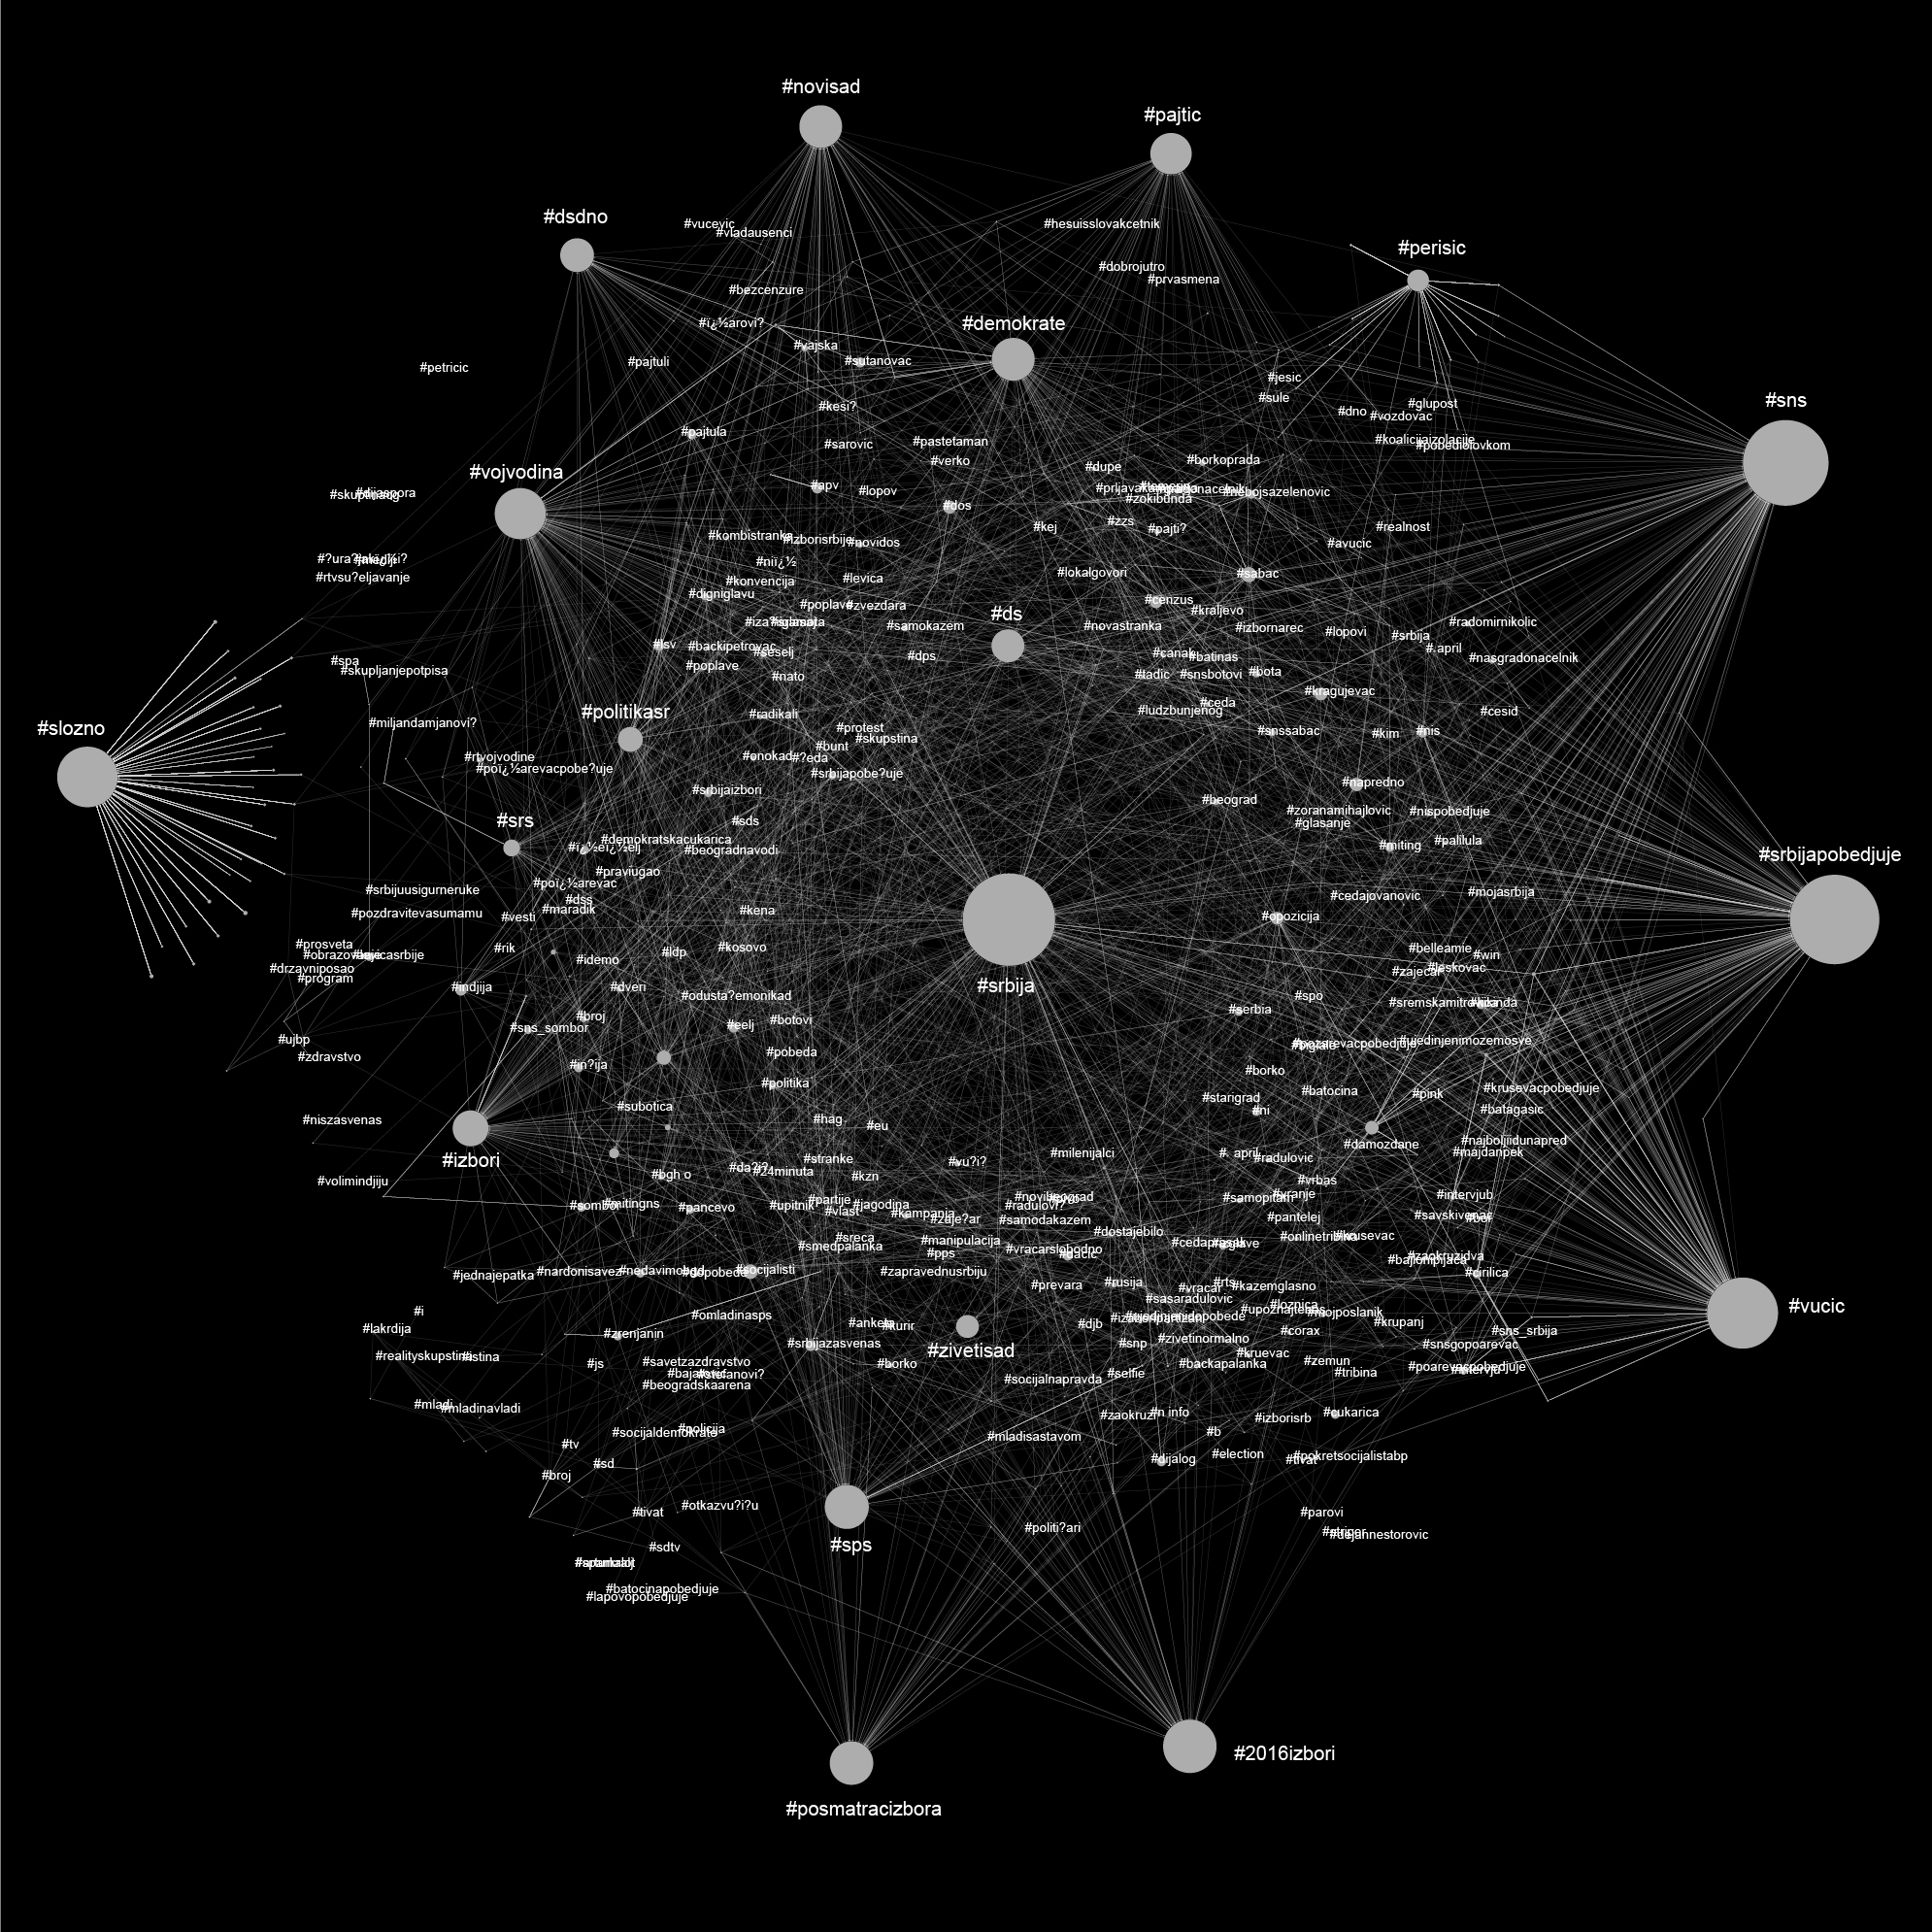
Social network analysis based on the corpus of all hashtags that are appearing together with hashtag #izbori2016 (#elections2016) during pre-election period in Serbia.

Political bubbles within Facebook aquarium46
World largest social network, deeply dissected in our previous research, populated with more than half of the Serbian citizens47, is probably one of the biggest ecosystems in information warfare. Without intention to go too deeply into the subject of Facebook itself being active agent, non neutral player with ability to shape, alternate or censor political discussions, we can just state that the interface, structure and algorithms behind Facebook are dictating the rule of this warfare.
Eli Pariser in his book Filter Bubble claims that users get less exposure to conflicting viewpoints and are isolated intellectually in their own informational bubble created by Facebook algorithms selectively guesses what information a user would like to see based on information about the user. This phenomenon also known as an “echo chamber” a metaphorical description of a situation in which information, ideas, or beliefs are amplified or reinforced by transmission and repetition inside an “enclosed” system, where different or competing views are censored, disallowed, or otherwise underrepresented.
In other word, this creates a highly politicised space, but at the same time this partly user- partly algorithmic-governed bubbles can easily be chambers where people with the same political affiliations are just discussing between each other without exposure to other political point of views.
We collected data from official Facebook pages of 20 political parties in Serbia and conducted different data analysis (see: link) but, for this analysis we will present the one quantifying number of users and number of interactions ( like, share, comment ) they had with official pages of political parties.
On this charts each circle represents a single user that had interaction with official pages of political parties. Size and color of squares are proportional to the number of interactions. Such approach allows us to observe the relationship between users who do a large number of interactions (marked in black are users with more than 100 units of interaction with the party) and users with fewer (gray).
This graphs can help us to feel the size of the political online propaganda machine in each party. It is reasonable to claim from our point of view that users that have more than 100 interactions (black bubbles) with one party during 5 week period can be considered as an active participant, agents of political propaganda spreading political agenda within their networks of friends.
As we saw in previous chapters when we spoke about mainstream online media, that space is already conquered and dominated the ruling party and government propaganda and field of public discussion within comments contaminated by the orchestrated trolling armies. In this light, Facebook is obvious choice for newly formed opposition parties to promote their agenda and communicate with their base. This can be clearly seen on the presented chart, where two biggest groups are young opposition parties (Dveri,DJB). Even they dominated Facebook sphere by taking almost 50% of the interactions, on election they were really tight over census (5%).

– VII –
Arrests and detentions
“They had come to a time when no one dared speak his mind, when fierce, growling dogs roamed everywhere, and when you had to watch your comrades torn to pieces after confessing to shocking crimes.”
Animal Farm, George Orwell
In the wake of 2014 floods, when it became clear that pro government tabloids would face no public scrutiny or official distancing for their scaremongering and false reports, a number of social media users were called in by the police for questioning. They were threatened with charges for “spreading panic” by posting rumors about the scope of the disaster and consequences of the public officials incompetence.
Whether the confusion about the legal provision that deals with “inducing”, not “spreading” the panic, was made on purpose or not, it proved to be a handy tool for the actual spreading of online chill. Though their statuses were posted on private social media accounts, and no actual panic resulted from it, among the detainees there were an 18-year-old guy, a father of two, a fashion makeup artist. All in all, the first wave counted at least fifteen cases covering greater Belgrade area.48 In the following months, reports were emerging about threats with charges against a couple of local online and radio journalists from towns and smaller communities in the country, all connected to the floods.
By the fall of the same year, the Center for investigative reporting published testimonies of people that were held in custody and later charged for an “attempted” inducing of panic.49
In the years that followed this kind of ‘regulating’ not only the comment sections and social media posts but the entire public sphere, was used on various occasions, though not all cases get news coverage. The latest happened in October 2016, when a mock-up politician who surprisingly made it to a town council, was called in for questioning on account of ‘panic’ for protesting unresolved local issue of drinking water.50
Another convenient legal ground for shaping up public discourse is to read threats into online comments, supposedly aimed at the prime minister or any other prominent figure.51 Again, there is no definite number of such cases, but the trend can be detected through splashy headlines that occasionally promote ‘cyber police’ skills in catching the ‘hackers’.
Both methods yield little effect in formal judicial procedure, while many of the cases will probably drag about until finally dropped or their statute of limitations expire. Much more interesting is their result in adjusting the public notions of what can be said out loud and what are the boundaries of private space where one can freely express their anger, frustration, and alike.

Consequences
What are the real consequences of cyber attacks on online media and journalists in Serbia? Most of the cases of content disappearance and DDoS attacks do not have long term consequences related to the content itself. As John Gilmore, one of the founders of EFF, famously stated “The Net interprets censorship as damage and routes around it”. Content that has been taken off the network is often multiplied on different places, republished by other blogs or online media websites and it attracts even more readers.
Insecurity and Fear
We can claim that the main consequence of these attacks is a raise of the insecurity and fear, resulting in a chilling effect on the freedom of expression online. The fact is that publishing content that criticizes the structures of power (government, criminal groups or any other power) can result in the destruction, blocking or temporary disappearance of a website, followed by large amounts of stress and expensive working hours to restore the system, which can impact the willingness of people to express themselves freely. In cyberspace, the defense is usually more expensive than the attack. This can be highly discouraging for small and independent online and citizen media that cannot afford costly cyber security experts or technical solutions to protect themselves. According to Morozov52, DDoS assaults put heavy psychological pressure on content producers, suddenly forcing them to worry about all sorts of institutional issues such as the future of their relationship with their Internet-hosting company, the debilitating effect that the unavailability of the site may have on its online community, and the like.
A somewhat positive outcome of this trend was that some of the more professional media organizations implemented DDoS mitigation systems, such as CloudFlare. In recent months the DDoS attacks continued, but as opposed to those in 2014, these are much more sophisticated, using large and more persistent botnets that have the ability to go around free versions of CloudFlare and shut the servers down.
Chilling effect on the general public
Arresting individuals because of their blogs, comments, or other forms of writing online has a chilling effect not just on the journalists and online media organizations, but on the general population of online users in Serbia, reaching 60% of Serbian citizens. Therefore, it seems that citizens do not feel empowered and protected in the digital environment, which reduces the potential use of new technologies. It is expected that the numerous legal proceedings commenced by the state in the past year would further enhance the chilling effect on online speech.
Privacy violation and surveillance
Targeted attacks on the personal and professional communication and working tools such as emails, online documents and databases can endanger the anonymity of sources, reveal investigation plans or can be used to discredit the attacked victim by publishing private information, as well as identity theft. Reaching the necessary level of digital security often implies complex procedures, change of usual habits related to the use of technology that can lead to smaller efficiency of journalist and organization in general.
Discouraging public dialog
The scale of manipulation of public opinion with the use of technical tools orchestrated by political party members resulting in flooding with comments and statements on the main news portals and social networks is transforming open spaces for dialog and expression of opinion online into the fields where only one opinion can be heard, thus creating a false image of the public opinion. This artificial noise makes the true voice of the individual almost impossible to hear, which discourages dialog about topics important to society.
In the Declaration on respecting Internet freedoms in political communication, Share Foundation together with 200 respected national organizations and experts, pointed out that cases of internet censorship, attacks on the websites and private accounts represent violations of human rights and that they are against the Constitution of Serbia and law.
Failed to protect
We can claim that the Government has failed to protect the online media and citizen journalists in Serbia. We are aware that the relevant state bodies have limited technical and organizational capacities for a more efficient reaction in certain situations. However, what is really dangerous is that the reactions of relevant public bodies (prosecution, police and judiciary) vary from case to case, sometimes they are very efficient and sometimes very slow and without a proper response.
Extremely slow or complete absence of reaction of the state authorities is in most cases related to the cyber attacks on online media, investigative journalists and citizens’ media critical of the government. In the past year, Share Foundation took an active role in monitoring, conducting cyber forensic analysis of the attacks on online media and provided the authorities with numerous documents, but none of the major cases of attacks on those media has resulted with an arrest or even clear statement from the authorities. This practice discourages citizens and online media organizations to believe that they will be protected by the state. Absence of proper reaction opens space for theories that different power structures within the state don’t even have an interest for those cases or cyber attacks to ever be solved.
On the other hand, relevant public bodies proved to be very efficient in the arrests and judicial proceeding against social media users and bloggers (the Malagurski case and cases of inducing panic during the floods). All of those aspects together produce a lack of legal certainty in this area and unsatisfactory level of rule of law.
< PART 1 : Mapping and Quantifying political information warfare : PROPAGANDA, DOMINATION & ATTACKS ON ONLINE MEDIA
DETAILED MONITORING DATA SETS, RESULTS AND ANALYSIS CAN BE FOUND HERE:
MONITORING OF ATTACKS
MONITORING OF ONLINE AND SOCIAL MEDIA DURING ELECTIONS ( IN SERBIAN )
MONITORING REPORTS
CREDITS
VLADAN JOLER – TEXT, DATA VISUALIZATION AND ANALYSIS
MILICA JOVANOVIĆ – TEXT
ANDREJ PETROVSKI – TECH ANALYSIS AND TEXT
THIS ANALYSIS IS BASED ON AND WOULD NOT BE POSSIBLE WITHOUT TWO PREVIOUS RESEARCHES CONDUCTED BY SHARE FOUNDATION:
MONITORING OF INTERNET FREEDOM IN SERBIA (ONGOING FROM 2014) BY SHARE DEFENSE – PROJECT LEAD BY ĐORĐE KRIVOKAPIĆ, MAIN INVESTIGATOR BOJAN PERKOV AND MILICA JOVANOVIĆ.
ANALYSIS OF ONLINE MEDIA AND SOCIAL NETWORKS DURING ELECTIONS IN SERBIA (2016) BY SHARE LAB – DATA COLLECTION AND ANALYSIS DONE BY VLADAN JOLER, JAN KRASNI, ANDREJ PETROVSKI, MILOŠ STANOJEVIĆ, EMILIJA GAGRCIN AND PETAR KALEZIĆ.
The three stories are exploring four main segments of the process:
Data collection – Immaterial Labour and Data harvesting
Storage and Algorithmic processing – Human Data Banks and Algorithmic Labour
Targeting – Quantified lives on discount
The following map is one of the final results of our investigation, but it can also be used as a guide through our stories, and practically help the reader to remain in the right direction and not to get lost in the complex maze of the Facebook Algorithmic Factory.
With 1.6 billion active users in 2015, Facebook is heading towards fulfilling their mission to connect every person on this planet through their social network. Zuckerberg’s vision, which is becoming reality, most people on the planet are connected between each other through one application, the social networking app. According to its creator, Facebook was built to accomplish a social mission – to make the world more open and connected. To be fair, this social network has in fact made the lives of billions of people more open and transparent, and made segments thereof more exposed to the public.We are the witnesses of the time of transparency of the individual. At the same time, Facebook, the platform itself is far from being open and transparent. What happens within the invisible walls of this complex algorithmic machine mediating the communication of billions of people is kind of mystery, a black box .
There are many reasons why we should be interested in these black boxes mediating and recording our interaction, our deepest personal communications, our behaviour and activities. Within those invisible walls, in every moment algorithms are deciding which information will appear in our infosphere, how many and which of your friends will see your posts, what kind of content will become part of your reality and what will be censored or deleted.
On other hand, this black box has defined new forms of labour, exploitation and generation of enormous amount of wealth and power (17.93 billion dollars in 2015) for the owners of this invisible immaterial factory creating a deep economic gap between the ones who own and control the means of production and the users who often live below the poverty line.
Somewhere deep under the layers of algorithmic machines there can be hidden new forms of potential human rights violation, new forms of exploitation and mechanisms of manipulation on a large scale influencing billions of people each day.
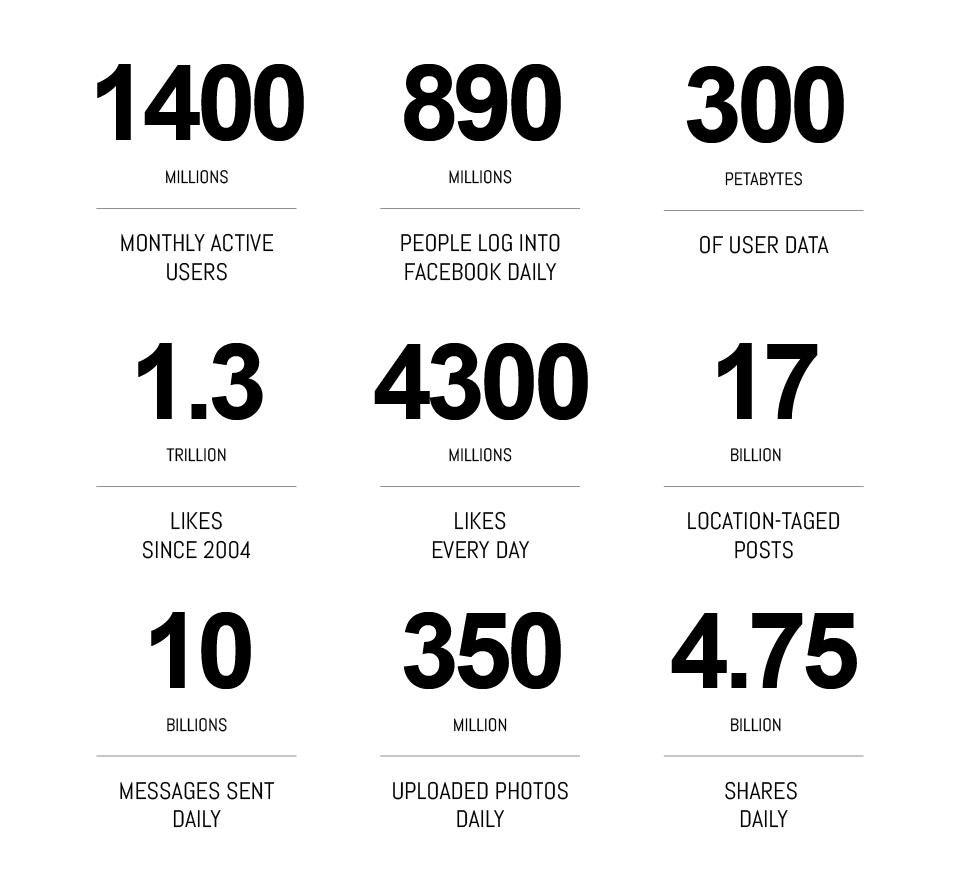
Those are the raw resources exploited within Facebook Factory.
Where Surveillance economy meets immaterial labour
According to the Marxist theory, when creating a good, people operate on the subjects of labour, using the instruments of labour, to create a product 52. The means of production include two broad categories of objects: instruments of labour (tools, factories, infrastructure, etc.) and subjects of labour (natural resources and raw materials). For example, in an agrarian society the means of production are the soil and the shovel. In an industrial society they are the mines and the factories, and in the knowledge economy the offices and computers.

| Type of Society | Who is performing labour? | Objects of Labour | Instruments of Labour | Product |
|---|---|---|---|---|
| Agrarian society | Human workers | Soil, seeds | Shovel | Food |
| Industrial society | Human workers | Natural resources and raw materials | Mines, factories, machines, tools |
Goods, products |
| Information society | Human workers | Information, knowledge | Offices, computers | Business, educational, intellectual products and services |
| Algorithmic society | Algorithms | Digital content, digital footprint, metadata | Social networks, digital platforms, devices | Profiles, patterns, anomalies, predictions |
If we try to understand the production process and creation of products at the Facebook factory in this context, we come to conclusion that there is one important difference. The main raw materials in the process (data, content and metadata) are the objects of labour and they are created by humans, but the labour itself is performed by algorithms.
IN THE EARLY 2000S TIZIANA TERRANOVA 53 STATED THAT FREE LABOUR OF USERS IS THE SOURCE OF ECONOMIC VALUE IN THE DIGITAL ECONOMY. DIGITAL LABOUR OF USERS CAN BE ALSO DESCRIBED AS AFFECTIVE AND SOCIAL ACTIVITIES THAT ARE NOT TYPICALLY VIEWED AS WORK, SUCH AS FOR EXAMPLE UPDATING YOUR PROFILE ON A SOCIAL MEDIA WEBSITE, WRITING COMMENTS OR TAGGING PEOPLE ON PHOTOS .
So basically whatever we do on Facebook can be described as some form of free digital labour. According to Trebor Scholz and Laura Y. Liu, ”the instruments of digital labour are indeed everywhere; they are fast-changing and invisible. Without being recognised as labour, our location, input, and tracked mobility become assets that can be turned into economic value.”
Every one of over 1 billion Facebook users, digital workers, work averagely 20+ minutes per day on liking, commenting, and scrolling through status updates. That is more than 300.000.000 working hours of free digital labour per day.
We should be clear that the main products of the Facebook factory are not billions of texts,updates, uploaded photos or videos. As we will explore in our investigation they are just a resource, playground for algorithmic social network analysis, classification and algorithmic profiling. Looking from anthropocentric perspective we like to put our self and our labour into the main focus, but in this case, the main form of labour is done by the algorithms. Products of this immaterial factory are more than a billion different user profiles, categorised and ready for sale. Specifics of this system is that users that are being used as a raw material are constantly working on fine tuning of themselves as a target, feeding this system with more and more information about themselves. It is kind of perfect marriage between free immaterial labour and surveillance economy.
Inside Facebook algorithmic factory
In our first part of investigation we will try to put a light upon how our behaviour, actions and information collected, stored, analysed and finally transformed into the products.
Our approach in mapping this invisible system is to find all the inputs and outputs and then try to describe what kind of actions were performed in between.
Our methodology consists of using different investigation tools on the publicly accessible resources. Three main parts in this research concern the Facebook data collection, its storage and analysis, and the targeting types applied to the users:
| Investigation Tools | Resources |
|---|---|
| 1. Data Collection | |
| Facebook Data policy analysis | https://www.facebook.com/full_data_use_policy |
| Mapping all the input fields on the Facebook platform | https://www.facebook.com/ |
| Cookies and pixel technology analysis at the 3rd party websites | https://www.facebook.com/help/cookies/update https://labs.rs/en/invisible-infrastructures-online-trackers/ |
| Policy analysis of Facebook owned companies | https://www.facebook.com/help/111814505650678 |
| Research on Facebook Vendors, service providers and other partners. | https://facebookmarketingpartners.com/ |
| Facebook Ireland Ltd Report of Audit (2011) | http://www.europe-v-facebook.org/Facebook_Ireland_Audit_Report_Final.pdf |
| 2. Storage and data analysis | |
| Facebook Patent database research | https://www.google.rs/search?tbm=pts&hl=en&q=inassignee%3A%22Facebook%2C+Inc.%22+ |
| Facebook API | https://developers.facebook.com/docs/graph-api/reference/ |
| 3. Targeting | |
| Facebook Ad creation process | https://www.facebook.com/ads/manager/creation/ |
Data Collection : Extracting data from the biomass
Data harvesting, extraction of data from the biomass in the human fields is an essential operation, one of the foundations of the Facebook Empire.

Human fields from the Movie “matrix” (1999)
According to our investigation Facebook utilises different ways to extract data from our behaviour and activities within and outside of the Facebook domain that we can separate in following groups :
A.Within Facebook
Every like you make, every step you take, every photo you upload, every event you attend, is recorded and stored by Facebook, in their databases. We can separate two main categories of information collected within the Facebook domain. First there are all the interactions, created or uploaded content, pages visited and basically everything you do on Facebook – Activities and behaviour.
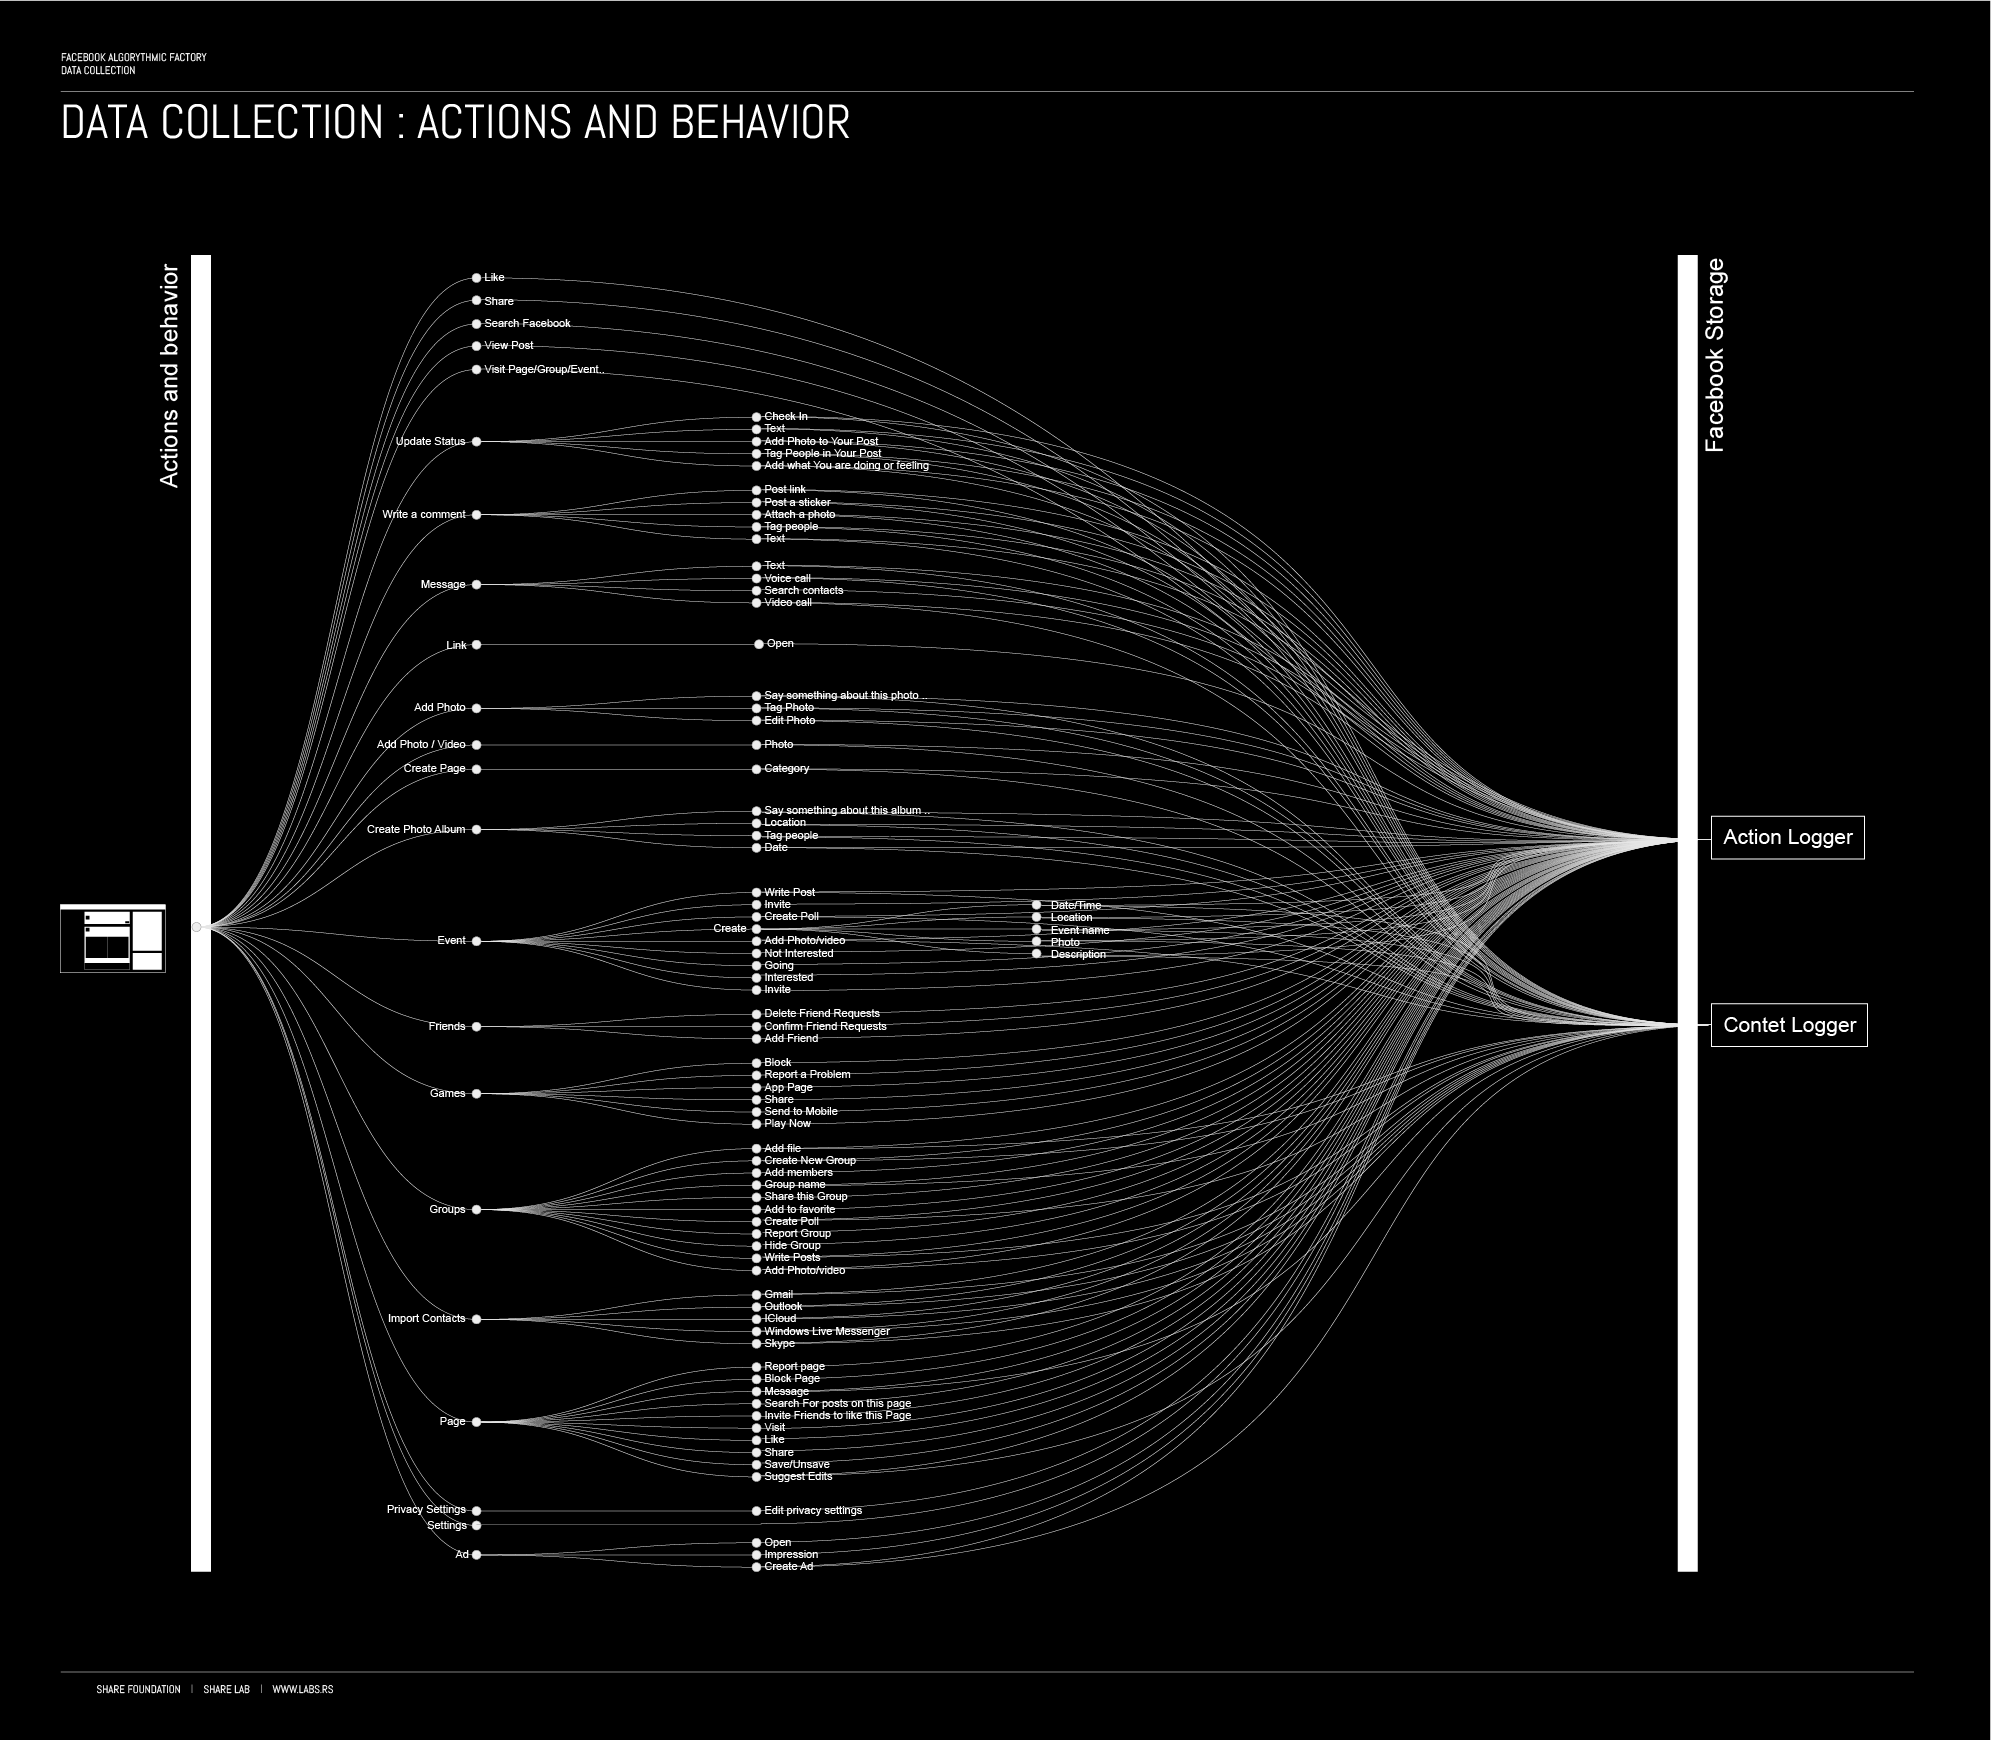
We could perceive the second group as rather voluntarily provided content – all the information you provided about yourself in the Profile information segment.
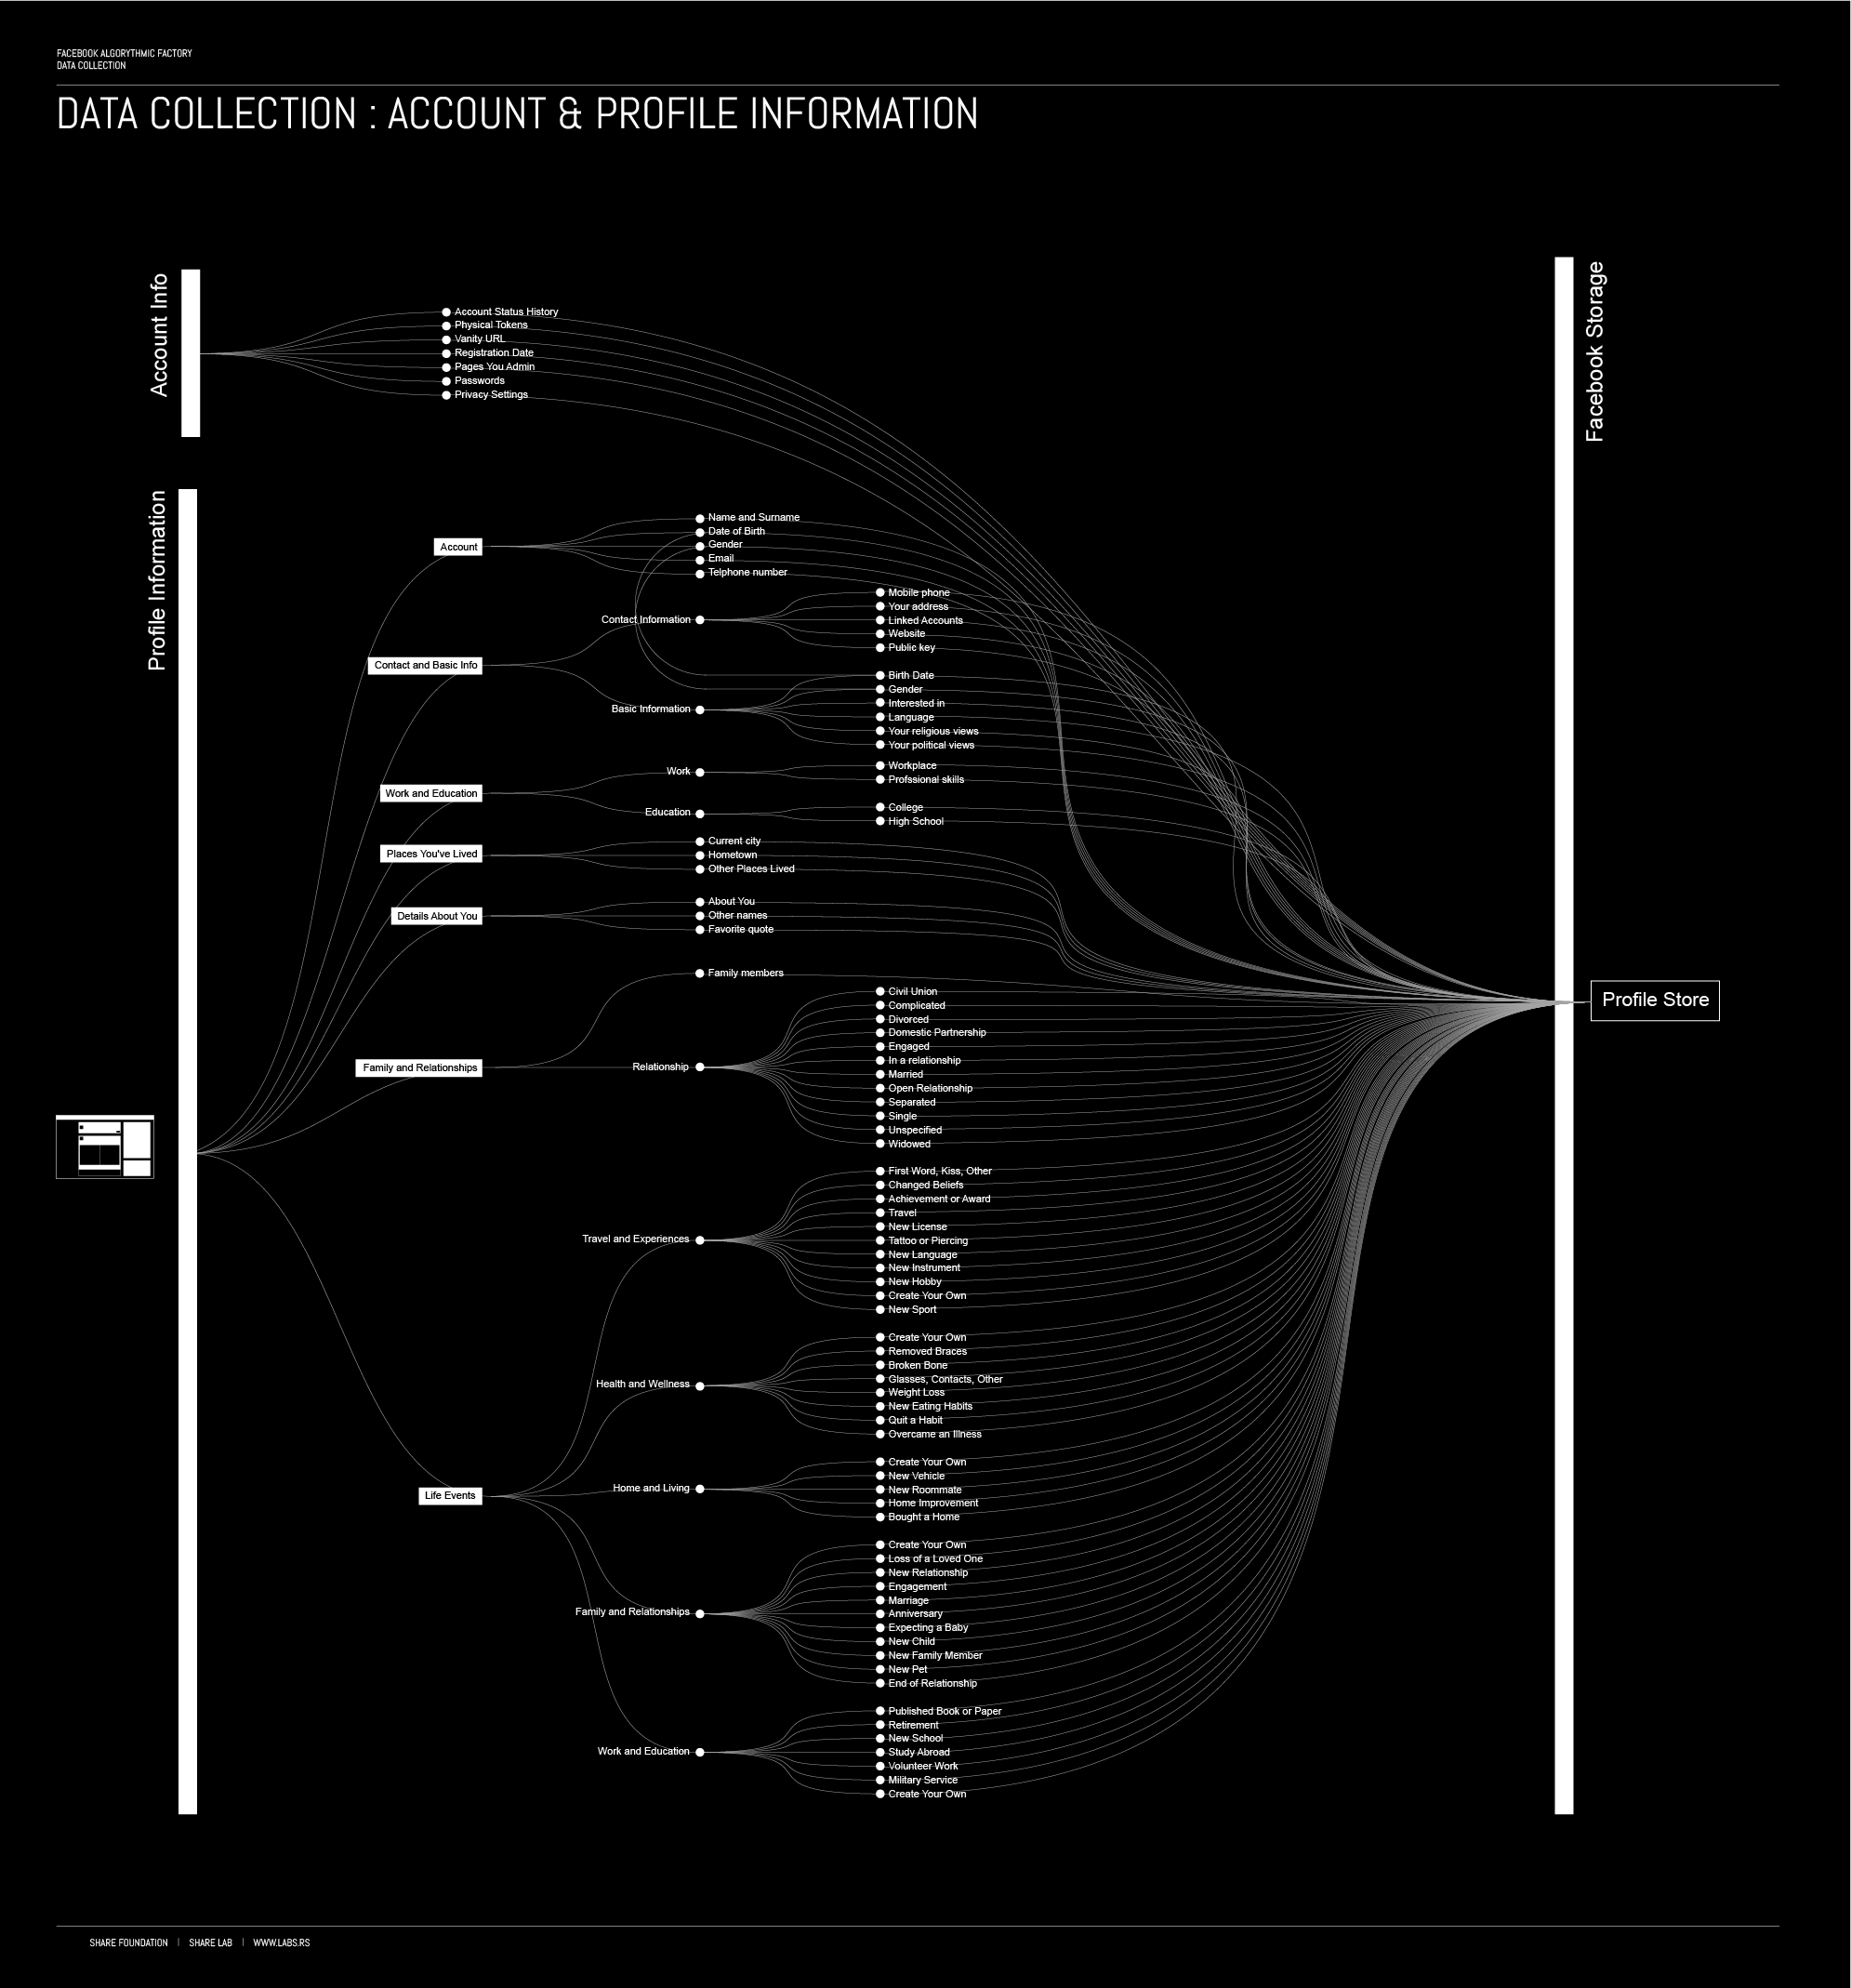
There is a significant difference between those two groups of information. Profile information are basically static information that are rarely updated and depend on the direct input you (are free to) give, on the other hand activities and behaviour inputs are dynamic and represents what you like, share, create and interact with in real time. Profile information can quite often contain misleading or faulty information.
B.Digital Footprint
Digital Footprint harvested from your devices is the second great resource of information Facebook has about. In this case we have two main categories as well: Information that can be gathered from your mobile devices and digital footprint that can be collected from laptop or desktop computers you use to access Facebook.
Information that can be gathered from laptop or desktop computers are not as diverse in comparison to information that can be gathered from mobile devices. However, they can still reveal a lot of information about you. Some of those information include your IP address, operating system, browser type and other information that can be used as a unique identifier and combined with information gathered through cookies and pixel technology reveal different behavioural patterns.
Cookies
Facebook is not gathering information just within Facebook domain, thousands of their invisible tentacles for data collection are reaching almost half of the world wide web. Our research on Online Trackers revealed that on the top 50 websites in Serbia that we use there are in 46% of the cases some of the Facebook cookies embed.
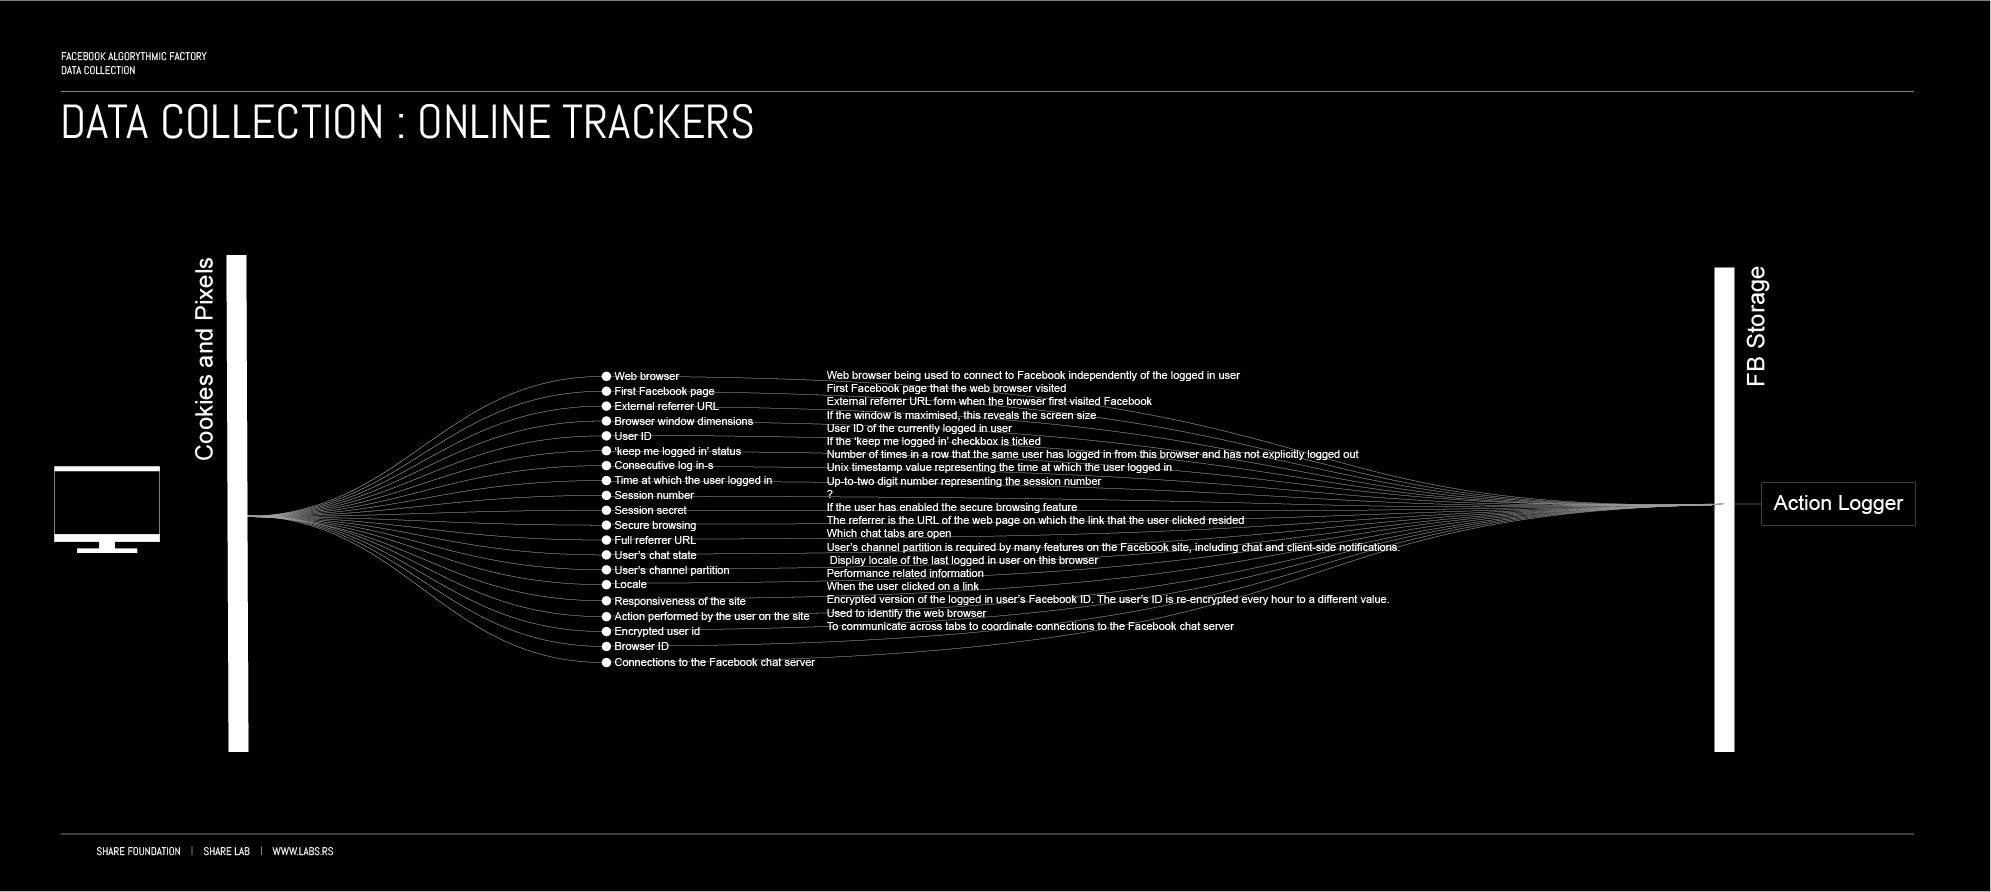
“Cookies are small pieces of text used to store information on web browsers. Cookies are used to store and receive identifiers and other information on computers, phones, and other devices. Other technologies, including data we store on your web browser or device, identifiers associated with your device, and other software, are used for similar purposes. We use cookies if you have a Facebook account, use the Facebook Services, including our website and apps (whether or not you are registered or logged in), or visit other websites and apps that use the Facebook Services (including the Like button or our advertising tools).”
Facebook Cookies Policy
According to the research we conducted on the 50 most frequently visited websites from Serbia there are in average 7 different 3rd party cookies embedded in every website we examined. In total, we detected 174 different types of cookies detected 365 times. Those 174 unique cookies belongs to 87 different companies. There is massive dominance of 4 big US companies: Google (90%), Facebook (46%), Twitter (24%) and Amazon (10%) as well as the Infomediaries Gemius SA (36%), Httpool (7%).
Every time we visit some of those websites, Facebook receives information about our visit and this information is becomes an integral part of the profiling process, a never ending process of creating a clear picture about who you are, what you like and what are your behavioural patterns.
Mobile phone permissions
Even with the use of cookies Facebook is able to get information about your online behaviour, this is just a little part of the information compared to what they can get from your smart mobile devices.
According to our previous research Invisible Infrastructures : Mobile permissions , by installing Facebook, Facebook messenger, WhatsApp and Instagram you are giving access and right to exploit vast amount of different types of data stored on your phone. Some of those permissions are allowing Facebook to extract different forms of information that can be really intrusive such as device identifier, precise location of your device, identity of your contacts, content of your SMS messages, Your call log, record audio, get information about Your WiFi connection, download files without notification and many more.
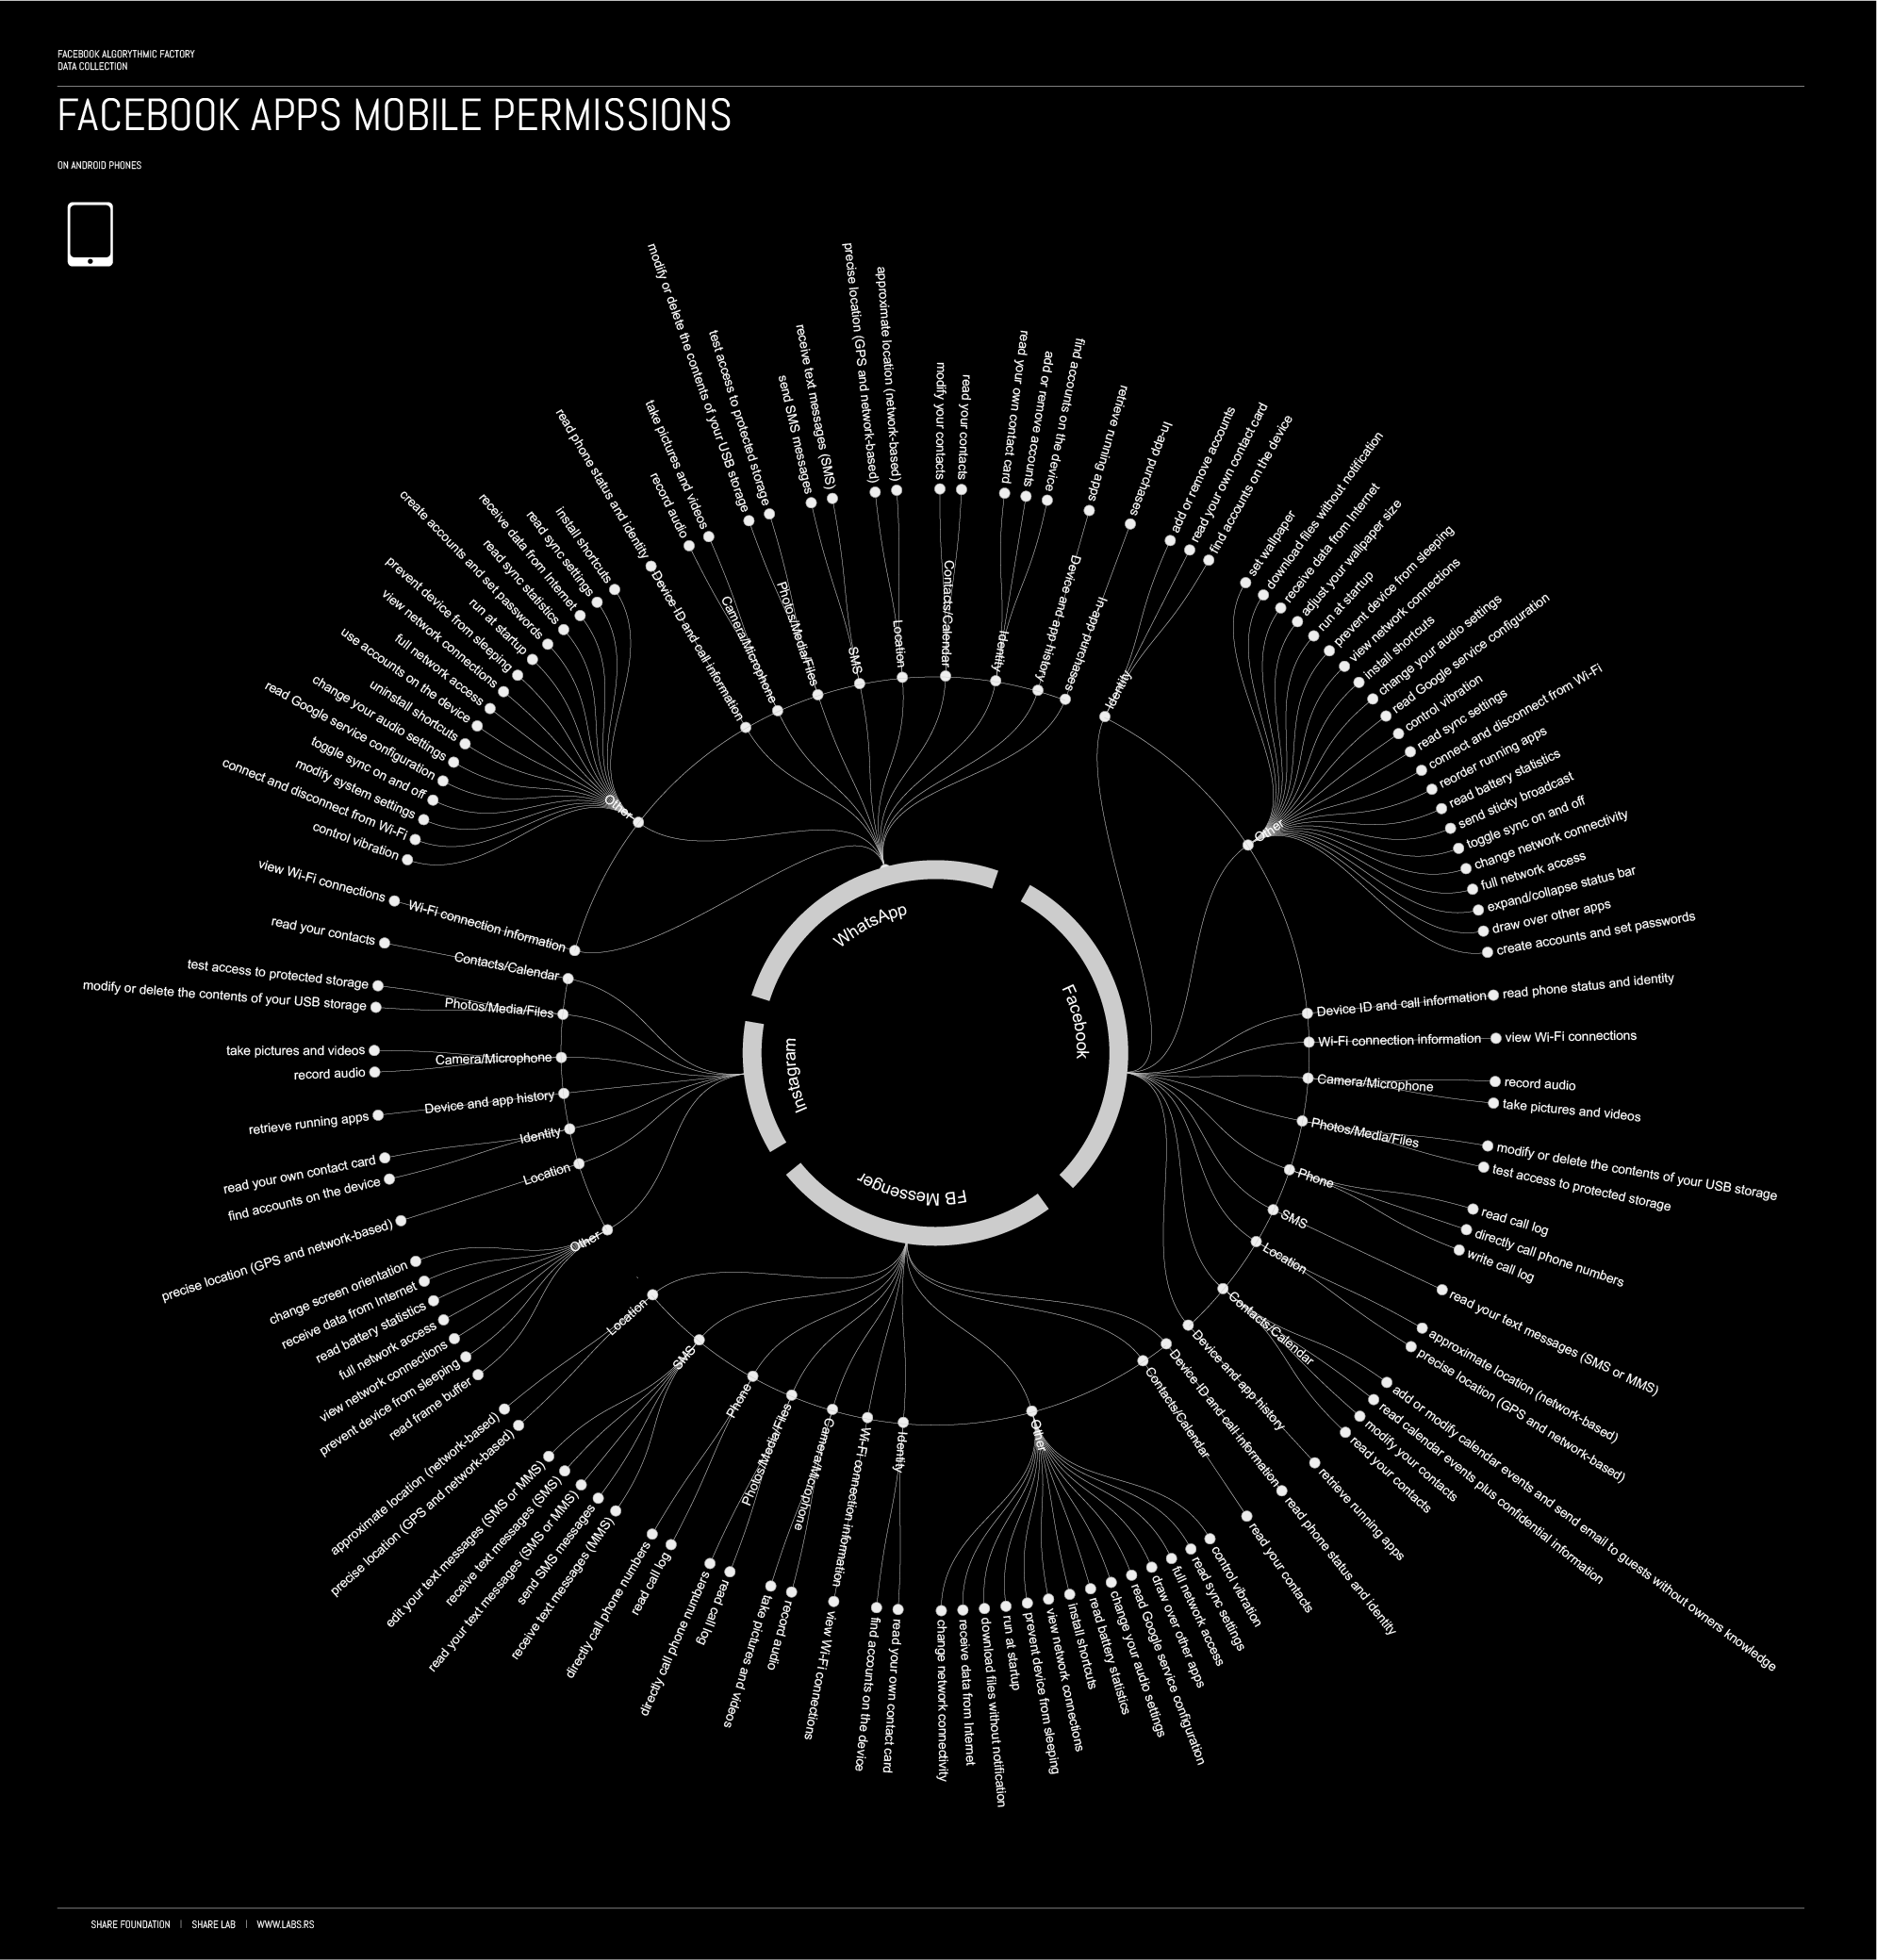
Other Facebook Companies
At the time of our research, except for the main company, Facebook owned and operated 7 other companies : Facebook Payments Inc., Atlas, Instagram LLC, Onavo, Parse, Moves, Oculus, LiveRail, WhatsApp Inc. and Masquerade. According to them, they may share information about you within their family of companies to facilitate, support and integrate their activities and improve their services. Some of those “family” members are data collector giants as well. WhatsApp alone had over 1 billion monthly active users worldwide as of February 2016. In June 2016 Instagram, another Facebook family member, had reach 500 million monthly active users. Those apps, especially WhatsUp are collecting even more information about user behaviour and activities. Ev en a brief look at the WhatsApp privacy policy or a list of mobile phone permissions, reveals a data collection operation similar in scale to the one that we are investigating within Facebook itself. Specifics to the services that some of those companies provide, the field of data collection is expanded to new frontiers. In the case of Oculus Rift, according to their privacy policy, they can collect and provide Facebook with information about your physical movements and dimensions when you use a virtual reality headset. Facebook Payments Inc. is a company that provides payment services on Facebook, while collecting different set of information, mostly related to your transactions, credit card numbers etc.
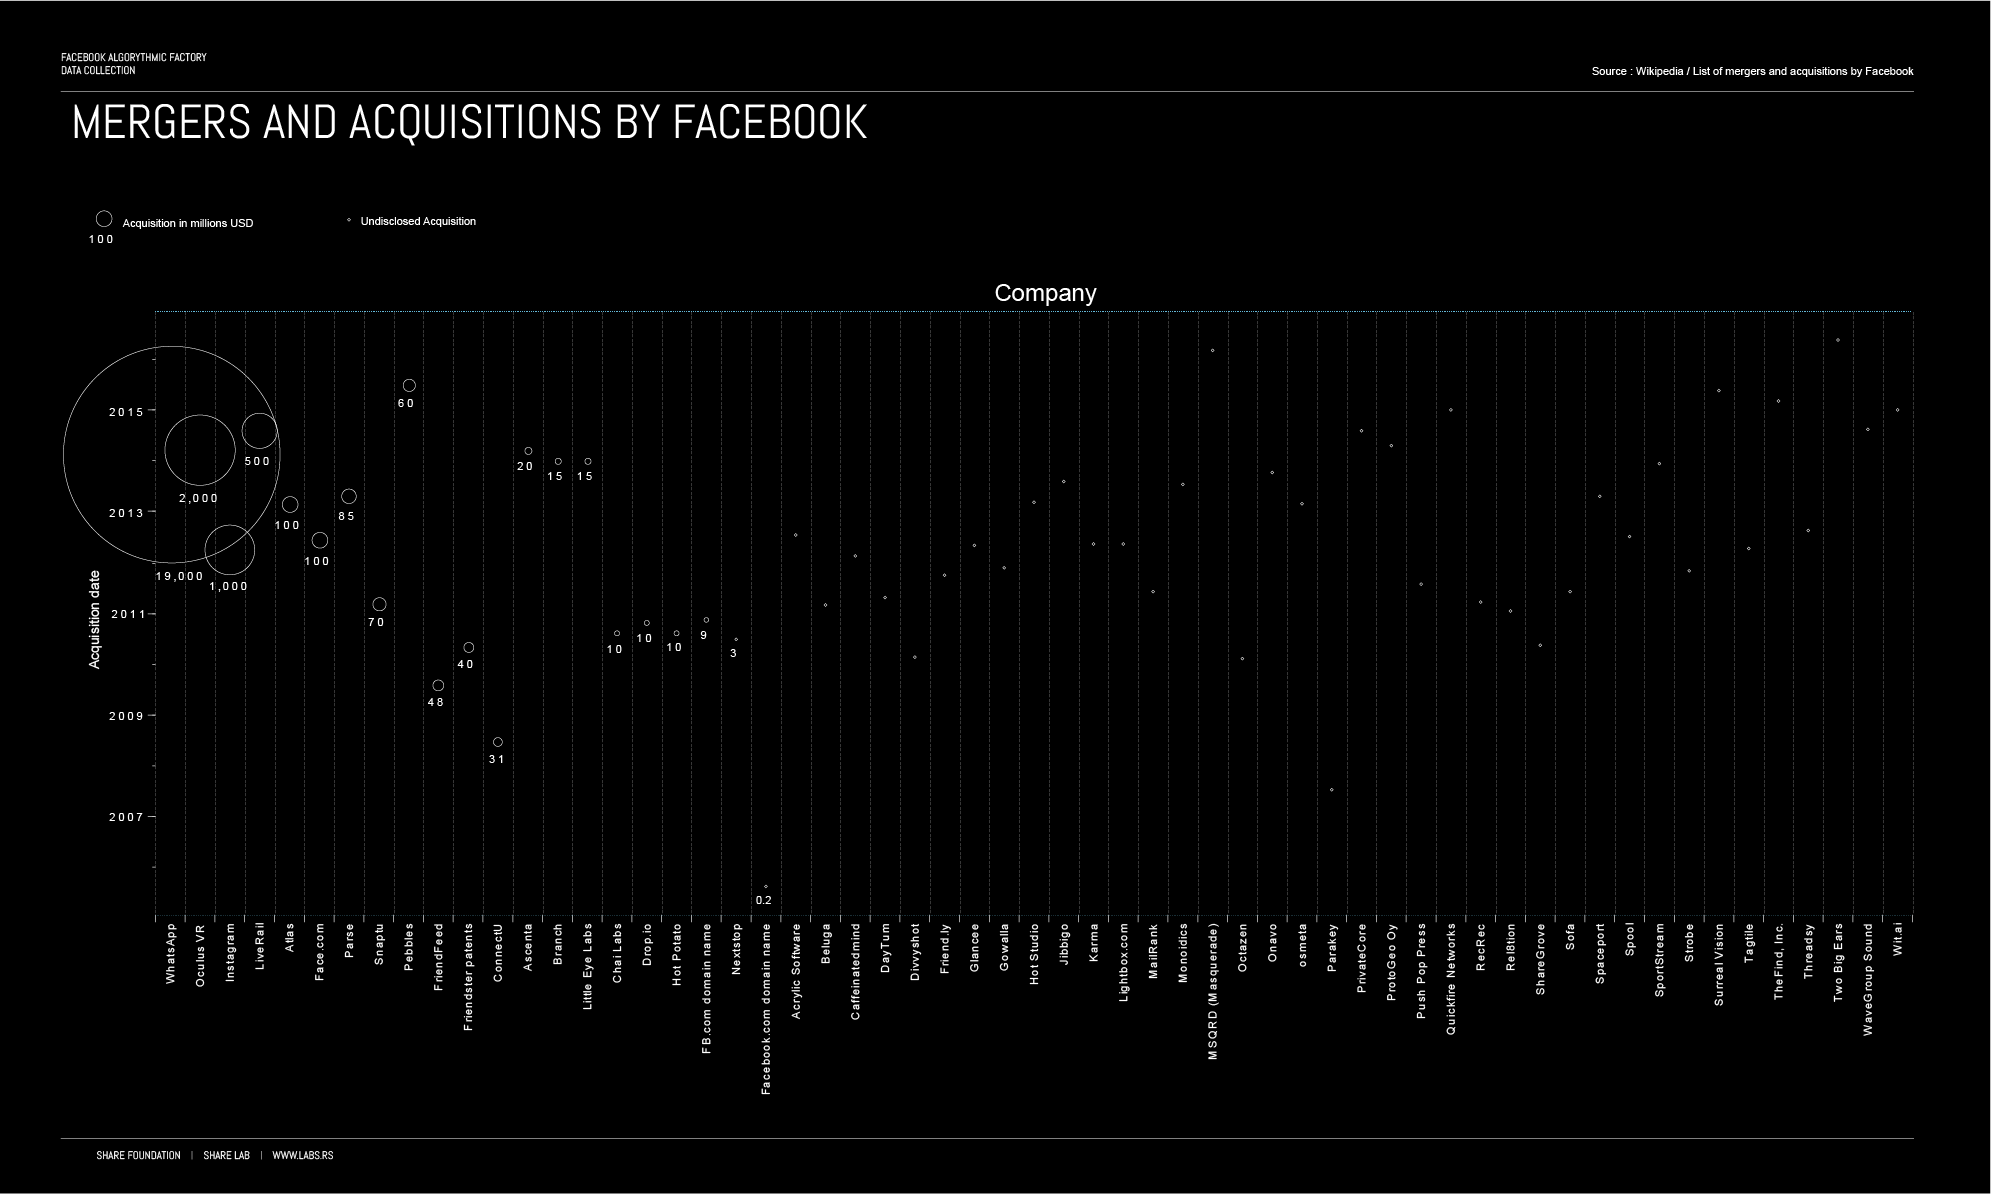
Detailed investigation of all the type of data that Facebook can collect through their companies other than Facebook itself will require extended analysis that we will unfortunately have to leave for some other investigation in the future.
Facebook partners
According to FB privacy policy they receive information about you and your activities on and off Facebook from third-party partners, such as information from a partner when they offer joint services or from an advertiser about your experiences or interactions with them.
In April 2013, Facebook launched “partner categories” and incorporated offline and third-party data from data brokers Acxiom (enterprise data and analytics), Datalogix (a digital media and offline purchasing data service), and Epsilon (direct-to-consumer marketing) to all categories of Facebook advertising. According to the New York Times article “Mapping, and Sharing, the Consumer Genome” from 2012, Axciom Corporation servers process more than 50 trillion data “transactions” a year. Company executives have said its database contains information about 500 million active consumers worldwide, with about 1,500 data points per person. That includes a majority of adults in the United States.
These companies collect information about you through things like store loyalty cards, mailing lists, public records information (including home or car ownership), browser cookies, and more. So, if you are buying at Safeway, and use your Safeway loyalty card that information is collected and saved by another Facebook partner company – Datalogix. In December 2014, Oracle Corp. had acquired Datalogix for $1.2 billion. According to their statement, Datalogix aggregates and provides insights on over $2 trillion in consumer spending and have over 650 customers including the top US advertisers and digital media publishers. According to them, with Datalogix, Oracle Data Cloud will deliver the richest understanding of consumers across both digital and traditional channels based on what they do, what they say, and what they buy enabling leading brands to personalise and measure every customer interaction.
Except with the biggest data collectors and dealers at the market, Facebook is exchanging data with hundreds of other data dealers, Ad technology developers, data and marketing analysis companies through their Facebook Partners program.
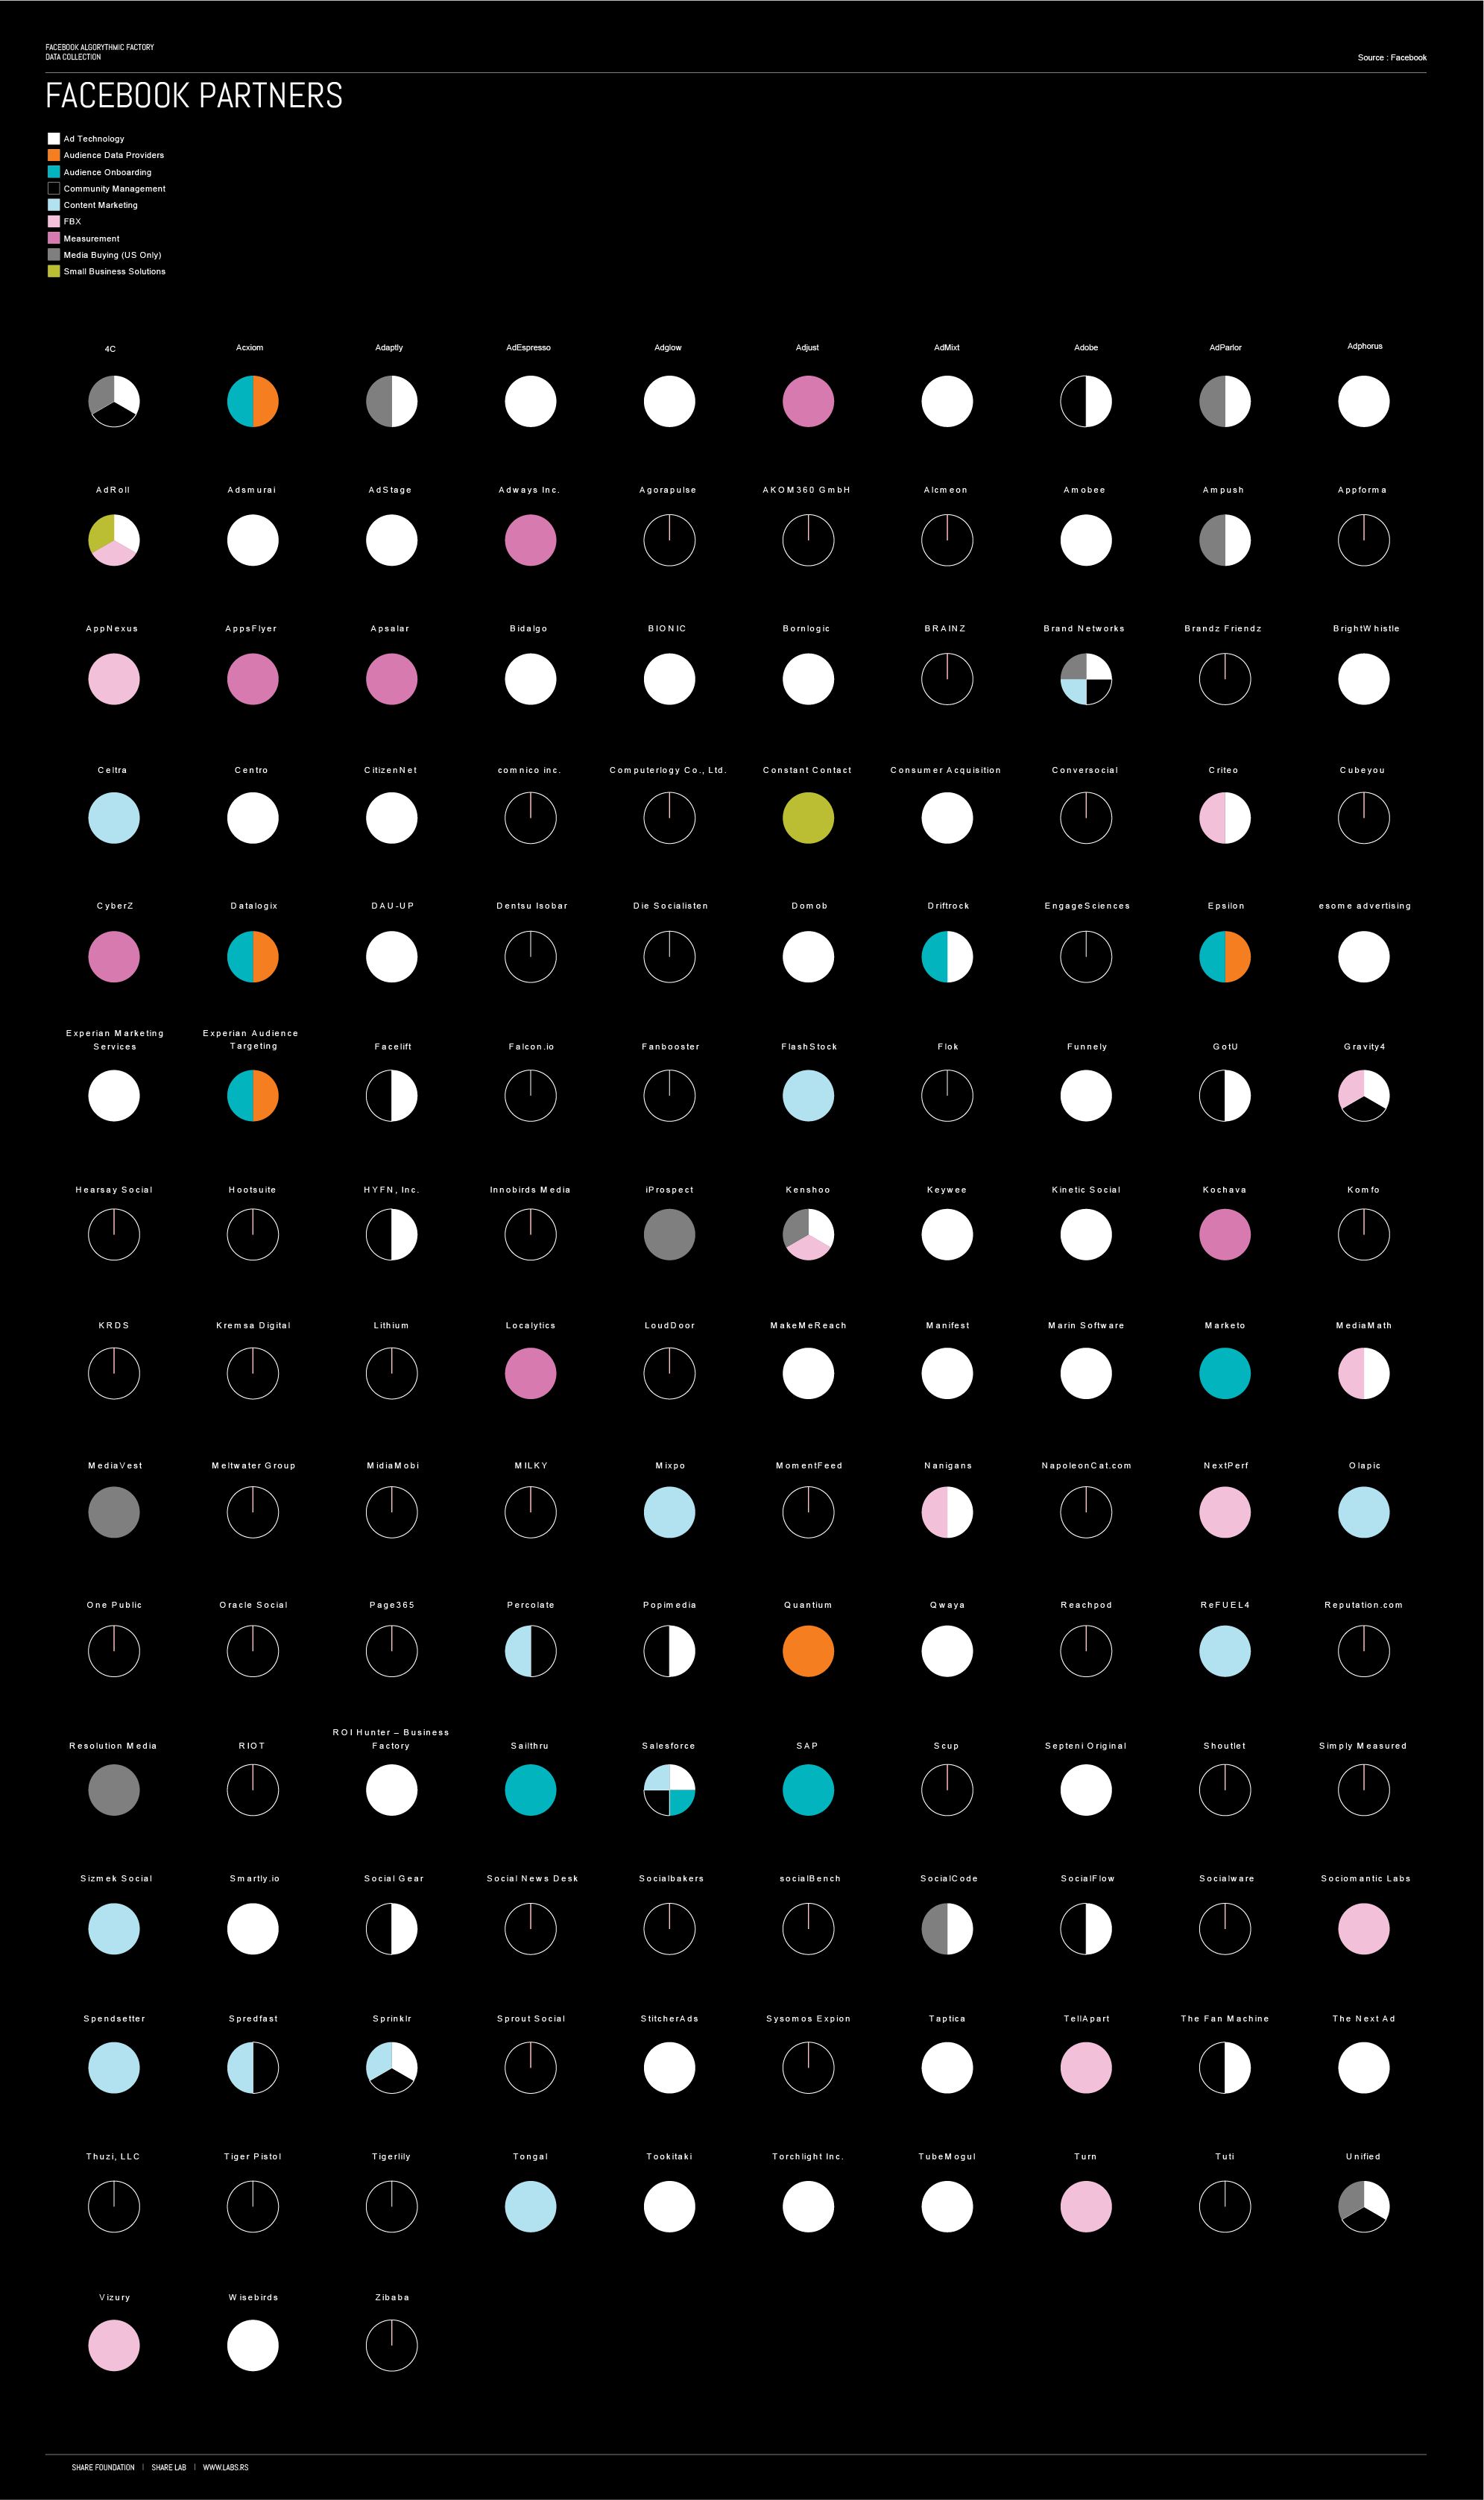
Another group of organisations that have access to Facebook data are vendors, service providers and other partners that are providing technical infrastructure services, analysing how our Facebook services are used, measuring the effectiveness of ads and services, providing customer service, facilitating payments, or conducting academic research and surveys. Facebook claims that these partners must adhere to strict confidentiality obligations.
In this part of our story we explored different forms and methods of data collection, massive operation hidden behind screens, code, embedded in pixels and cookies, performed by our devices and orchestrated by Facebook.
How this huge amount of data flows further, and how it is used, we will investigate in the next chapter of our story: Facebook Algorithmic Factory (2) : Human Data Banks and Algorithmic Labour
SHARE LAB 2016
Vladan Joler – Research, text, data collecting and visualization
Andrej Petrovski – Research, text and proofreading
Contributors : Kristian Lukic and Jan Krasni
The three stories are exploring four main segments of the process:
Data collection – Immaterial Labour and Data harvesting
Storage and Algorithmic processing – Human Data Banks and Algorithmic Labour
Targeting – Quantified lives on discount
The following map is one of the final results of our investigation, but it can also be used as a guide through our stories, and practically help the reader to remain in the right direction and not to get lost in the complex maze of the Facebook Algorithmic Factory.
In his famous ”Postscript on the Societies of Control” Deleuze envisions a form of power that is no longer based on the production of individuals but on the modulation of dividuals. Individuals are deconstructed into numeric footprints, or dividuals,that are administered through “data banks” .
 17th century engraving of the pons asinorum in logic
Research tools and methodology : how data is stored and what kind of algorithms are inside is the hardest part to investigate. Luckily we found a source of knowledge that gave us some kind of insight into those mysterious algorithmic processes: database of all publicly available Facebook patents. We found around 8000 different patents registered by Facebook. Based on them we created possible interpretation of what happens within the black box. Another lead and source of information for us was Facebook Graph API, primary way for third party developers to get data in and out of Facebook’s platform.
Storing Data
Before we explore different ways how Facebook stores and analyses our data, it is important to understand the concept of social graph, a meta structure connecting all data into one structure.
Social Graph : One Graph to Rule Them All
The story of the Social Graph is the story of domination and ambition to rule the World of Metadata by interconnecting every piece of information within and outside of the Facebook Empire into one single graph. “It’s the reason Facebook works.” Said Mark Zuckenberg in 2007 attributing the power of Facebook to the Social graph.
A Social Graph is how Facebook represents all its data, and it’s basically about two things : Objects, also known as nodes and Connections that describe the links between these nodes also known as Edges
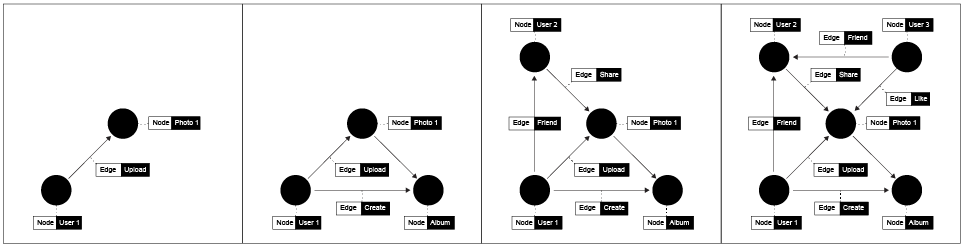
Every user, place, photo, group, event, everything created on or uploaded to Facebook is a unique object in the Facebook database with its own ID. For example, when you like some picture on Facebook, a connection <like> is created between the two objects, you <userID> and photo <photoID>. This photo can have many other connections, i.e. other users that liked the same photo, location associated with that photo or users that are tagged on that photo.
According to the Facebook API, there are the different types of nodes that exist within the Facebook social graph:
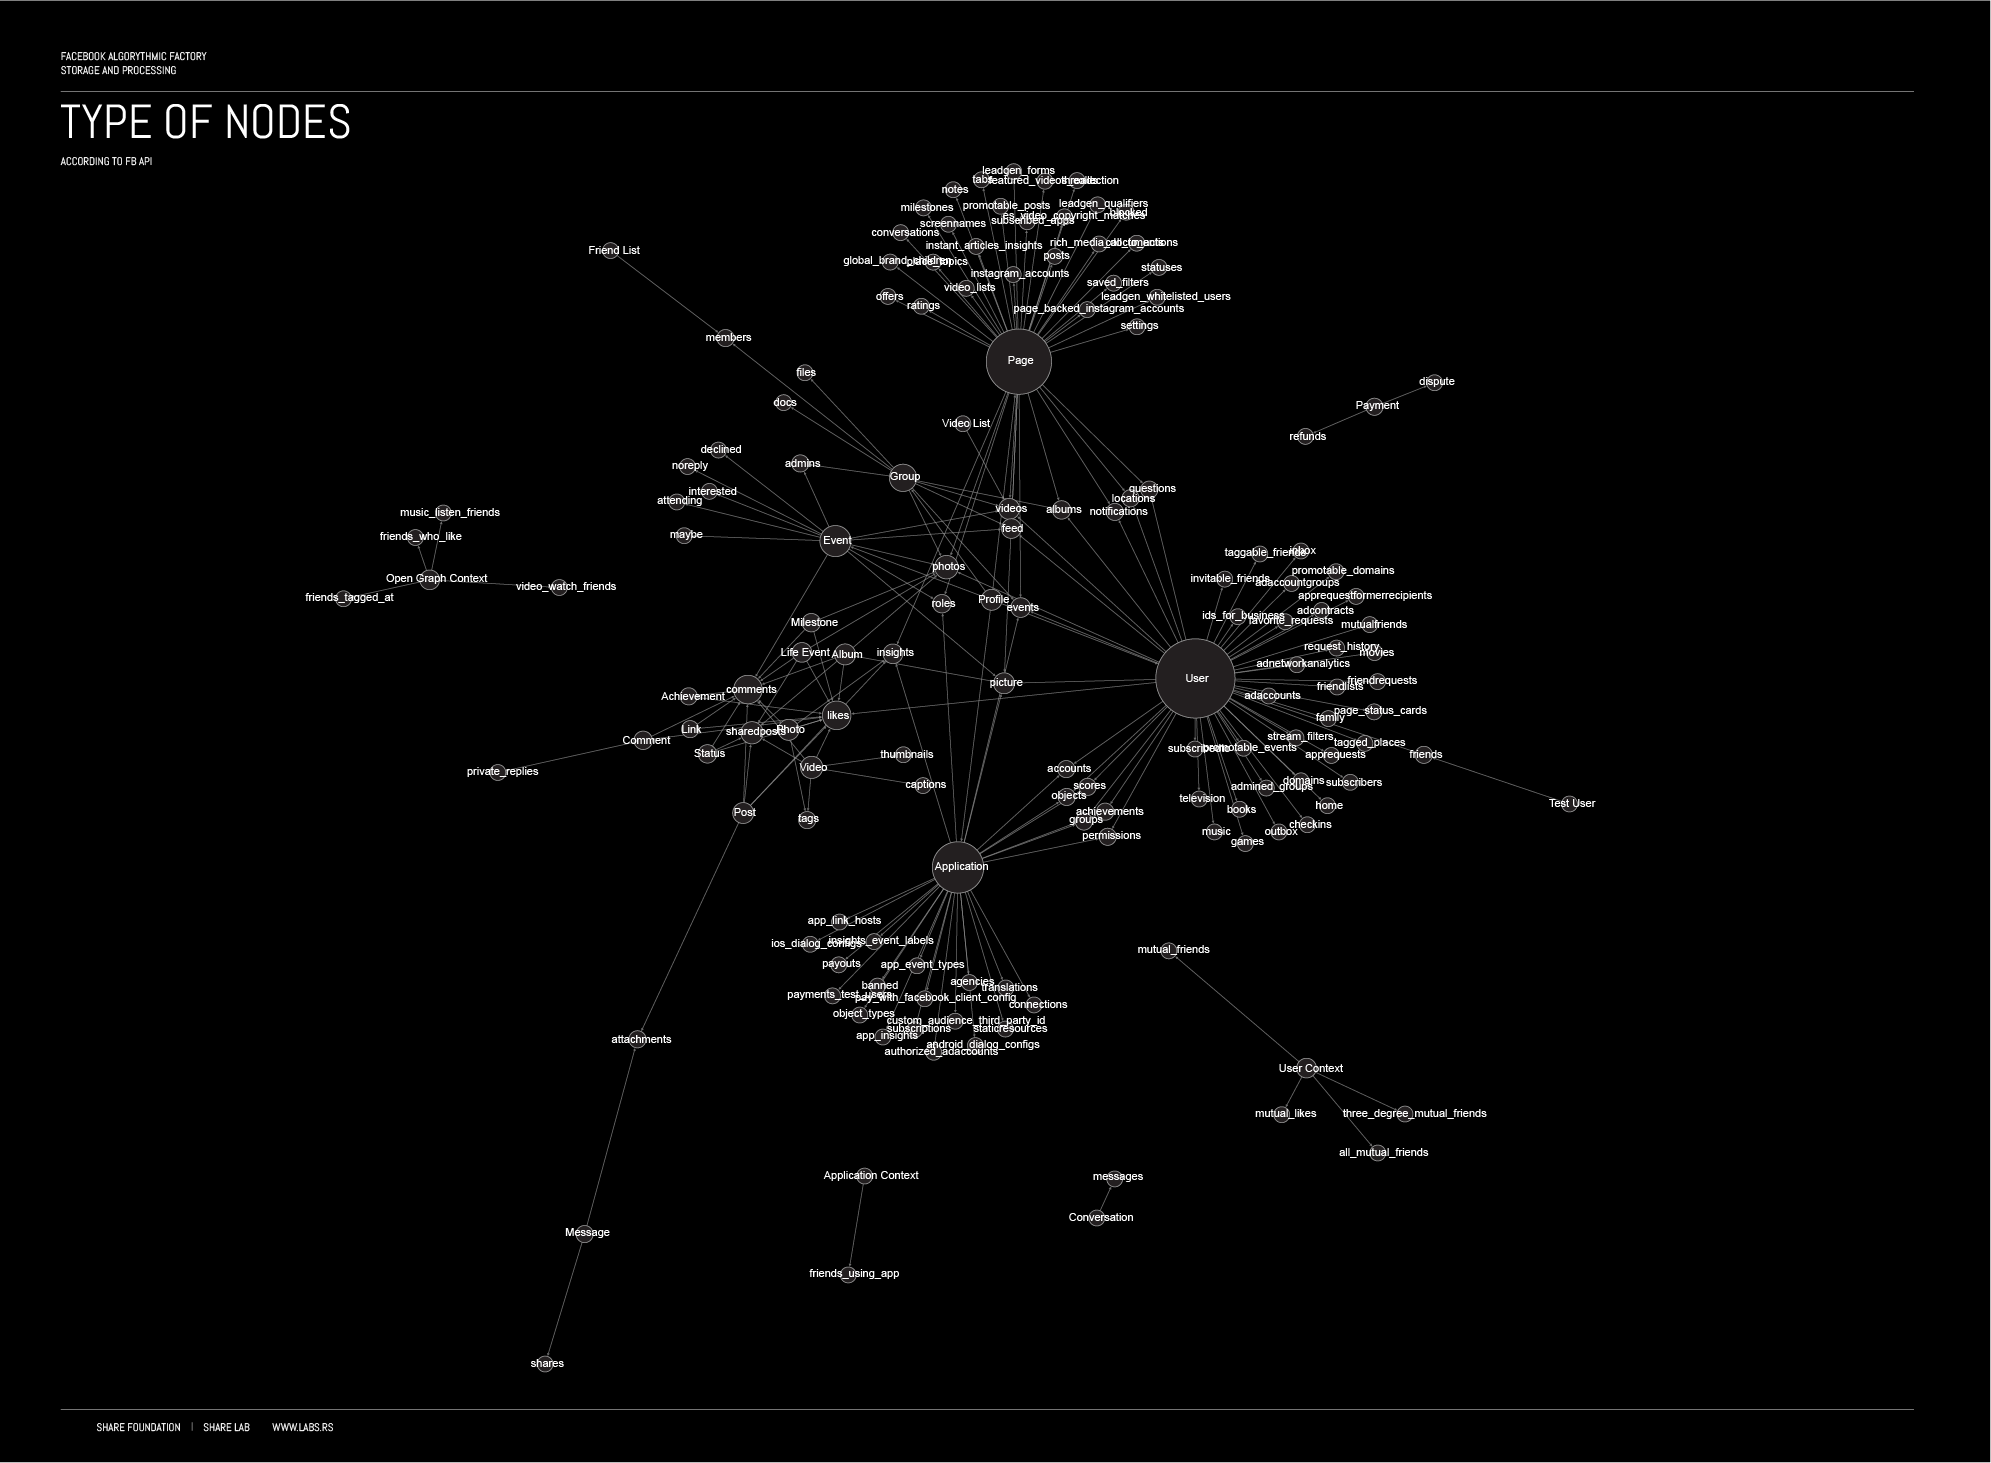
By using a social graph, Facebook is able to relate different users that have liked the same photo or relate people that are tagged on the photo with the location attributed to the photo.
the Facebook universe is a vast social graph made of billions of objects, interconnected by different kind of links.
Feeding the Social Graph
According to dozens of Facebook patents there are 3 different stores, databases that feed the Social Graph, and store all the data, metadata and content we create.
Action store maintaining information describing users’ actions.
Content Store – stores objects representing various types of content.
Edge store – stores the information describing connections between users and other objects
Content Store and Edge Store together are basically a database, structural resource for main meta structure, Social Graph connecting all objects and connections into one structure.
All our actions on Facebook are recorded by Action and Content Loggers that feed the Action and Content stores with new data, constantly expanding the data bank about us, owned by Facebook and potentially shared with many.
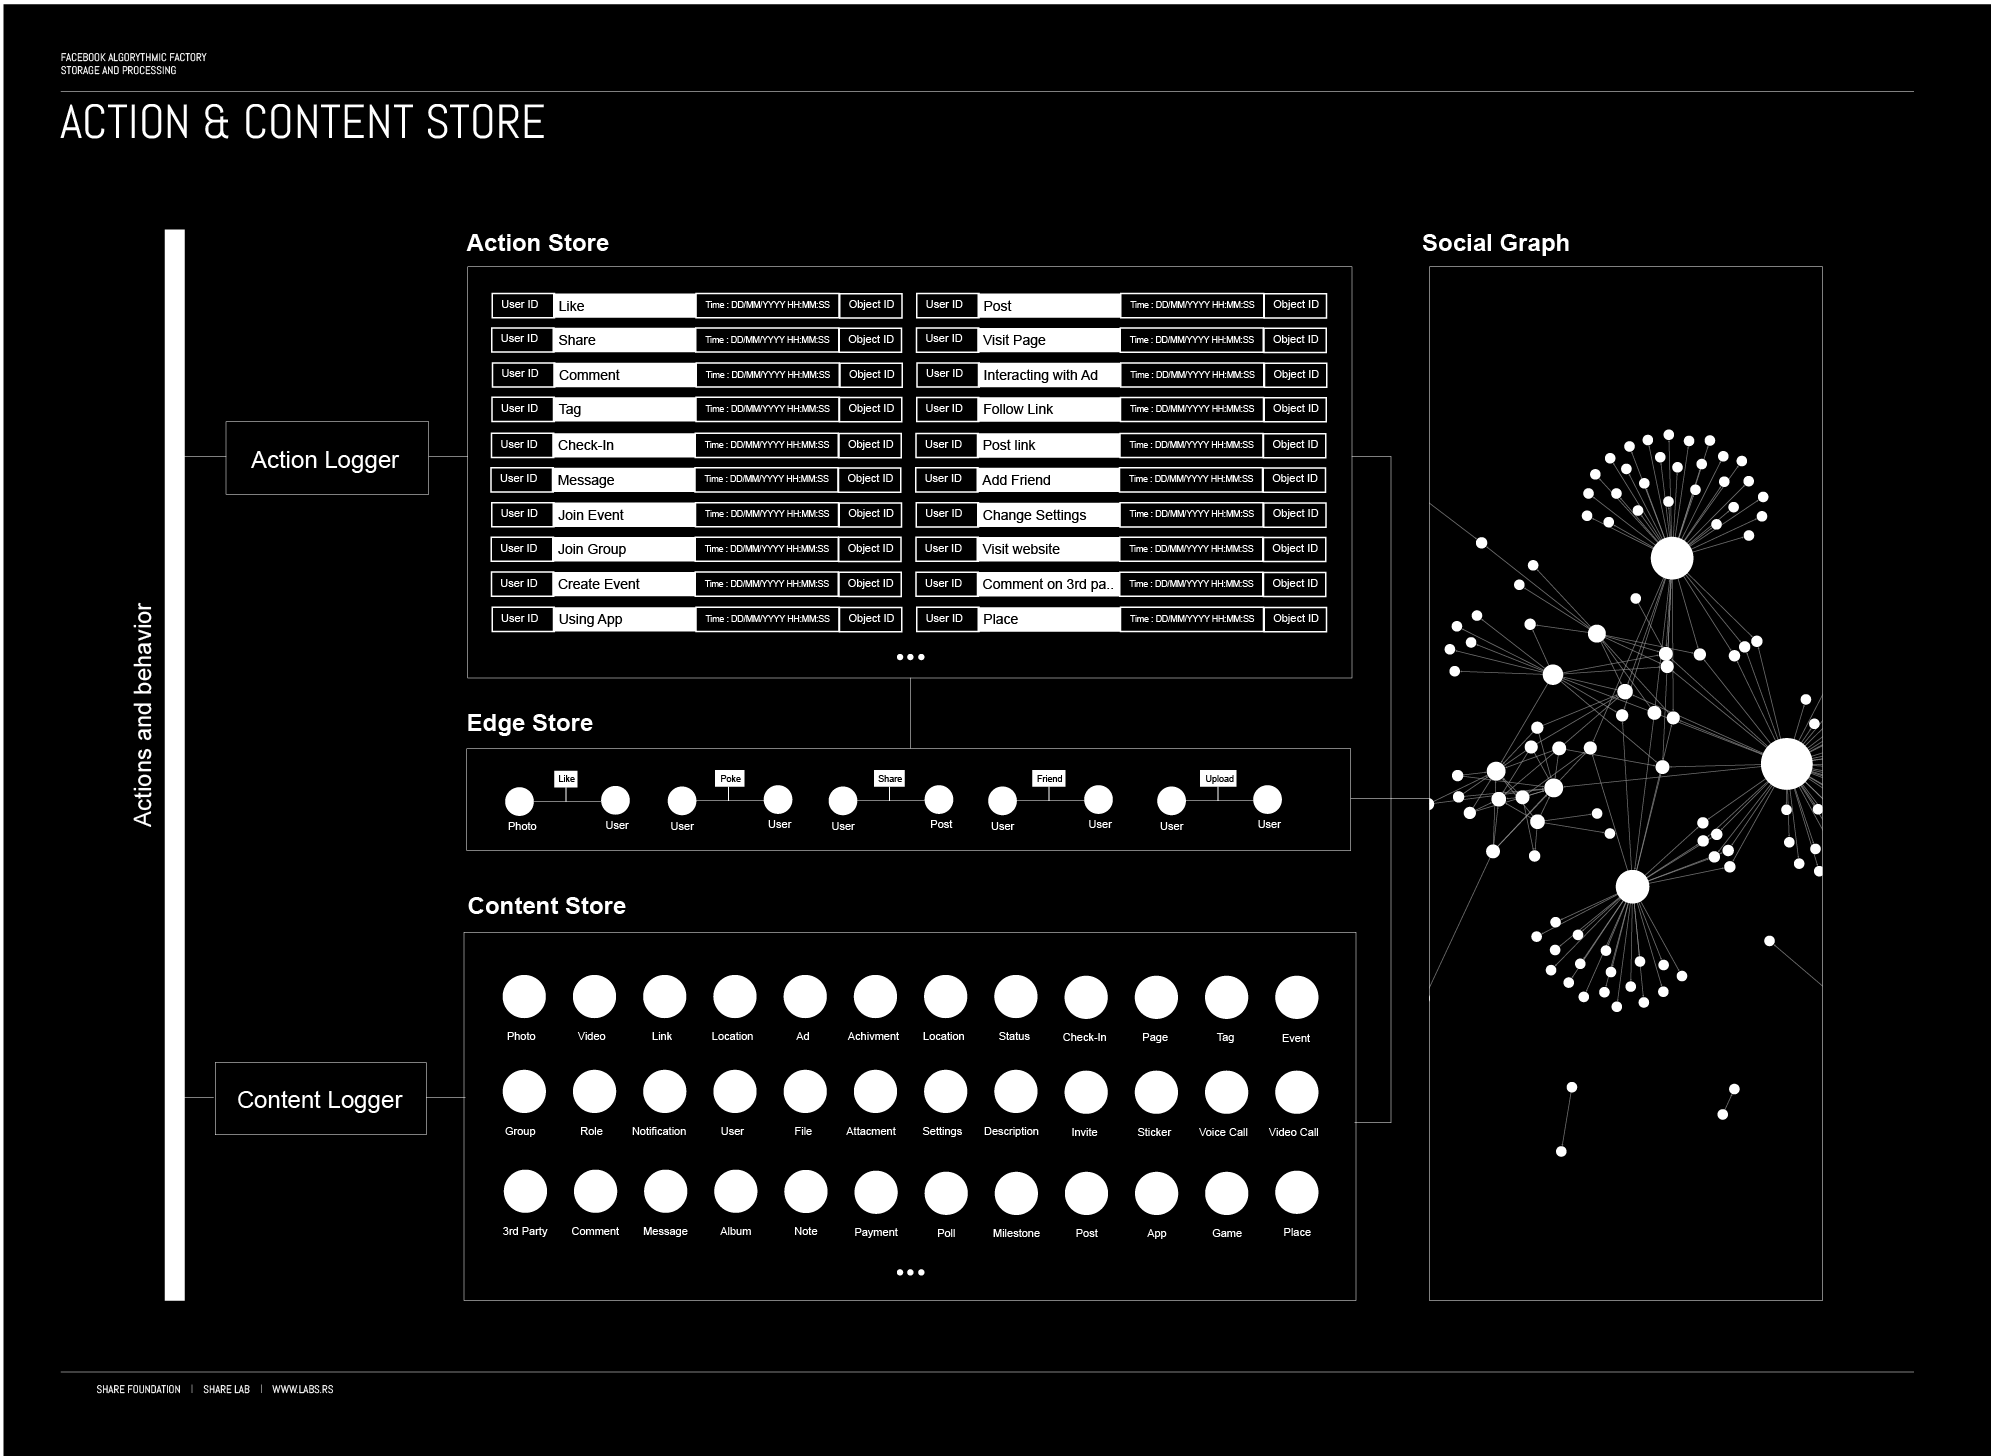
Action Store
Every click, like, share and basically whatever you do on Facebook is collected by an action logger and stored in the Action Store. The action store maintains information describing actions by users, as well as actions performed on third party websites that communicate information to the Facebook. Users may interact with various objects, as we explained before, maintained by Facebook, and these interactions are stored in the action store.
Examples of actions or interactions include: commenting on posts, sharing links, tagging objects, and checking-in to physical locations, commenting on a photo album, transmitting messages to another user, joining an event, joining a group, becoming a fan of a brand page, creating an event, authorizing an application, using an application, interacting with an advertisement, and engaging in a transaction.
Content Store
The content store stores objects representing various types of content such as page post, a status update, a photo, a video, a link, a shared content item, a gaming application achievement, a check-in event at a local business, a brand page, or any other type of content. Objects may be created by users or in some cases received from third-party applications (other websites or apps).
Edge Store
The edge store stores the information describing the connections between users and other objects. Some edges may be defined by users, allowing users to specify their relationships with other users. Other edges are generated when users interact with objects, such as expressing interest in a page, sharing a link with other users, and commenting on posts made by others. The edge store also stores additional information, such as affinity scores for objects, interests, and other information generated by the algorithmic processing that we will cover after.
Profile Store
As we already mentioned, our action data is collected and stored in the action, content and edge stores. On the other hand the information that we are share about ourselves in the profile information section are stored in Profile Store.
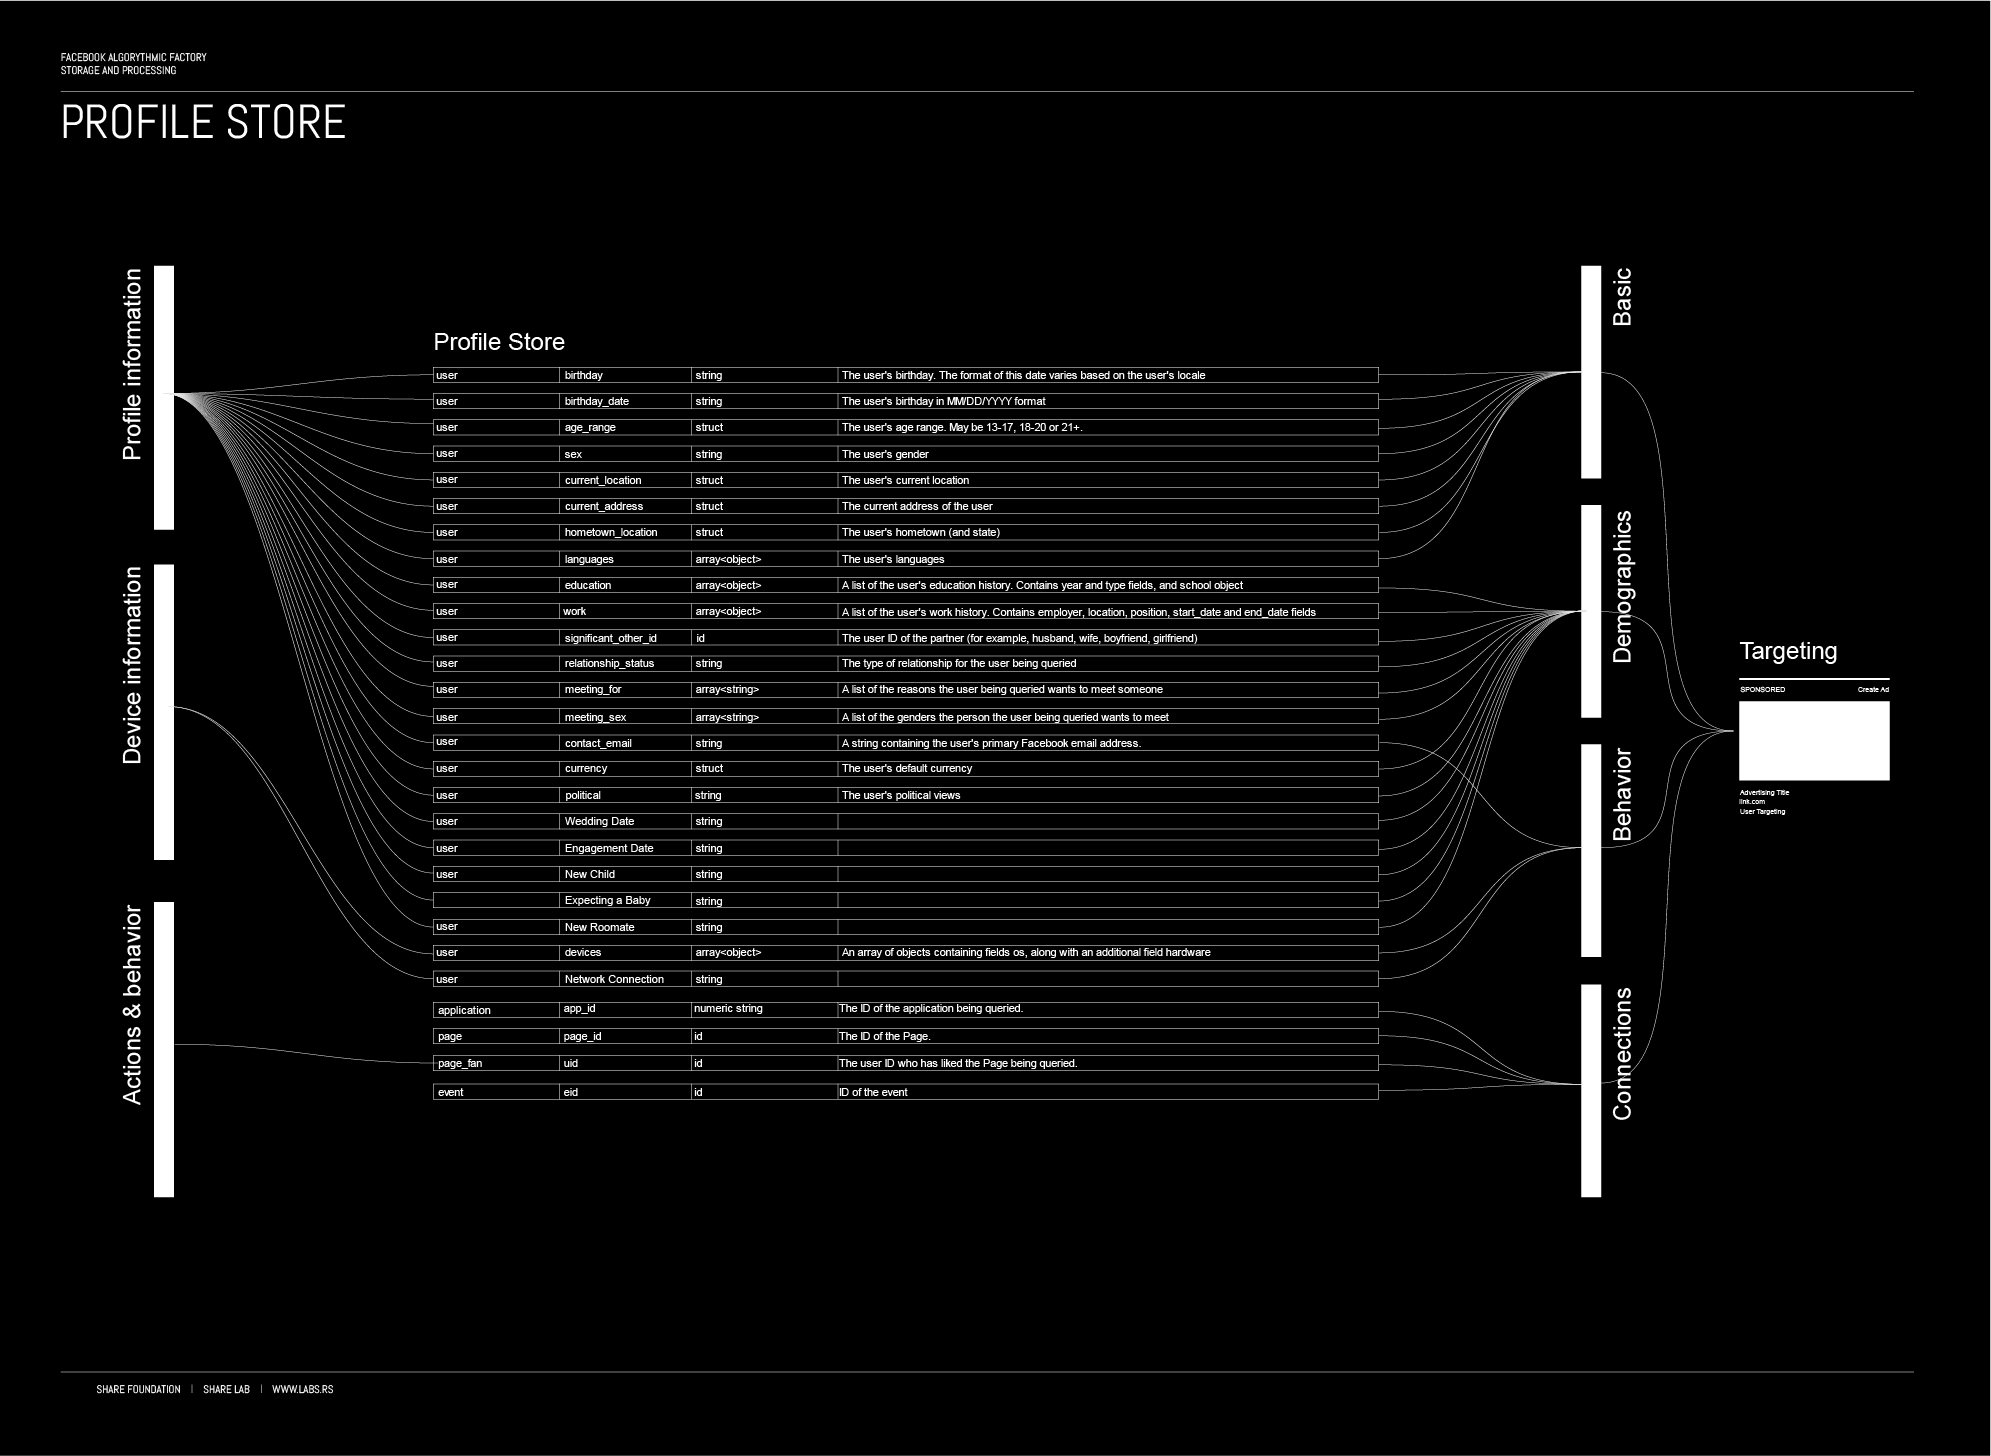
Each user is associated with a user profile, which is stored in the user profile store. A user profile includes declarative information about the user that were explicitly shared by the user and may also include profile information inferred by other means of data collection and analysis performed by Facebook. A user profile may include one or more direct characteristics that uniquely identify a user associated with the user profile such as e-mail address or a phone number. Those information can be used to identify user outside of the Facebook domain, indicates that the user profile and the additional user profile are associated with the same user.This allows Facebook to track users and merge information from other sources. Combined with Facebook’s “real-name system” that is dictating how people register their accounts and configure their user profiles, they can more or less accurately connect your user profile with your real identity. “Facebook is a community where people use their real identities. We require everyone to provide their real names, so you always know who you’re connecting with”
Those structures are buildings of the Facebook Factory, architecture where resource materials, data that is extracted from our behaviour is stored and prepared for the algorithmic workers to deal with. In next chapter we will explore the anatomy of some of the most interesting Facebook workers – algorithms that are transforming behavioural data into a final product.
Processing of data : Anatomy, tasks and responsibilities of an Algorithmic Labourer
Understanding how algorithms process vast amount of data and what is it exactly they do is of great importance for understanding the forms of possible exploitation of our personal data and mechanisms of manipulation on a large scale influencing billions of people every day.
One of our main goals in this research was to try to have an independent insight into those processes and we tried to come up with different methods for measurements or potential methodologies for independent audit of algorithms from the outside, but we faced a lot of difficulties. Nevertheless, even though we didn’t manage to create a methodology based on actual data, our research of Facebook patents gave us an insight into some of the most important processes.
What is an algorithm? Although for the purpose of storytelling it would be much more appealing to attribute algorithms with some superpowers, in most cases, we speak about some really amazing piece of code that applies some advanced statistical or analytical methods. The definition of an algorithm is: A procedure for solving a mathematical problem in a finite number of steps that frequently involves repetition of an operation; broadly: a step-by-step procedure for solving a problem or accomplishing some end especially by a computer.
 Euclid – Detail from the painting “The School of Athens” by the Italian Renaissance artist Raphael created between 1509 and 1511
Action data analysis
As it was explained before, each and every activity on Facebook is being stored in the so – called Action store. That means that the action store is a huge, structured dataset of user activities, making it a quite convenient choice for a targeting mechanism.
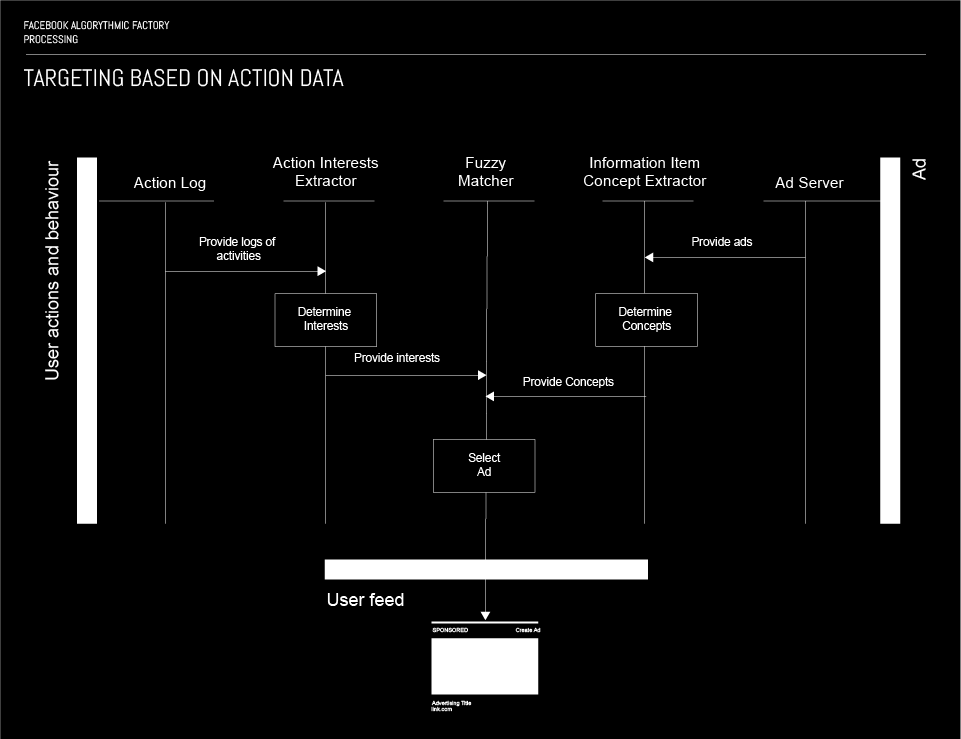
A Fuzzy matching algorithm is used as a principal mechanism for targeting based on data from the action store. Two parallel processes take place in order to generate the input for the fuzzy matcher. First, the activities logs are obtained from the Action log, by Action Interest Extractor. Once these logs are loaded in the Action Interest Extractor, the list of interests of the specific user is determined based solely on data from the Action log, i.e. his activities (clicks, likes, comments, shares, etc…). Then, the list of interest is forwarded to the Fuzzy matcher, as a query.
The second process is the process of selecting the adequate ad for the user that is being targeted by the Fuzzy matcher. The first step in this process is the Ad server providing ads to the Information Item Concept Extractor. Once a set of ads is loaded by the Information Item Concept Extractor, they are analysed and each ad has its concept determined, i.e. each ad is being assigned an attribute representing its concept.
Finally the Fuzzy matching algorithm performs a search, using the interests as a query; as a result selects an ad that makes the best match to the query, which is then being served to the targeted user.
Content analysis
In the previous couple of paragraphs, the mechanism of targeting users by using data from the Action store was explained. Apart from that data, data from the Content store are also being used for targeting users. Needless to say that in this case the targeting is based on contents users publish on Facebook in several different ways.
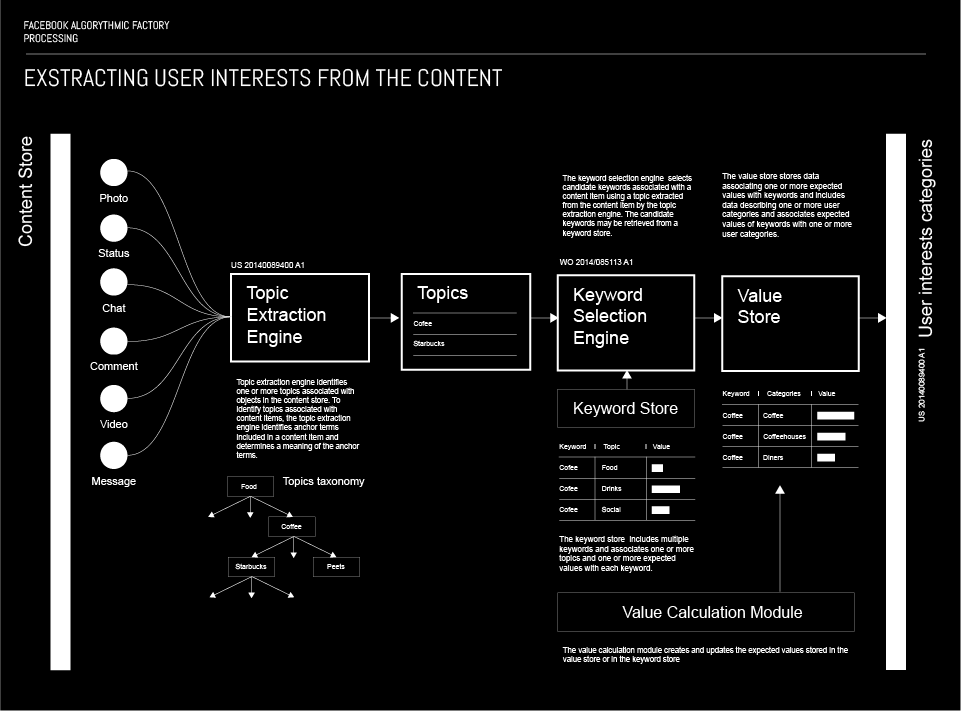
There are two relevant aspect of targeting based on content. The first one are the topics, and the second one are the keywords. When a user posts some sort of content to Facebook, there is a Topic extraction engine that identifies one or more topic associated with the content. In order to associate the topics with the content, the extraction engine analyses it and identifies anchor terms included in the content and determines the meaning thereof.
More about this processUsing the extracted topic, an algorithm defines a list of keywords and associates them one or more expected values. The algorithm uses information about the user to determine the values associated to the candidate keywords on the list. The assigned values are used for ranking the candidate keywords, with the highest ranking being chosen as one the most precisely defines the content.
When choosing what content, i.e. ads will be served to the user in the future, the algorithm uses the links created between the user and the keywords from the content.
An important input for content based targeting also comes from the Action store, and it’s related to negative signals to ad targeting. This is in fact a set of content that the user might have a negative sentiment towards, and is used to label ads that the users would not like to see. When Facebook determines, based on the user’s actions that they dislike particular object (content), it determines the topic of the object and associates negative sentiment to them. The association between negative sentiments and topics is used to decrease the likelihood that an ad matching the said topic will be served to the user.
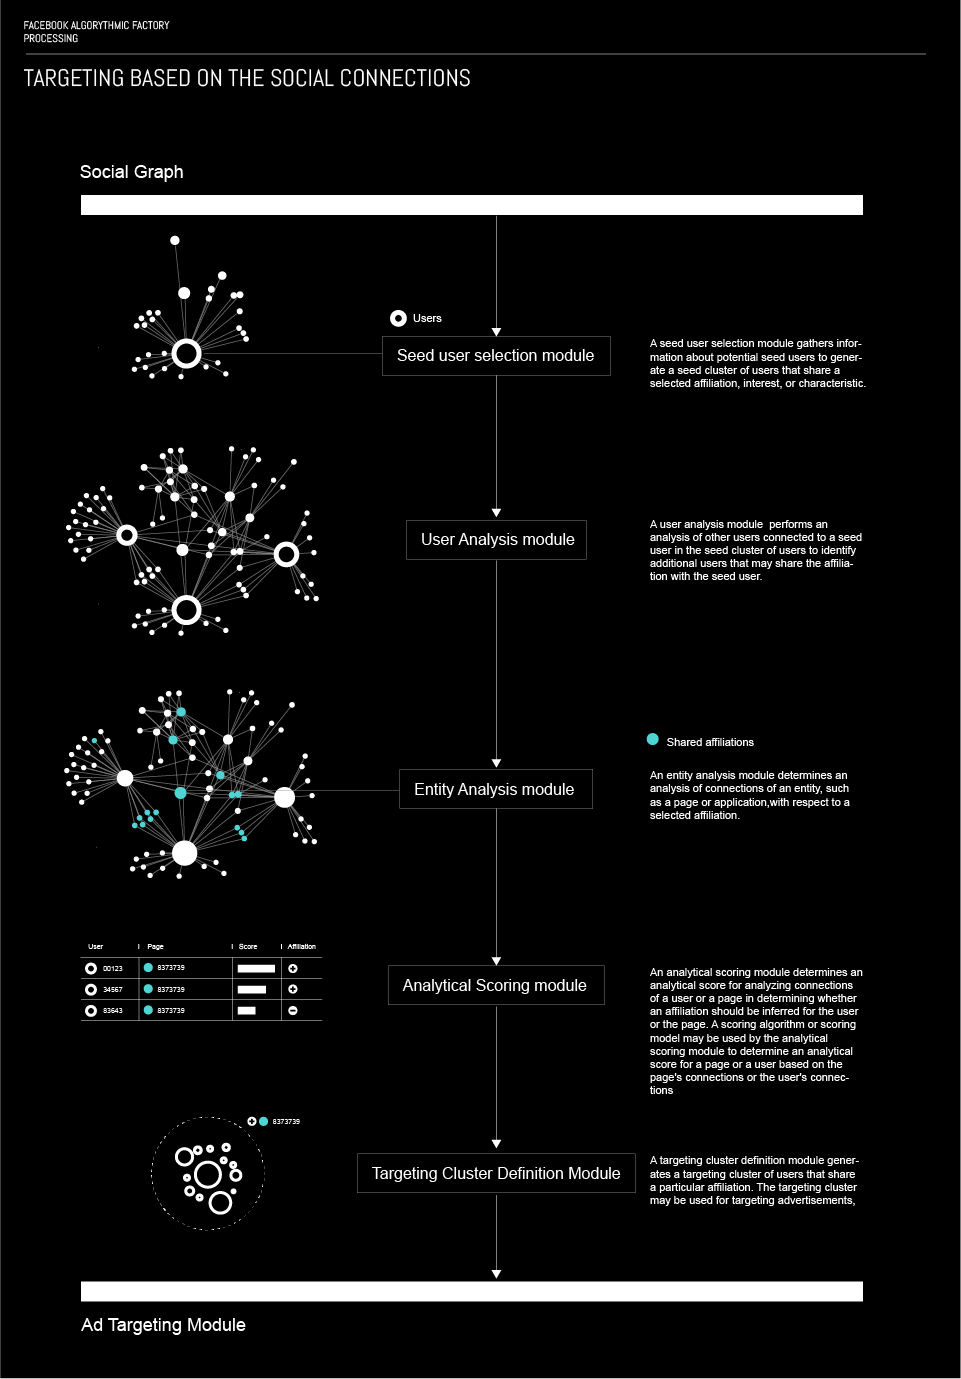
Important data for precise targeting is gathered by forming logical structures of users. Facebook, groups users who share a particular attribute into a structure called seed cluster. Once a seed cluster is created, a set of other users or objects that the user is related to is retrieved. Within these sets, an algorithm determines whether the users in the set share the same attribute as the primary user. The process of determination is based on explicit declaration of the secondary user, analysis of their connections and uses a random walk algorithm. The results are used to decide if the secondary user can also be associated to the cluster. As a result, a targeting cluster is established, and can be used for targeting users and showing them specific ads.
More about this processThe credibility of these clusters is tested by measuring click-through rates of users in the cluster for a particular ad or measuring negative feedback of users in the cluster. In addition to this, users can be put in a cluster based on their interactions with pages, applications etc.
The process of forming groups and subgroups, uses several different modules. First of all, the seed user selection module, which gathers information on potential seed (primary) users and creates a seed cluster of users who share a particular affiliation, interest, or characteristic. In the first stage the algorithm selects users that have explicitly stated these attributes on their profiles (like a page or the likes). However, activities, such as likes, comments, check – ins etc. related to the user can be used for clustering.
A second module is used to make subgroup based on the members of the group (users already in the cluster), by exploring their activities and attributes and checking whether they could form a part of the group. The process of data gathering for these secondary users is similar to the one used on seed users.
The entity analysis module is used to determine attributes of users based on their interactions with pages or applications. For instance if somebody supports a certain political party, the algorithm presumes that they would be interested in a certain types of cars, because most of the users that use a facebook application that shows the nearest selling points for said cars, support the said political party. What this module does is it groups people based on what objects they interact with and what type of users most often interact with such objects.
Some attributes of the user can be determined by evaluating their connections to other users. This is done by the analytical scoring module. This module determines particular attributes of the user by scoring their connections to other people. For instance, if a user has a few weak connections to other users that like white wine and stronger links to users that like red wine, this module would based on the strength on the connections (probably based on mutual interactions, check-ins, tags etc) will consider the primary user as one that likes red wine.
Once certain attributes are determined by the four aforementioned modules, a targeting cluster definition module generates a cluster of users sharing the same attributes. The clusters are used for serving specific types of ads, but also for specific targeting of content that the user is likely to enjoy seing. This way, besides generating revenue, Facebook, also controls the information flow to the user, based on preferences, that a set of algorithms has established. In a way, that could be considered censorship.
The process of forming groups and subgroups, using the aforementioned modules, as a complete flow has several steps. First of all users are structured into subgroups based on a similar attribute; then a centroid (a central user) of the group is identified, and through them, the characteristic of the entire group are identified. All the users in the subgroups are then ranked by the similarity of their attributes, to the ones of the central user i.e. the subgroup. Finally the subgroup is labeled as a whole, compact unit; for example, people who like red wine and Harry Potter.
TARGETING USERS BASED ON EVENTS
This algorithm performs event targeting based on several different criteria. The first and most simple criterion that could indicate an association of a user with an event is the RSVP option on the events created on Facebook. However, since users can RSVP yes, but not attend an event, the algorithm can calculate whether they will really attend the event based on their previous attendance score, the number of their friends attending and the general event history. Additionally the algorithm uses other inputs, such as a check-in at the event venue, uploading a photo of the tickets for the event, record of purchasing tickets on an external website or tagging the event in a post. Event targeting is used on events on all scales from small, private events to global events.
More: PATENT WO2013074367 (A2)
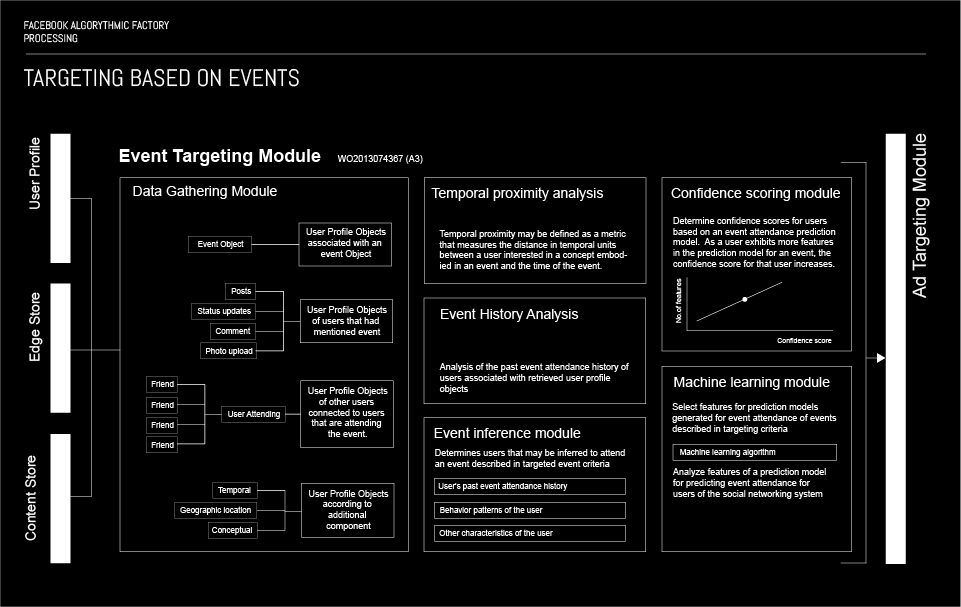
Targeting objects to users based on search results in an online system
This algorithm makes use of the query users input into the search box on Facebook. The purpose of this algorithm is to serve the user with ads that correspond to their search query. As the use inputs the query in the search box, results matching the query are compiled, while the algorithm tries to recognise a structured nodes in the query and in the results. Then. it retrieves ads that correspond to the recognised structured node and at the same time retrieves information about the user. After matching the ads to the user’s information, i.e. attributes, it determines which ads should be shown with the results of the query. This practically happens as the user types in the query, so it is quite hard to perceive it as something so well structured.
More: Patent WO 2014099558 A2
Routine estimation
This algorithm determines the routines of a user by analysing the geolocation of a user over a period of time in hourly intervals. The algorithm uses data about user’s geolocation provided by mobile devices, such as smartphones, tablets or laptops, or rather sensors installed in these devices, i.e. GPS sensor, gyroscope or a compass; the Facebook app installed on the device gathers the necessary data and feeds them to the algorithm. Next, the algorithm analyses the repetition, or the user being at the same location at a certain hour on a certain day of the week. The algorithm then clusters these geolocation centroids; afterwards the clusters are labeled by a place that corresponds to the geolocation centroids in the cluster. In that manner, the algorithm can determine where the user lives, where they work, if they go to the farmer’s market on a saturday morning, do they go to the gym and how frequently etc.
More : Patent : WO 2014123982 A3
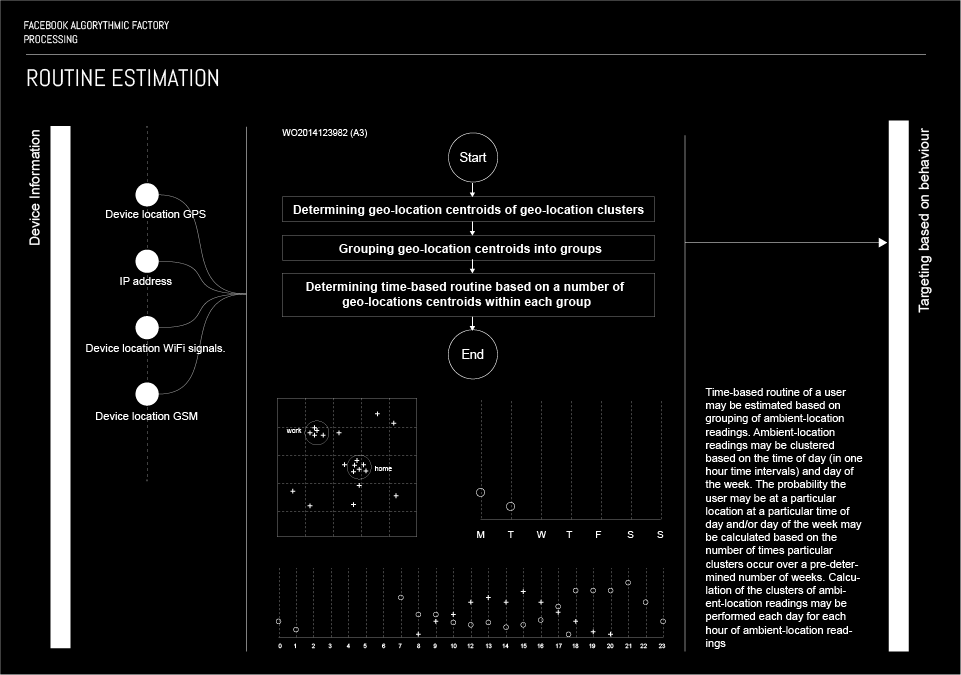
Inferring household income for users
This algorithm maps a user into a particular income bracket. This is done through analysis of the information the user provides, i.e. Current and past work positions, current and past education institution they have attended, life events, family relations and marriage status. However, since users have the ability to provide false information to Facebook, this algorithm further analyses user’s behaviour, websites they visit, purchases they make online etc. The algorithm uses different techniques to map the user in a particular bracket, including image analysis to recognise brands the user wears on photos they upload, how often they use brand names in posts and searches etc. These information is then used to enable advertisers to easier target their appropriate target group by income. Also, the machine learning algorithm has the ability to detect when users have given faulty information or have forgotten to update their information, such as change of workplace, moving to another city marital status and the likes.
More: Patent US 8583471 B1
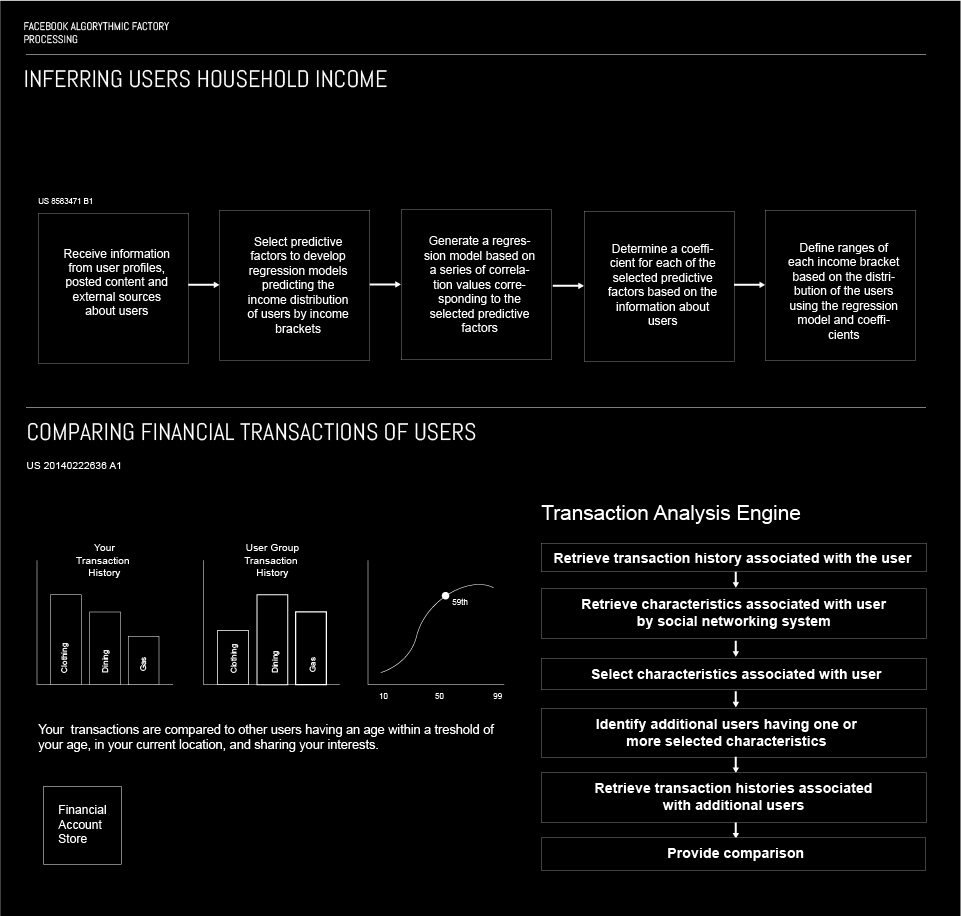
Comparing Financial Transactions Of Users
What this algorithm does is comparing the buying habits of a user compared to a group of users the user can be associated with by sharing similar attributes, such as age, location, education level, work position etc. The algorithms analyses search queries, visits to external websites and other types of transactions within Facebook and on third – party websites. Using this data, the algorithm can provide the user with analysis of former transactions, but can also predict future spendings, for example it can predict how much would a user spend on travel by comparing his previous transactions to other users that share similar interests, have the same age and live in the same city as the primary user.
More: Patent US 20140222636 A1
Associating cameras with users of a social networking system
This algorithm associates Facebook users based on pictures and/or videos taken using the same camera, i.e. device. When photos or videos are uploaded on Facebook, the UI, camera signature is red by the algorithm and it serves as a connection point for users uploading photos or videos taken using the same device, i.e. camera. This can be used for detecting fake accounts, a user having multiple accounts; but also for the purpose of a social graph, i.e. recommending friends, prioritising news feed, etc.
More: Patent US 8472662 B2
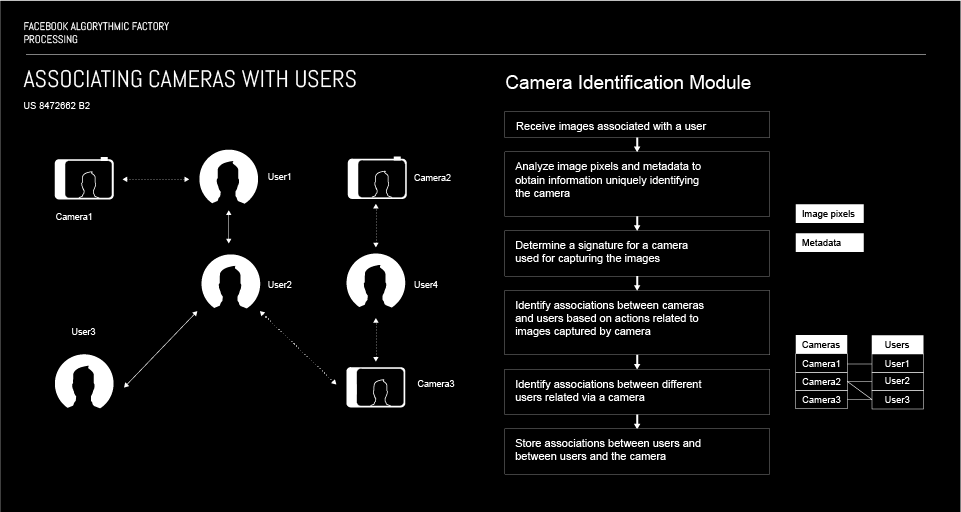
There are some, in our opinion, interesting and relevant algorithms that are used in the process of quantification and monetisation of our everyday life. The featured algorithms are just few examples of probably hundreds and hundreds of different algorithms that try to understand every our action and post, classify us into nano-sub categories and predict our future behaviour. We encourage the readers of this text to explore by themselves the available patents and continue this research in order to understand this phenomenon.
In the third and final part of this story, Targeting – Quantified lives on discount, we will explore the form of the final product of the Facebook Algorithmic Factory and discuss issues and problems related to mapping the Facebook Empire.
SHARE LAB 2016
VLADAN JOLER – RESEARCH, TEXT, DATA COLLECTING AND VISUALIZATION
ANDREJ PETROVSKI – RESEARCH, TEXT AND PROOFREADING
CONTRIBUTORS : KRISTIAN LUKIC AND JAN KRASNI
]]>
The three stories are exploring four main segments of the process:
Data collection – Immaterial Labour and Data harvesting
Storage and Algorithmic processing – Human Data Banks and Algorithmic Labour
Targeting – Quantified lives on discount
The following map is one of the final results of our investigation, but it can also be used as a guide through our stories, and practically help the reader to remain in the right direction and not to get lost in the complex maze of the Facebook Algorithmic Factory.
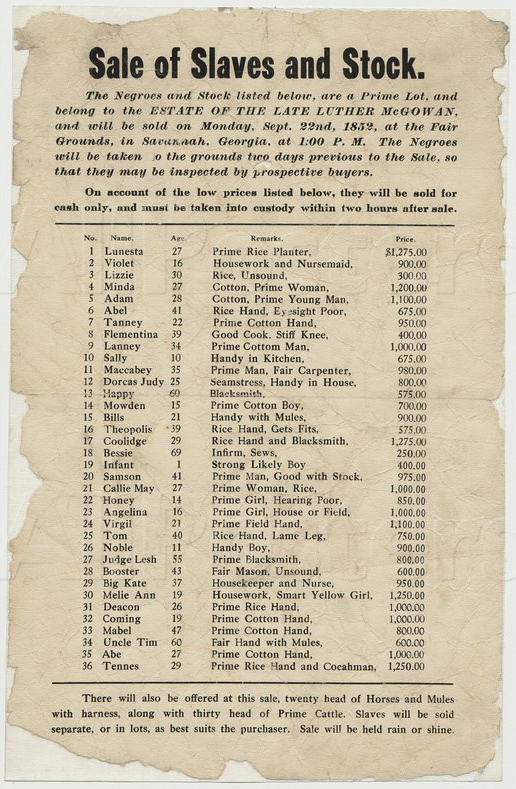
Targeting : Quantified liVes on discount
“In their now classic study of traditional media, Manufacturing Consent, Herman and Chomsky explain the basic business model of newspapers as being the production of an audience for advertising. Their analysis suggests the counterintuitive notion that publishers’ main product is not the newspaper, which they sell to their readers, but the production of an audience of readers, which they sell to advertisers. In short, the readership is their product.”
The difference between Facebook and traditional media is that on Facebook there is no readership in general, but the an algorithmic labour and production within the Facebook Factory which allows them to profile and sell each user as an different product.
In order to map this process we examined the structure, categorisation and targeting methods available to advertisers through Facebook. There are 3 main categories of targeting options, user profiling based on basic information (location, age, gender and language), detailed targeting (based on users’ demographics, interests and behaviours) and connections (based on specific kind of connection to Facebook pages, apps or events). Every user is basicly profiled and tagged with the use of those three methods and is being offered as a target for advertising. Facebook’s revenue ($ 17.93bn in 2015) directly depends on the user profiling quality. The more accurate the user profiles are, the better product offered to advertisers they become. The ultimate product of Facebook’s surveillance economy is a deep insight into your interests and behaviour patterns, exact knowledge who you really are and prediction how you will eventually behave in the future, packed in user profiles.
Connecting the dots
It is important to say that the left side of the presented visualisations is based only on our assumptions. According to the list of different types of data collected by Facebook and different algorithms, databases and meta structures that we featured in previous segments of our research, we tried, using our logic to make conclusions and to relate different targeting methods with matching data sources and algorithms.
For example, if on the Targeting side we have targeting based on <user gender>, we can easily relate, connect this with <gender> information provided by the user in the Profile Information section on the Input side of the graph. But, in most cases, it is not as simple as that.
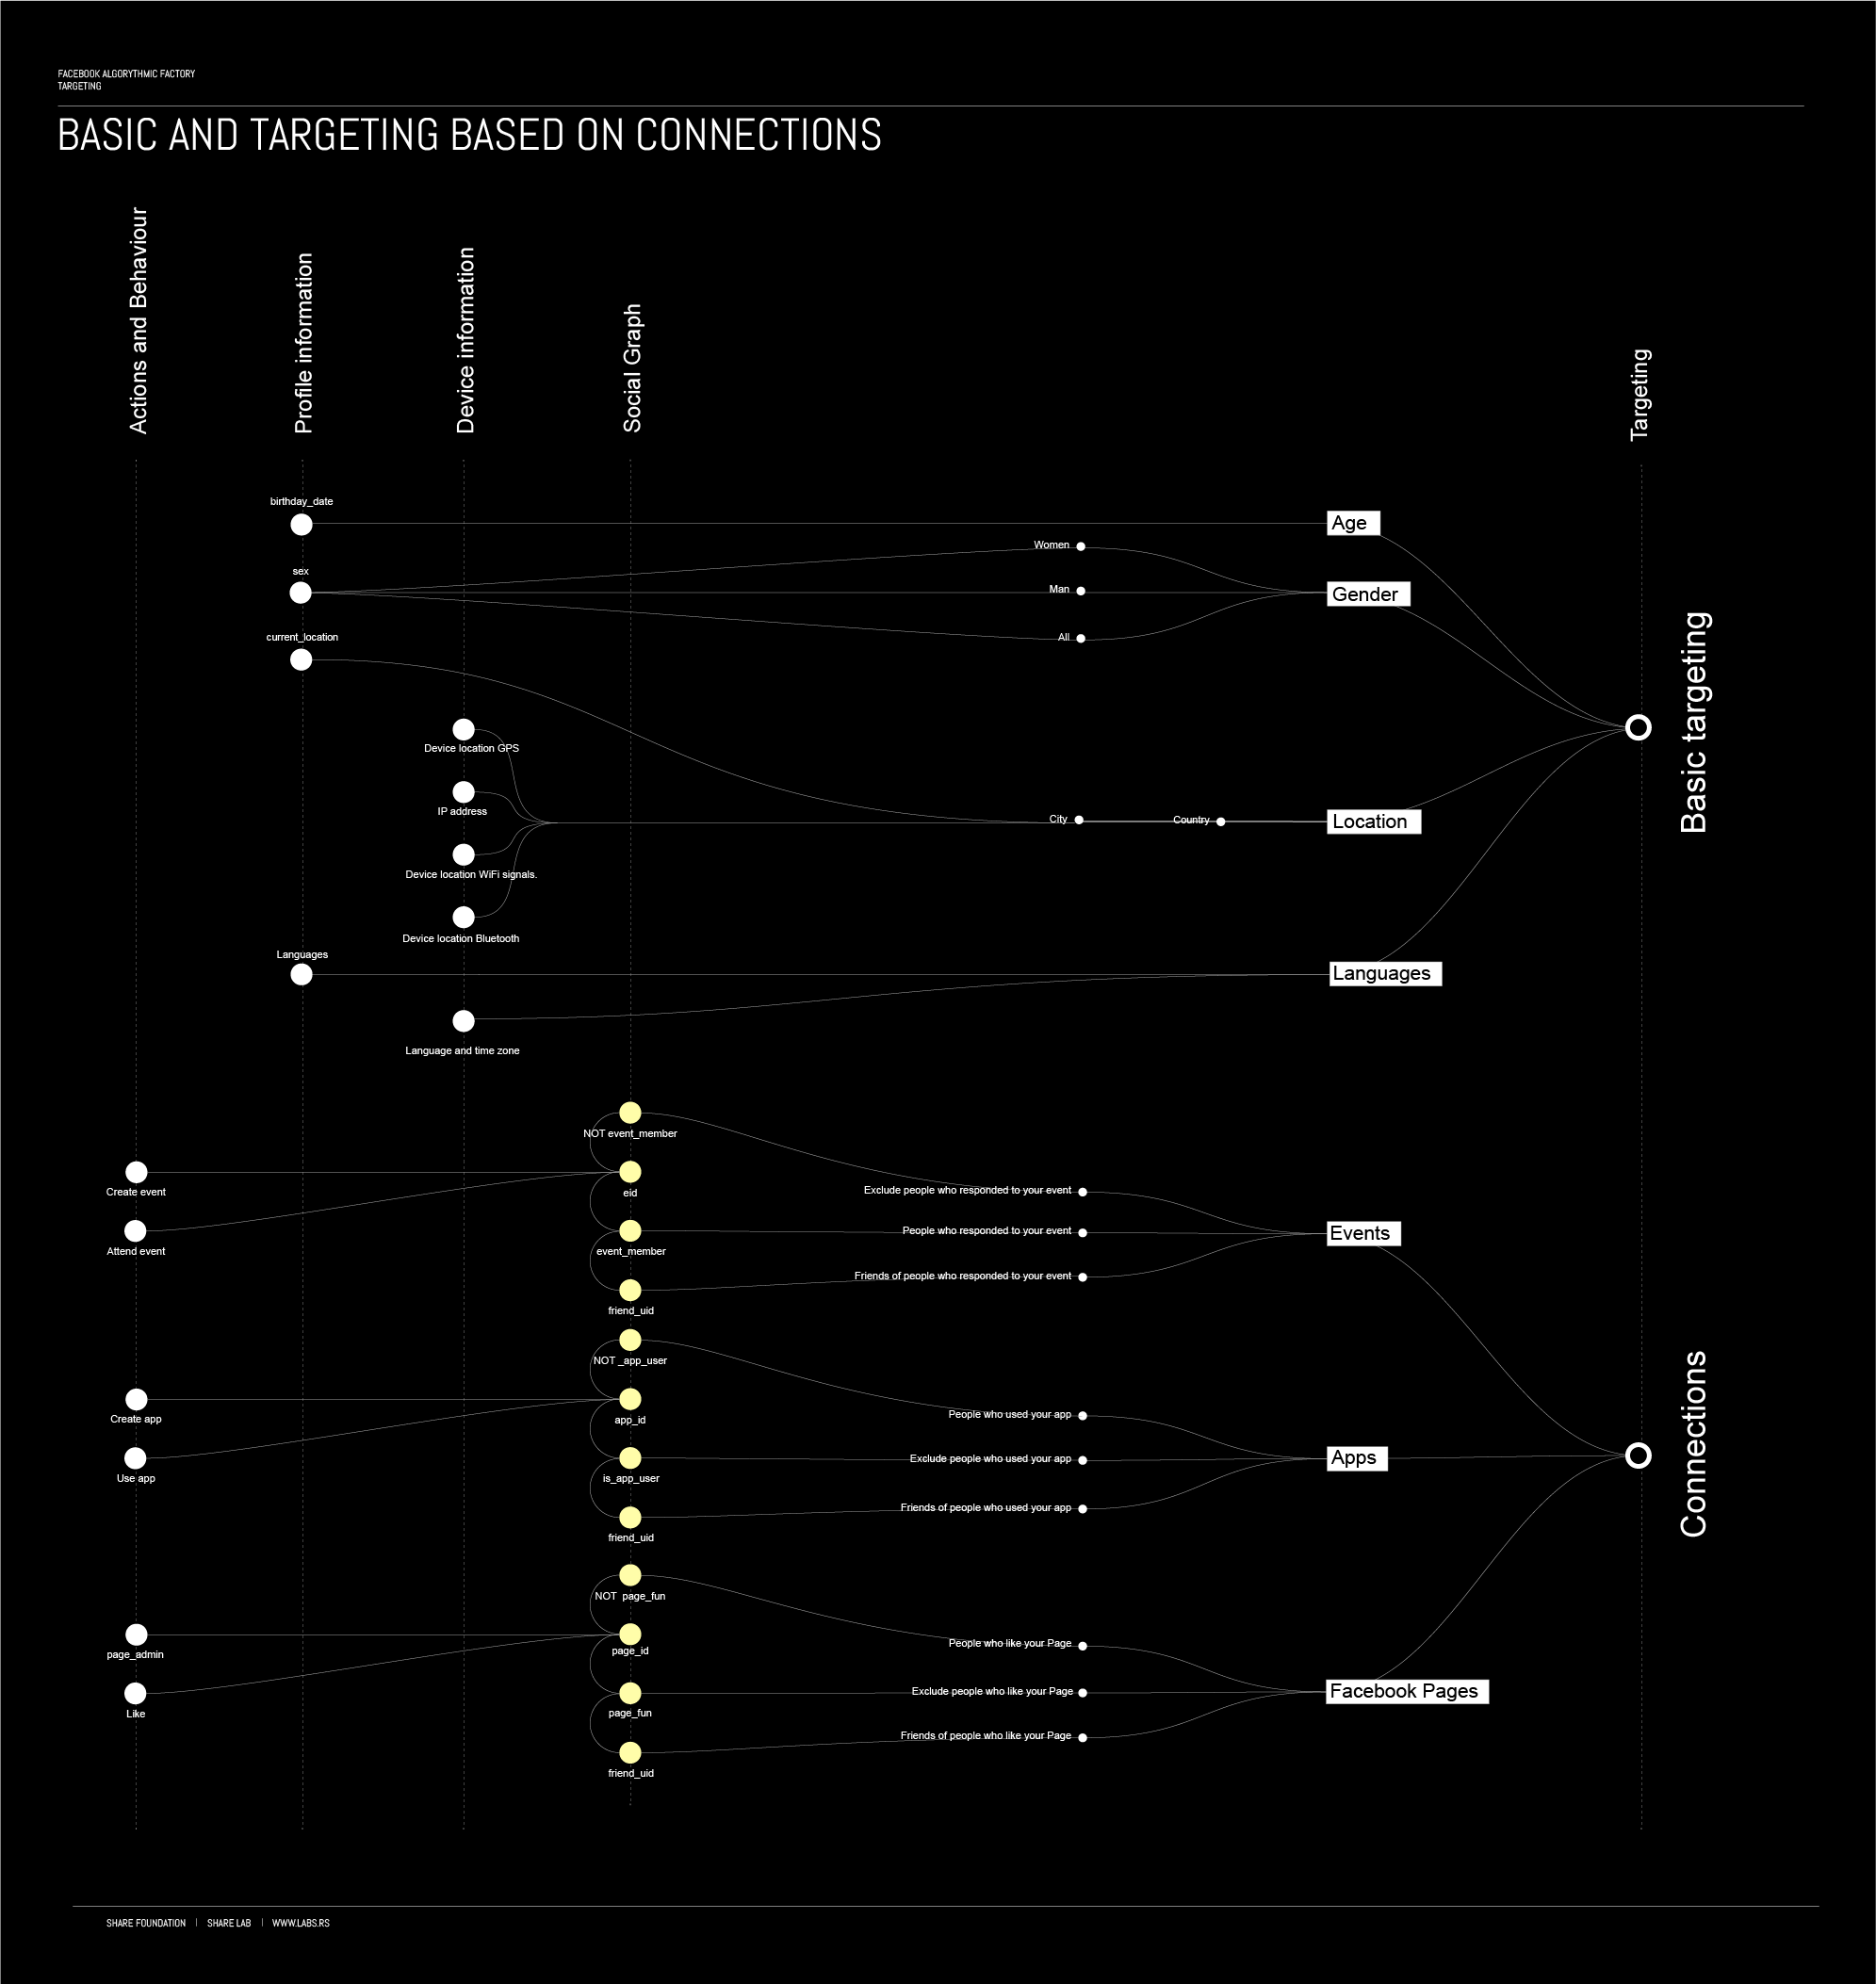
Basic targeting is mostly based on information provided by users in the Profile information section, except location that can be determined in multiple ways using the digital footprint of our devices. Targeting based on Connections can be based on data from the Social Graph and Action data.
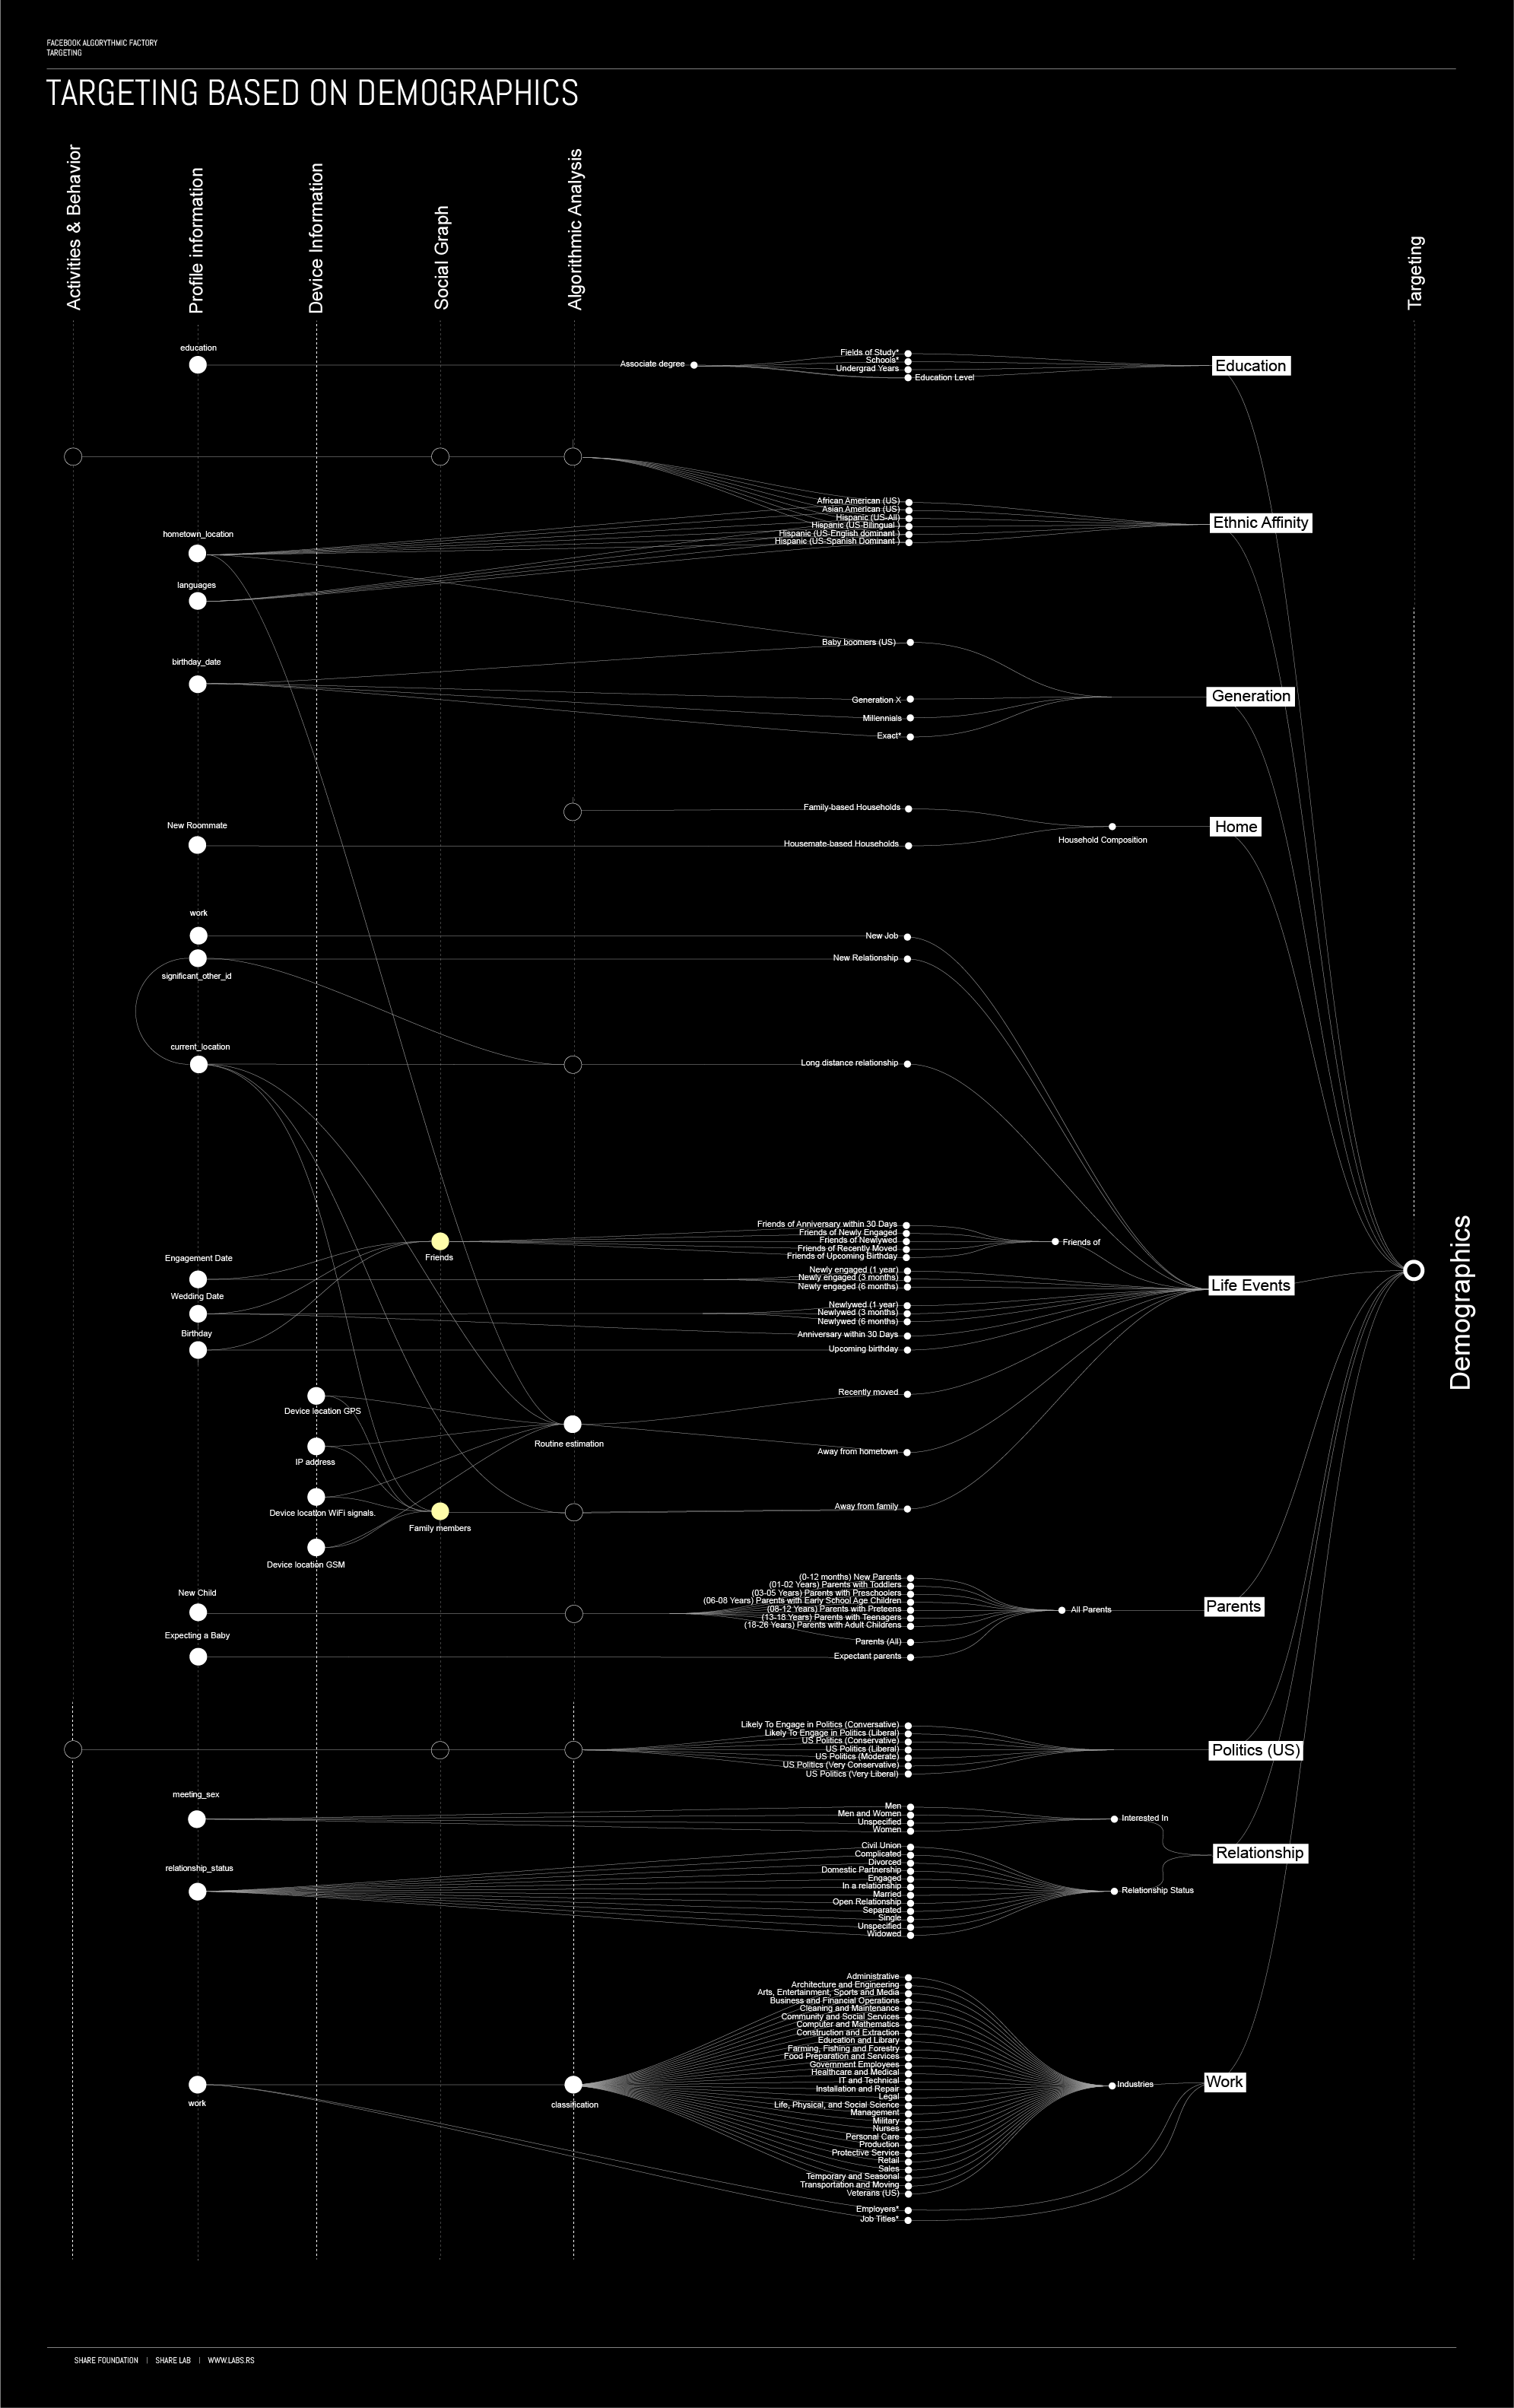
Our assumption is that Targeting based on Demographics is mostly based on profile information, but there are few interesting cases that can be potentially subject of further investigation.
For example, Facebook offers among other categories, targeting based on ethnic affinity and as one of the option, they offer targeting of US Hispanic, African-American and Asian-American clusters. They have explained that this is based on actual users who are interested in or will respond well to Hispanic content, based on how they use Facebook and what they share on Facebook. To be able to cluster users into this kind of categories, they probably use analysis of users’ social connections in the social graph. However, a legitimate question to Facebook at this point would be, how African-Americans use Facebook in a different manner that can be tracked compared to Asian-Americans?
Another interesting and potentially unethical targeting method is something that they call targeting based on Life events. Here you can be targeted not only based on your behaviour but based on the behaviour and actions of you friends. So, for example you can be a target of advertising if the people in your social network are engaged in certain topics. This is a clearly great example of the power of the social graph analysis.
An excellent example of how hard it is to avoid targeting on Facebook, if we consider for example the Parents category, is an experiment from a Princeton sociology professor, Janet Vertesi who tried to see if it is possible to prevent Facebook detect she was pregnant.
In light of the recent discussions related to the power of Facebook manipulating voter behaviour during election time, One category in this section drew our intention: politics
Facebook offers targeting of US users based on their political views (conservative or liberal) and on a scale from likely to engage in politics, over moderate to very conservative or liberal. The clue on how Facebook can perform this kind of analysis and draw this kind of conclusions about each user can be found in a segment of our research Targeting based on the social connections and in patent – Inferring target clusters based on social connections (US 20140089400 A1) .
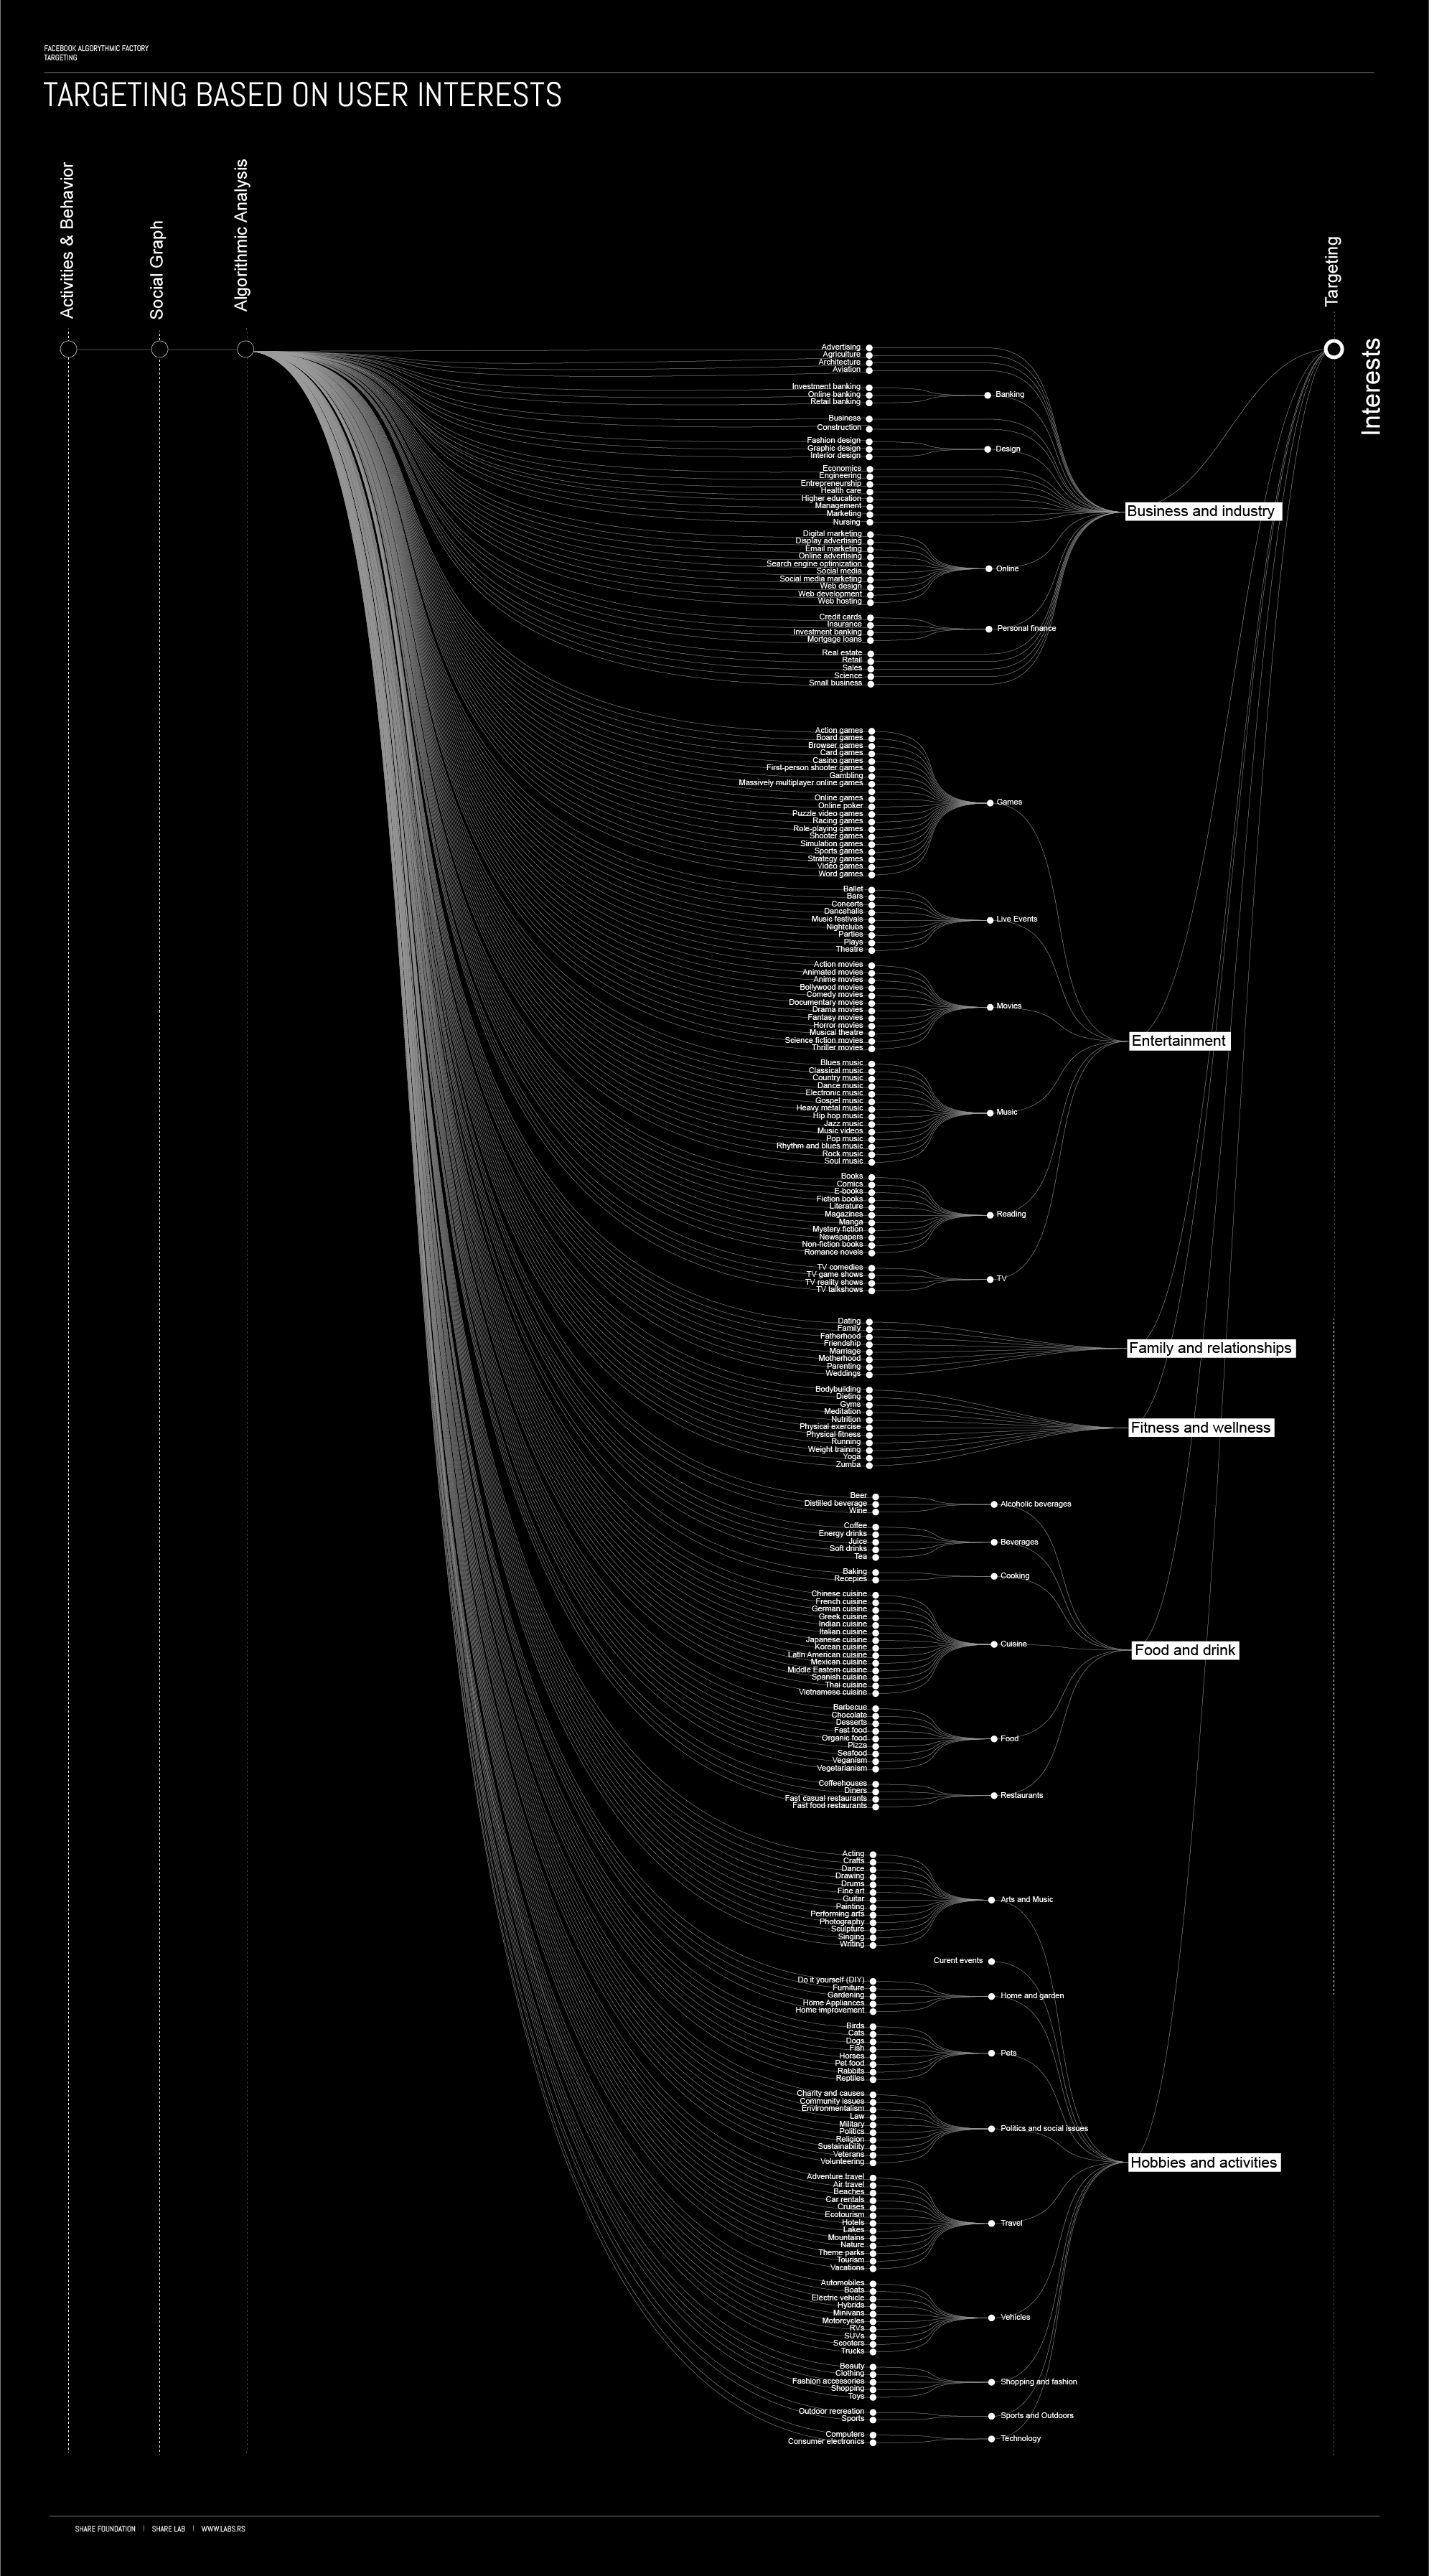
Targeting based on the user interest is by our opinion solely based on the process of Action data and Content analysis. As we explained before, during this process, keywords and topics are extracted from the user content and each content is basically tagged with associating keywords and topics. Interaction and actions of users related to content is then matched with the use of the fuzzy matching algorithms with the ads in different categories and subcategories.
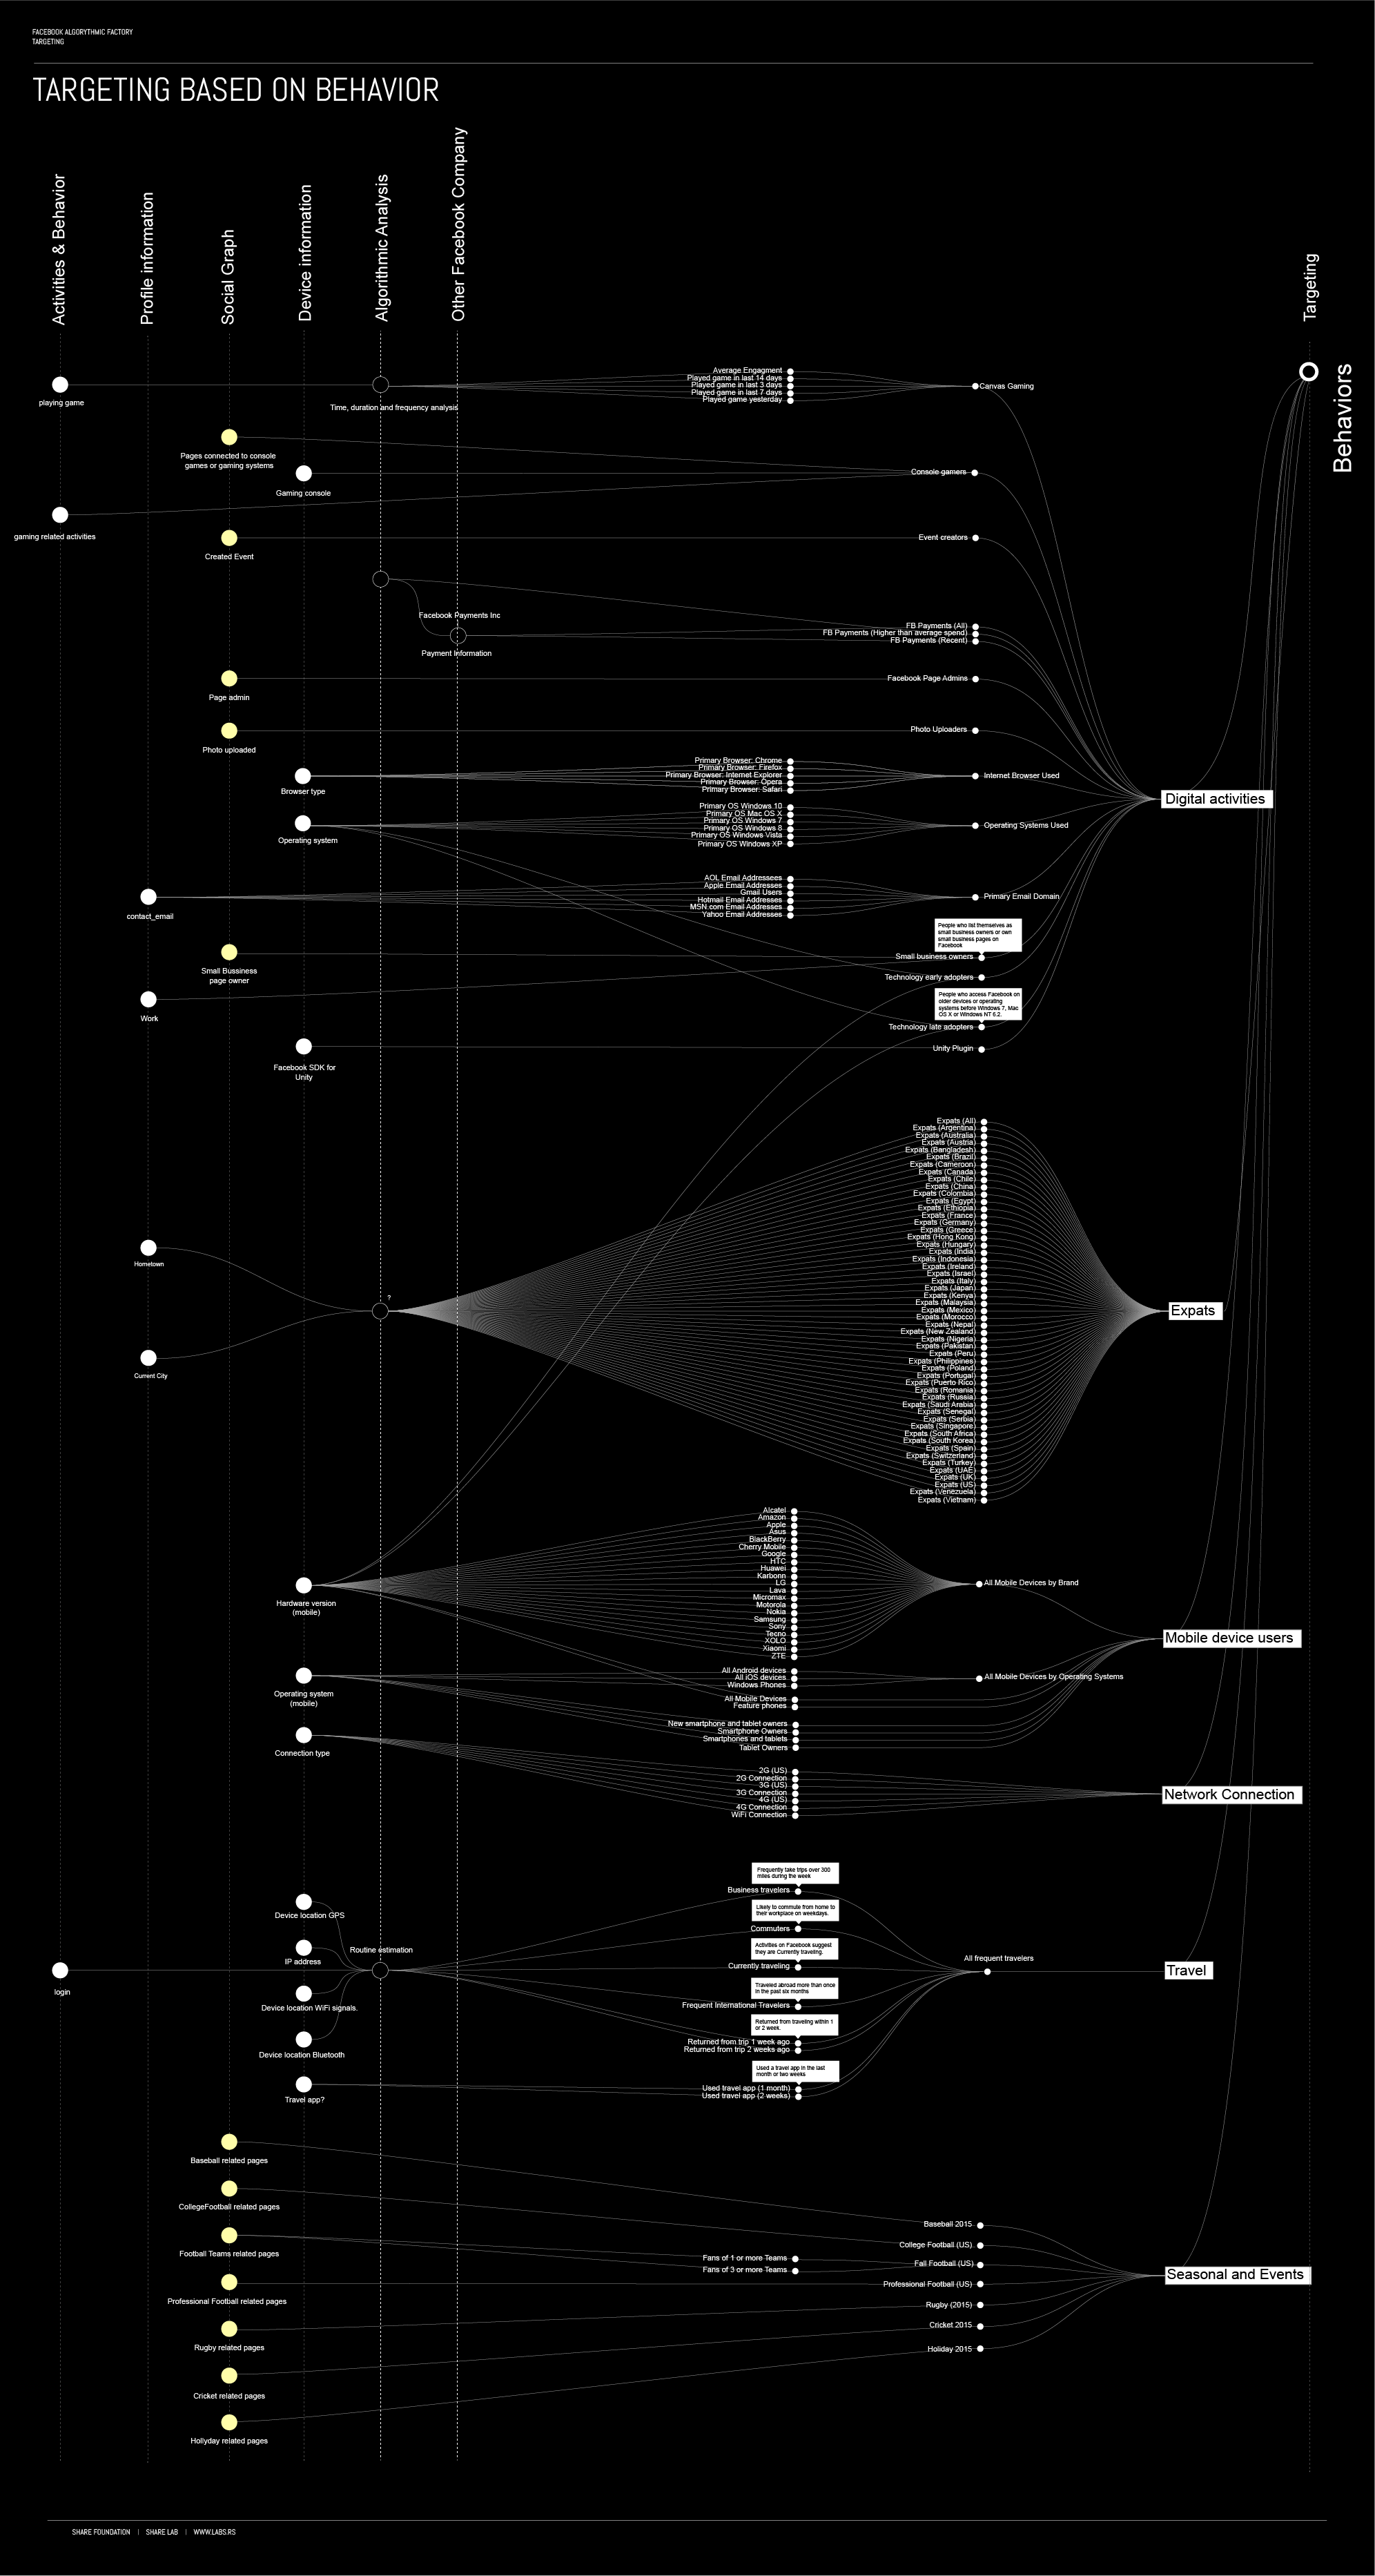
Targeting based on Behaviour is really diverse with different types data sources used for analysis.
The digital activities section is mostly based on the analysis of the digital footprint of your devices in combination with other forms of data from user actions and social graph. Facebook is tries to cluster users based on the devices or applications they use, frequency of content types that they create or time they spend playing games for example.
The most intriguing targeting option in this segment for us is – All frequent travelers section. Here Facebook offers targeting of Business and International travelers, Commuters, users who are currently traveling or users that returned from trip one or two weeks ago. It is clear that in order to perform this kind of targeting, Facebook needs to engage in location tracking of users and to analyse patterns of user behavior. Traces of how this is done can be found in patent WO 2014123982 A3 Routine estimation. This patent explain the analytic method of user geolocation data collected from devices over a period of time in hourly intervals. The algorithm analyses the repetition, or the user being at the same location at a certain hour on a certain day of the week. The algorithm then clusters these geolocations and labels them by a place. The algorithm can determine where the user lives, where they work, are they commuters or currently traveling abroad.
Another interesting segment is related to the analysis of financial transactions. In the previously explained patents: Inferring household income for users of a social networking system (US 8583471 B1) and Comparing Financial Transactions Of A Social Networking System User To Financial Transactions Of Other Users (US 20140222636 A1) we can find out how Facebook clusters users into particular income bracket. This is done through analysis of the information the user provides, i.e. Current and past work positions, current and past education institutions they have attended, life events, family relations and marriage status, user’s behaviour, websites they visit, purchases they make online. The algorithm uses different techniques including image analysis to recognise brands the user wears on photos they upload, how often they use brand names in posts and searches etc.
Outro : Cartography of Facebook Empire
Cartography, has been an integral part of the human history as an essential tool for humans, to help them define, explain, and navigate their way through the world. Most of the ancient maps, from the perspective of the GPS and satellite imagery enhanced present look like inaccurate and naive representation of the world, but they are the technological, scientific and artistic state of the art of their time. They are a clear representation of will and necessity to understand the world around us.

The Fra Mauro map, from around year 1450 by the Italian cartographer Fra Mauro. Source : Wikipedia
Our capacity to map the Facebook Empire is similar to the effort of the ancient cartographers that travelled, observed and measured distances without any sophisticated tools and technologies whatsoever. In the same manner we like to think that the map of the Facebook algorithmic Empire we presented here is similar in precision to some ancient maps of the world. But, this can be a really optimistic idea. As opposed to geographical data, that change quite slowly, the shapes of the Facebook Empire change on daily basis. New algorithms and categories are being introduced, the system is tuned regularly, new components are being added. And all of this inside of the black box.
The patents that we examined and are publicly available are from different times and the methods explained in them are probably already replaced with new ones. To make the situation even worse, the patents become publicly available two years after they have been submitted. And two years in the world of the algorithms is like centuries. This is just a small portion of the problems around the idea of the algorithmic transparency.
For 36 minutes, from 2:32 pm until 3:08 pm on May 6th, 2010, the trillion-dollar stock market crashed (a crash known as Flash Crash), which was one of the most turbulent event in the history of financial markets.Caused by black-box trading, combined with high-frequency trading, resulted in the loss and recovery of billions of dollars in a matter of minutes and seconds. Regulatory bodies and the academic community investigated this few minutes long event for years in order to understand what happened in just a few seconds of this algorithmic madness. This brings us to the question of our capacity to independently audit algorithmic processes and black boxes that shape our world.
 Source : Nanex Flash Crash Summary Report
It is not so unreasonable to believe that even inside Facebook, there is no one who really has a full map of all the algorithmic processes that are happening at this very moment. Some of those algorithms are products of the brilliant minds and expertise of the most educated experts in the field that money can buy and it is hard to believe that any independent body will ever be able to oversight those algorithms in reasonable time and budget.
On the other hand, any kind of insight, any kind of map that can even superficially draw the shape of those complex processes can be considered a significant step into better understanding the algorithmic world around us. We see the outputs of this investigation as an advocacy and educational tool that can maybe spot some potential problems and lead to future, more exact investigations.
SHARE LAB 2016
VLADAN JOLER – RESEARCH, TEXT, DATA COLLECTING AND VISUALIZATION
ANDREJ PETROVSKI – RESEARCH, TEXT AND PROOFREADING
CONTRIBUTORS : KRISTIAN LUKIC AND JAN KRASNI
]]>
According to Bulgarian theoretician Alexander Kiossev, there is something that he calls “Self-colonizing metaphor”. He used this concept for explaining cultures subordinated to the cultural power of Europe and the West without having been invaded and turned into colonies in actual fact. He named this a hegemony without domination. As it all took place beyond colonial realities—military occupation, political dominance, administrative rule, and economic exploitation—social imagination had a key role to play throughout the process. In short, it could be described as colonisation with love.
Facebook is currently a major algorithmic colonial agent that might be indeed described as COLONIZATION with love.
Frontispiece of the book Leviathan by Thomas Hobbes (1651), Source : WIKIPEDIA
Understanding Facebook in the light of Foucault’s notion of modern power, we can begin to think of Facebook as an institution in which individuals are shaped and submitted to specific structures, which turns them from human beings into “self controlling subjects fitted for democratic capitalist society” (Lyon 2006). Exploitation would be a structural category that today also affects web 2.0 users, whose time, attention, personal data, talent/skills, education/training and materials are exploited. Given the structural character of exploitation, it would still be exploitation, even if people like it (Fuchs).
According to the recent research done by Happiness Research Institute from Copenhagen, in which they ask 1095 daily Facebook users to quit Facebook for one week they’ve come to interesting conclusions. Participants aged between 16 and 76 were asked before the experiment started how satisfied they felt, how active their social life was, how easy they could concentrate and how much they compared themselves to others. After the experiment was finished, the group that had abstained reported higher level of life satisfaction, better focus, feeling less lonely and sad. So, with the general relief experienced during the Facebook “vacation”, Facebook showed parallels with general feeling of working condition, a sense of “not wasting the time”, less stressed, more sociable, better life satisfaction.
New York University professors Helen Nissenbaum and Finn Brunton claim that today, approximately 10 years after social media were introduced, “The social cost of opting out has become so high that opting out is essentially a fantasy”. They propose different tactics in undermining asymmetrical power relations between proprietary platforms like Facebook and users. The deliberate addition of ambiguous, confusing, or misleading information interferes with surveillance and data collection. Difficulties for Facebook in precise targeting would be in that sense misleading information, links leading to strange or wrong websites, putting wrong data, several accounts and profiles, etc…
Context Collapse
In his essay, Autonomy and Control in the Era of Post-Privacy media, theorist Felix Stalder analyses a historical change in the perception and the role of privacy in the West. The sphere of privacy was citizen’s domain where the state does not have the right to interfere. Citizens’ obligation was to be loyal, to obey the rules, and to financially support state affairs through various kinds of taxation. The private law protected the subject from the eyes of the government and without special court permission under the assumption of criminal act, state officials were being forbidden to enter private property. Sure, the state security apparatus was illegally interested and engaged in gathering private data, but officially it was not allowed.
Stalder claims that the sacred sphere of privacy is rapidly changing and that users are not concerned with protecting the privacy realm anymore. With the rise of social media (and especially Facebook) we are witnessing massive amounts of private data, images that users voluntarily upload.
Before social media, social life had relatively separate areas. One area was one’s family, other was the professional circle, another were friends, circle around your hobby, etc. Sometimes these spheres of social life overlap, but mostly there was clear boundary between them.
 Source: Facebook
With social media and especially with Facebook these boundaries are blurring, so now all aspects of your social life are visible to all your social spheres. In sociology there is a term to describe that, the context collapse. Zuckerberg was praising this context collapse famously saying: “You have one identity; the days of you having a different image for your work friends or your co-workers and for the people you know are probably coming to an end pretty quickly”. Indeed Mark Zuckerberg looks identical when he is publicly talking during yearly Facebook venue for example, or when he is having interview, or when talking with president Obama or having precious time with his family.
But there is a recent trend, and Zuckerberg openly raised concerns about context restoration, which is a situation where more and more users do not give and share personal content, as it was previously the case. So users grew up and especially Facebook natives (teenagers) are concerned with it, thus moving to other platforms (like Snapchat for example). This means that Facebook slowly transfer itself into the public arena in a way that users are quite aware of the Facebook Panopticon. With rapidly growing precarity, job losses and automatization, Facebook would probably be the platform for performing professional potentialities and capabilities. Facebook would become a platform for professional networks with users who would act as private persons but this face would be a professional one. (Person, a mask in old greek). This means lowering the amount of private affairs (in narrower sense), like images of children, pets, private parties, etc. The latest acquisition of LinkedIn by Microsoft for 26 billion USD shows that the future battle will be a global battle for work with all means necessary, and that Facebook, Twitter, LinkedIn, (now with huge cash boost) together with growing Uber, Airbnb, Upwork, Behance etc will be megafactories for future proletariat and unemployed.
Human component in algorithmic factory
“viewer ought to be paid for watching tv”
Jean Luc Godard
Considering the growing global socio-economic disproportions and similarly growing importance of entrepreneurial tech companies that use collaborative platform model for their businesses there is a need to look at forgotten stakeholder – the producer of content, the human. Right now the producers of Facebook content are completely outside of Facebook financial environment.
Artist Laurel Ptak’s draws on the shifting condition from Fordism to post-Fordism with her ‘Wages for Facebook’, where she substitutes the word ‘housework’ for Facebook. Launched as a website in January 2014 at wagesforfacebook.com, it was immediately graced with over 20,000 views and rapidly and internationally debated on social media, message boards and in the mainstream, left and art press—clearly touching a collective nerve and beginning a broader public conversation about worker’s rights and the very nature of labour, as well as the politics of its refusal, in our digital age.
The privilege of sharing private data would be specialised for those who are self employed and who are not directly dependent on external employers. Facebook profile is becoming enlarged CV and proper balance between private and professional content would need to be carefully managed. This would have huge impact on the possibility of employment. As a user has unique profile it is not possible to model it according to the job demand description as it is the case with traditional job application with CV. For traditional job application, applicant usually highlighted skills and experiences that would fit to the needed specific concrete job description and remove those that are not suitable. But with the concept of a unique identity, those that are highly specialised and do not have complex multifaceted carrier would benefit more than those who have more general working experience. As already is the case, the narrow specialisation is already happening.
Great Depression in the United States
The huge gap between being socially isolated (not participating in Facebook) and maintaining proper profile would become highly stressful. Freelancers, self employed, unemployed and all those grey areas in between that now constitute the world of labour would need to spend more and more hours maintaining Facebook profiles offering in(directly) their expertise, experience, success stories, opinions and documentation of their works and activities, in similar fashion like sex workers in windows of red light districts.
All of this and much more has been recently developed by Facebook. According to Armin Arvidson Facebook with its algorithms might aim at becoming a sort of universal clearinghouse that deploys the logic of the derivative to determine the value of social relations outside of advertising markets, to provide analysis of attention, reliability and risk of social relations to wide range of operators like insurance companies, mortgage banks and employers.
Financialisation of everyday life
“Facebook will market you your future before you’ve even gotten there, they’ll use predictive algorithms to figure out what’s your likely future and then try to make that even more likely. They’ll get better at programming you – they’ll reduce your spontaneity. “
Douglas Rushkoff
“Orit Halpern’s book, Beautiful Data, suggests that we live not so much in worlds of pure simulation a la Jean Baudrillard (or Philip K. Dick), but instead, in a fascinated relation with flows of signals whose referential nature does not stop them from forming a “new landscape” for the viewer/user. In other words, the data is ostensibly about the world, but it upstages that world, becoming the primary object with which we interact (and thereby impoverishing the rest of experience). Something similar is suggested by Karin Knorr Cetina with her notion of “postsocial relations” carried on with the always-unfolding temporal objects that typically appear on screens, notably in the realm of finance. The stream of flow-objects constitutes a world, one you can dive into, wrestle with, and from which – in the case of financial traders – you dream of emerging victorious.” (Brian Holmes)
 Facebook drone – Aquila
As Facebook is investing in and developing infrastructure to cover all corners of the globe there is sound possibility that Facebook algorithms will be major agent in “financialisation of everyday life (Martin, R. 2002). In this sense Facebook would embody the “social logic of derivative” (Martin, R. 2013). Facebook was recently granted a patent for authorising and authenticating a user in applications for loans, which in practice means that someone’s Facebook behaviour would influence their prospect for housing for example. To escape Facebook will eventually be more difficult, as in recent announcement of Facebook, Facebook “will use cookies, “like” buttons, and other plug-ins embedded on third party sites to track members and non-members alike”.
What algorithmic governance (especially Facebook) in this sense means for users? It would potentially create auto-disciplinary society that would focus on targeting human anomaly detection and when detected it would calculate risks and decide on individual liquidities. Needles to say, in order to avoid personal scanning for loans, insurance, etc. those who have corporations with limited liabilities or similar incorporated entities would have huge advantages over “natural persons”. Sure, it is nothing new in long histories of “legal” and “natural” persons but the case with Facebook is an example of risk management in algorithmic financial capitalism.
So, the society might split in 2 categories. “Natural persons”, non-legal persons, who need to maintain radical self-discipline in the network (and Facebook) behaviour in order to avoid to be detected as “anomaly” by algorithm and thus jeopardise their general financial prospect; and those “legal-persons” who are firewalled by incorporated entities with limited liability.
Kristian Lukic
SHARE LAB 2016
References:
Kiossev, Alexander. The Self-Colonizing Metaphor. In Atlas of Transformation, JRP Ringier, tranzit.cz, 2010.
Oosthuyzen, Michelle. The Seductive Power of Facebook. Institute of Network Cultures blog, 2012 http://networkcultures.org/unlikeus/2012/05/24/the-seductive-power-of-facebook/
Fuchs, Christian. New Marxian Times! Reflections on the 4th ICTs and Society Conference “Critique, Democracy and Philosophy in 21st Century Information Society. Towards Critical Theories of Social Media”. 2012 http://triple-c.at.dd29412.kasserver.com/index.php/tripleC/article/viewFile/411/351 ,
Brunton Finn, Nissenbaum Hellen Obfuscation: A User’s Guide for Privacy and Protest. MIT Press, 2012.
Stalder, Felix. Autonomy and Control in the Era of Post-Privacy media
in Open! Platform for Art, Culture & the Public Domain, nr.19 , 2010. http://www.onlineopen.org/beyond-privacy
Ptak Laurel. Wages for Facebook. 2014 http://wagesforfacebook.com/
Holmes Brian. In a post on Nettime. 2016
https://www.mail-archive.com/[email protected]/msg03832.html
Rushkoff Douglas. In an interview in Guardian. Author of the interview Ian Tucker. February 12th 2016.
Randy, Martin. Financialization of Dayly Life. Temple University Press, 2002.
Martin, Randy. Knowledge LTD: Toward Social Logic of the Derivative. Temple University Press. 2015
]]>

In 2015, the state owned ETECSA opened 35 public WiFi spots where Cubans can access Internet for 2 CUC (around 2 USD) per hour which amounts to approximately 10% of their average 17 USD a month income (the average income of people who work for the state, i.e. majority of the population). In theory, if regular a Cuban citizen is lucky enough to live near some of those WiFi spots and get the strange idea to be connected for a full month to the Internet, they would need to pay 1.440 CUC, or almost 50 times more than for example citizens of Bucharest in Romania are paying for 25 Mbits/s . They would need to work for approximately 6 years for a single month of not that fast, WiFi Internet access.
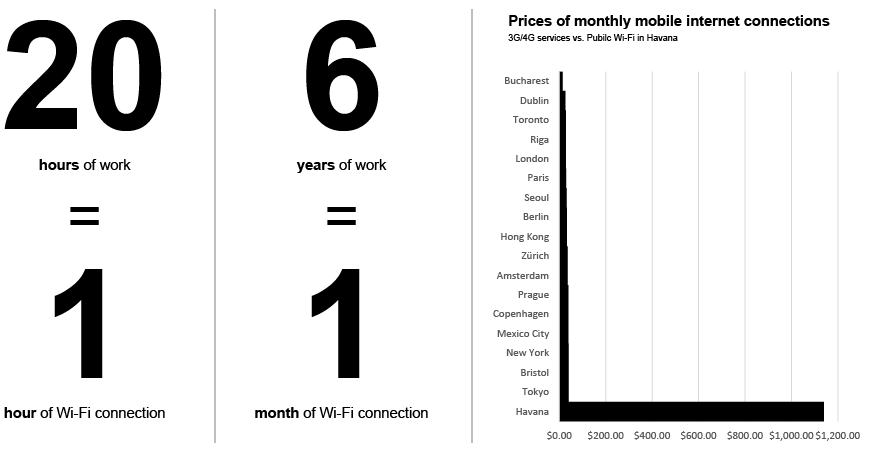
We can speculate that this is probably not an example of the best socialist practice done by a government owned monopoly in a communist country, but this is not the topic of this story.
We are interested in alternative forms of networking and content distribution, appearing at the edges of the centralised and government run infrastructures, sometimes disconnected from it and functioning as an entirely independent “service”, and sometimes exploiting any possible way to appropriate and take control over the scattered resources.
In 3 short stories we will explore how one isolated society manages to override this gap and establish alternative ways to access, distribute, share and enjoy digital content.

Screenshot from Call of Duty: Black Ops, located in Havana, Cuba ( Source : Call of Duty Wiki )
United Nano Nations
Mr.X, in his mid-twenties, is a passionate Battlefield gamer and administrator of Los Pir@t@s sub-node situated in one of the not so wealthy neighborhoods of Havana. His computer is connected to the other six houses in the neighborhood using long UTP cables, that go through holes drilled in the walls, and stretched over the roofs, backyards and nearby streets.
On the roof of the nearby building he installed a WiFi nano-station allowing other houses, outside of the 100m reach of UTP cables, to join his local network using different types of DIY or brand made WiFi devices. All of them together form one local network of around 20 connected households, empowered to share, communicate and mostly play games together.

This small neighborhood network is connected to much bigger network nodes. One kilometer to the north in the blocks of tall residential buildings in the area called Nuevo Vedado there is a much bigger network structure.

Nuevo Vedado buildings
This part of the city, characteristic for the blocks of the socialist Yugoslav style of architecture, hide one of the most dense neighborhood networks. Within the ventilation holes of the buildings, there are kilometers of UTP cables, and the roofs of those buildings are the perfect spots for the network of nano stations.

Ventilation holes of Nuevo Vedado buildings
As you can guess, this network is then connected to another huge network node. This one is at the district of Havana called Cerro, and it has more than 2000 interconnected households.
 Satellite picture of Cerro, Havana ( Source : Google Earth )
In each city district of Havana, there is a network of connected computers, servers, nano-stations and all together they are forming one huge city wide network with approximately 12.000 connected households – SNet (Street NetWork).
Stretching over almost 30km From Santa Fe on the west of the city to the edges of Alamar on the east, and 20 km from Malecon on the north to Cotorro on the south there is a hidden network of cables, nano-stations and repeaters completely independent, outside of government, state-run or private enterprise hands, that belongs to no one but to the people, end-nodes that form this impressive network structure.
Such a networks don’t exist only in Havana but in most provinces of the island. The second biggest one is in Matanzas with around 2000 connected households. The networks are not connected between each other. They exist as some kind of isolated islands of networks. Not connected to one another but also not connected to the outside world, to the Internet.
Hidden safe havens
Every piece of this huge infrastructure belongs only to its users. Every user owns their own piece of this network puzzle, the nanostation, the server or cable. There is no fee for using the bandwidth or the content within the shared folders, which are there for anyone to copy and distribute. There are no paid services and advertising is forbidden. In a world where we forgot how it is to own your own infrastructure, where everything behind the screen belongs to someone else and where we are mostly just consumers, not makers, where we are constantly being profiled, targeted and quantified – those isolated, ad-free, owned by users networks look like some kind of techno utopian safe havens. To be there, somehow reminds of the early days of the Internet. But, as usual there is another side of the medal.
Rules of the game
The existence of this network depends on the invisible, unspoken and subtle dance with the Cuban state. This network should not exist according to the Cuban “reality”. Even though, connecting computers to the network is not forbidden, importing networking equipment to Cuba is.
Since there are no local factories that produce nano stations or other networking equipment in Cuba, the existence of 30km wide independent network of 12.000 connected devices does not fit the picture. Government still has not made any move, and hopefully they will not, but it is highly unlikely that this phenomenon is unnoticed. On the other hand, within network there are strong internal policies regulating any possible discussions about politics, distribution of pornographic content or “anything that can affect the image of SNET or our country (Cuba)”. Those policies also forbid the network to be connected to the Internet and to be used for transmission of any foreign TV or radio program. SNET users know that their precious network can disappear in a day if this network start to be perceived as a ground for “counter-revolutionary” activities. So, self-censorship is deeply embedded in every end-node of this network, and sub-node and node administrators are able to block anyone who doesn’t obey the rules clearly explained in the document “General rules of SNET”.
We can discuss or criticise those internal policies from many different angles, but it is clear that they are the functional defense mechanisms allowing this network to exist in really specific Cuban circumstances. On other hand, we should be clear that the origins of this network are not in some kind of cyber-utopian-freedom-empowering dream – this network is mainly used for multiplayer gaming during the day and sharing movies and software during the night.
Homebrewed Internet
But, it is not just about multiplayer gaming and sharing. Within this network there is small universe of local websites, free services and small social networks made by the network members and visible just to them. The network has its own search engine – Look.me, a social network – Facebokito and even their own version of Ebay called Timbirichy.
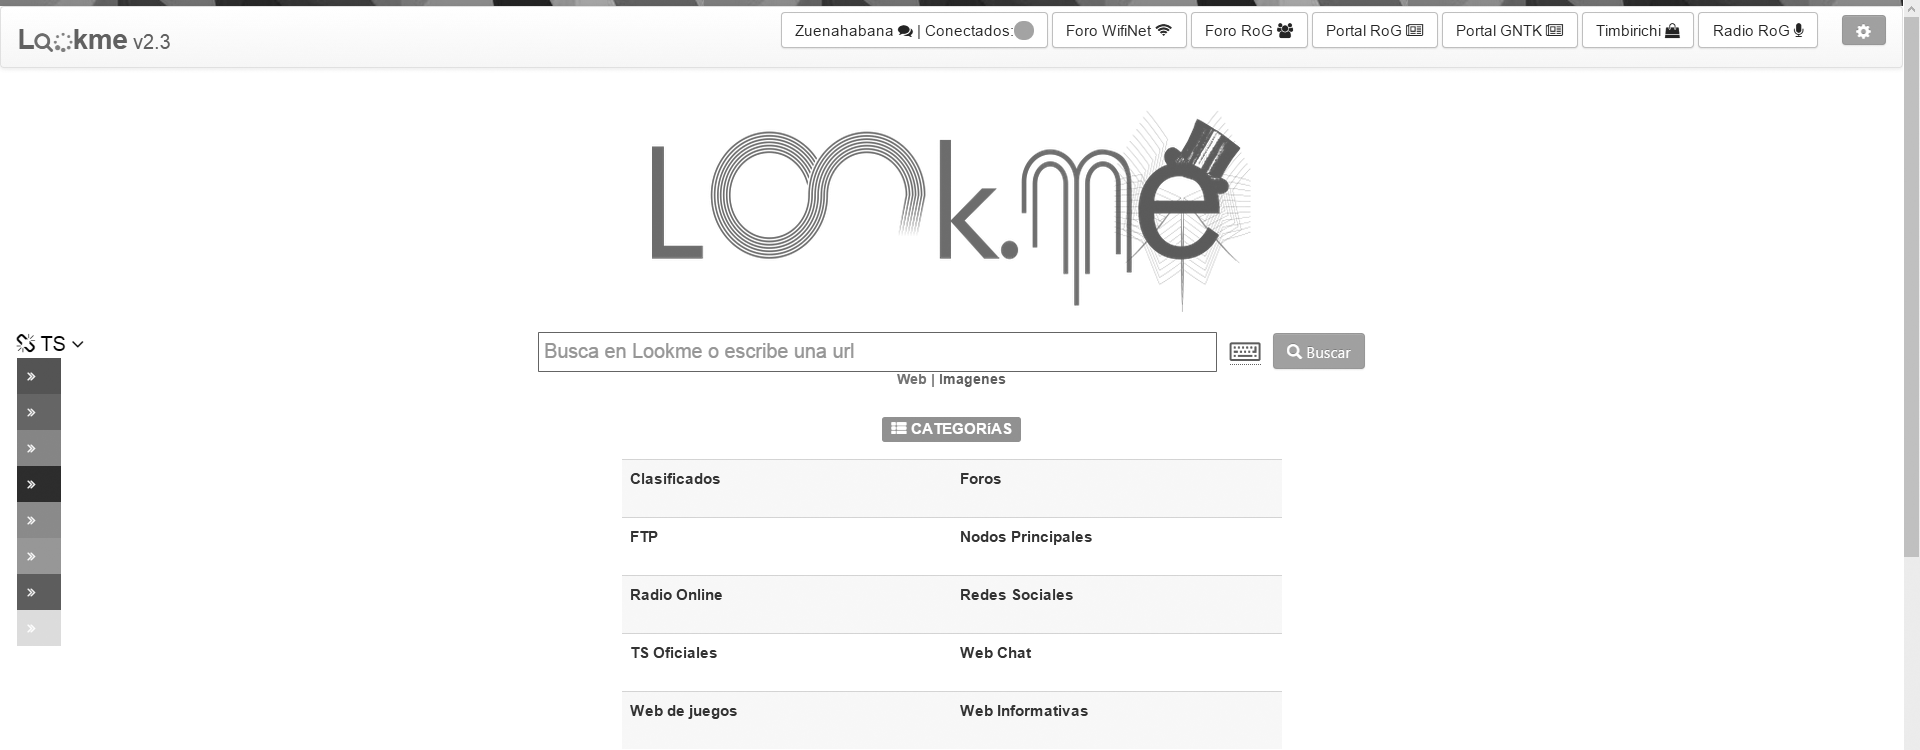
You can find “offline” version of Wikipedia or regularly updated Revolico, biggest and most important Cuban online auction and shopping website that exist primary on the “real” Internet, but that is also replicated both on SNET and on El Paquete. Most nodes, city districts have their own news sites, forums and blogs and there are numerous dedicated servers for gaming.
In this little Internet there are no domain names, just local IP addresses that are assigned to each user, probably by their own local reincarnated version of Jon Postel, when they get initiated into the SNET society and learn by heart the “General rules of SNET”.
Away From Keyboard
Sometimes, this community get together ”away from keyboard” in form of gatherings in public places. In one of the recent occasions, followed by a single post on the network message board, few thousands people gathered on Malecon, famous waterfront walkway in Havana. It was hard to explain to the police that all of those young people did not gather for a political protest, but to discuss in person about computer games and new versions of hardware.

One Paquete to rule them all
The computer in the middle of this photo, contains the content that for the next week will be one of the dominant Cuban version of the offline Internet. The thing is called El Paquete and it is 1 Terabyte of content distributed to probably hundreds of thousands Cubans across the entire island. Every Monday morning, from this little room in Havana, this package of movies, tv series and shows, magazines, webpages, software and books is distributed by a decentralised network consisted of humans, bicycles, cars from the 50s, external hard drives and USB sticks, stretched across the island.
The scale of this phenomenon is so big that El Paquete is the topic of many meetings at the Ministry of culture in Cuba and is being pictured as a treat to the mind of the Cuban citizens exposing them to foreign content. El paquete also has sort of self-censorship policy related to any political or explicit sexual content, still such an independent distribution of content, without government control and influence and economic interest is something that is probably not acceptable for a system that is not so favorable of free flow of information, in a country with extremely limited access to Internet.
El Paquete is not just a distribution network, it is also a form of unofficial economy supporting probably hundreds of families across the island. In almost every neighborhood there is a place, usually in some small room or garage where you can bring your hard drive and copy, for a price, your portion of the El Paquete. The price of a full El Paquete copy is 2 CUC (approximately equal to 2 USD). Usually those places also are legalised shops for ”pirate” DVDs, a type of small business that is allowed for Cubans to run according to the government lists of the new 181 official job types introduced in 2011.

Space and Time
During the years, the size of this ultimate source of digital content for Cubans was influenced by few factors, mostly related to the availability and price of USB sticks and external hard drives on the really unpredictable Cuban hardware black market.

Before the USB3 standard arrived, copying 1 Terabyte of data approximately took 12 hours per copy and that was the biggest limitation that El Paquete had at the very beginning, forcing them to create smaller packages, with lower video quality content. With the USB3 standard being more spread among the nodes in this distribution network, the size of El Paquete was able to grow to one Terabyte and 2-3 hours’ time needed per copy. Still, this is a considerable amount of time for every iteration; in this case we speak about exponentially growing network tree. Just as a theoretical model, if every person, i.e. node in this network was able to simultaneously create, using a USB switch and 4 attached hard drives, 4 copies of the initial package after 2 hours there would be 4 copies, after 4 hours 16 copies, and after 10 hours number of copies would grow to 1024 .
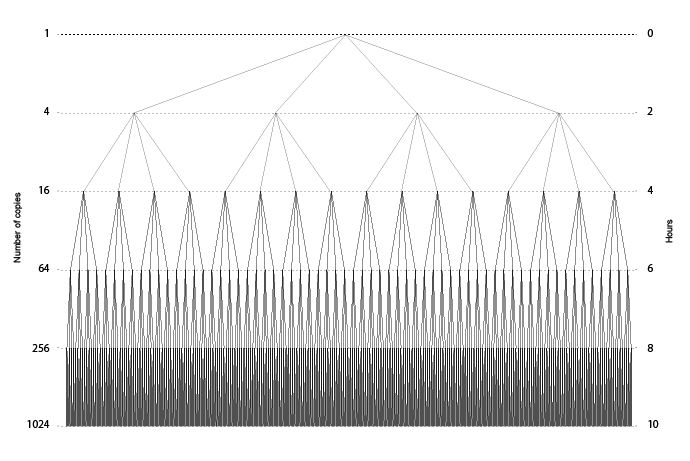
This is, of course, just a mathematical model used as an illustration of the power of such a distribution model and in reality there are many different factors influencing the real dynamics of this complex network of people, hardware and means of transportation.
Anyway, from around a 4 am on Monday, when the first bicycles start to carry the hard drives to the first distribution nodes, until the same day in the evening hundreds and hundreds of data dealers, copy centers, tech enthusiast communities in Havana have their copy of the new episode of Game of Thrones aired yesternight on HBO, updates for the software they use, or a new issue of Cosmopolitan on their hard drives. In some neighborhoods there is even some form of “on demand” service, where content, hard drive with El Paquete, can be brought to your home, so you can copy it on your hard drive.
 “DATA CENTER” IN VEDADO
From end to end of the island
The fact that this independent underground network covers the entire island from Santiago de Cuba at the far east to Pinar del Rio on the west is a remarkable aspect of this phenomenon. Whoever tried to travel from Havana to Santiago de Cuba by a 50 years old old-timer car or pimped Russian Lada on the one and only Cuban “highway” built in the 50s that suddenly ends halfway through – knows that this is an adventure of a sort. Still, hard disks with El Paquete travel in various directions from town to town, reaching hundreds of neighborhoods on weekly basis. This unique Cuban “human-electronic highway” has quite a lagging time. If the citizens of Havana enjoy the latest episode of their favourite dorama (South Korean telenovela) every Monday, the citizens of Santiago de Cuba, around 800km east from Havana, will be able to do that on Wednesday, 2 days later. According to that we can estimate that the speed of this hand to hand, drive to drive, computer to computer network is approximately 16.6 km/h.
Power of Node, economy, and changing structure of the El Paquete
All Nodes are equal, except some of them are higher in hierarchy than others. The structure of this network has its own vertical hierarchy. Everything starts from one point and then grows in different branches until this human-transportation-hardware-information network covers the entire island. But, the creators of the initial package have a reason not to feel as if they own it. Every branch or cell in this content distribution ecosystem, is free to add and remove content and the creators of the initial packet or any other node on the way don’t have any control what happens after them.
The nodes that are higher, or we can say closer to the center of distribution chain, that have a lot of distributions beneath them can try to develop their own micro-economies within their branches and try to for example develop their own advertising deals to it. At the end, private, local based micro business around Cuba rarely have the capacity to sell their products or services on national level, so it makes perfect sense to advertise just inside the El Paquete on the level of a city or even of a single neighborhood.
Another interesting point is that because of the time that is needed for each copy of El Paquete (approximately 2 hours per copy), no one is basically in position to earn much more than others. Time in this sense is a factor that somehow creates equality in this system. As one of the owners of the little center, with a collection of 50 TB of pirated games in Vedado noticed, El Paquete is there on Monday morning for everyone. What will you do with it is your choice, you can try to make something out of it until next Monday, you can develop your little economy just on one segment of it (games or software for example), or you can do nothing. Everyone has the same, equal opportunity for the same price.

An interesting detail is that the price of El Paquete is changing depending on day of the week. On Mondays just after it is released the price is highest (2 CUC), and until the end of the week, after it has been copied numerous times the price drops down (1 CUC).
Economy within a packet
There are different forms of advertising and services that have emerged within this system during the years.
If you send an SMS to a certain number, the content of the message will appear in the El Paquete folder “classifieds” in form of a jpeg image that has your massage on one half and some advertisement on the other half. But there are as well interesting forms of the parasitic advertisement embedded directly into the content. For example, local video advertisements attached to the end of a trailer for some Hollywood blockbuster movie, or visual ad for some local photographer specialized for anniversary photos of 15 years old girls, inserted between pages of the digital version of the latest Cosmopolitan magazine.

Life and death of the El Paquete
El Paquete has a quite ephemeral existence. There is a small chance that someone on the island has a full archive of the previous editions of the package. Even the makers of the El Paquete don’t keep previous versions, simply because the cost of the hard drives are too high for an average Cuban to keep those files. It is similar to common TV, or Video on demand. In a period of one week those files are sliding from scarcity to abundance and finally most of them are being deleted at the end of the week to be replaced with new ones. Some of the files continue to exist, the digital content dealers or collectors of for example games or movies, keep the most popular movies, tv shows,or games and resell it with a price tag per episode or full film.
Feedback mechanism
As every proper cybernetic system, this one has a feedback imbedded as a one of the important parts of it. End distribution nodes can send emails to El Paquete and suggest content that end users have requested. According to the inputs, the content changes, new tv series, collections or type of movies are added and El Paquete evolves according to the needs and inputs of its users. According to one of the El Paquete makers, the amount of emails they receive is huge and they are not able to respond to all the requests, but still this interaction represent an important segment of this complex distribution system.
Origins of Cuban shearing culture
The young adults that create and curate El Paquete are in their late 20s, a generation that transitioned through different forms of content distribution periods on the island. From the VHS banks at the end of the 90s to offline peer to peer exchanges of content on internal hard drives in the early 2000s . Disconnecting your internal hard drive and going to your friend to copy his collection, was the most common content distribution practice in the last 10 years before El Paquete and external USB hard drives appeared. Content was scatter and you relied just on your friends’ taste and ability of storing content. Internet was even more inaccessible back then, just few universities and institutions had the privilege to access a really slow Internet. Content came mostly from University networks administrators that were downloading online content during the night and spreading it very fast in the next few days. The content was curated and chosen by this privileged individuals with access and was mainly movies, series and manga cartoons categorised by genres, there was no attempt or interest in getting bad TV content or tv novellas, the public was young and the demands were different.
Content of El Paquete
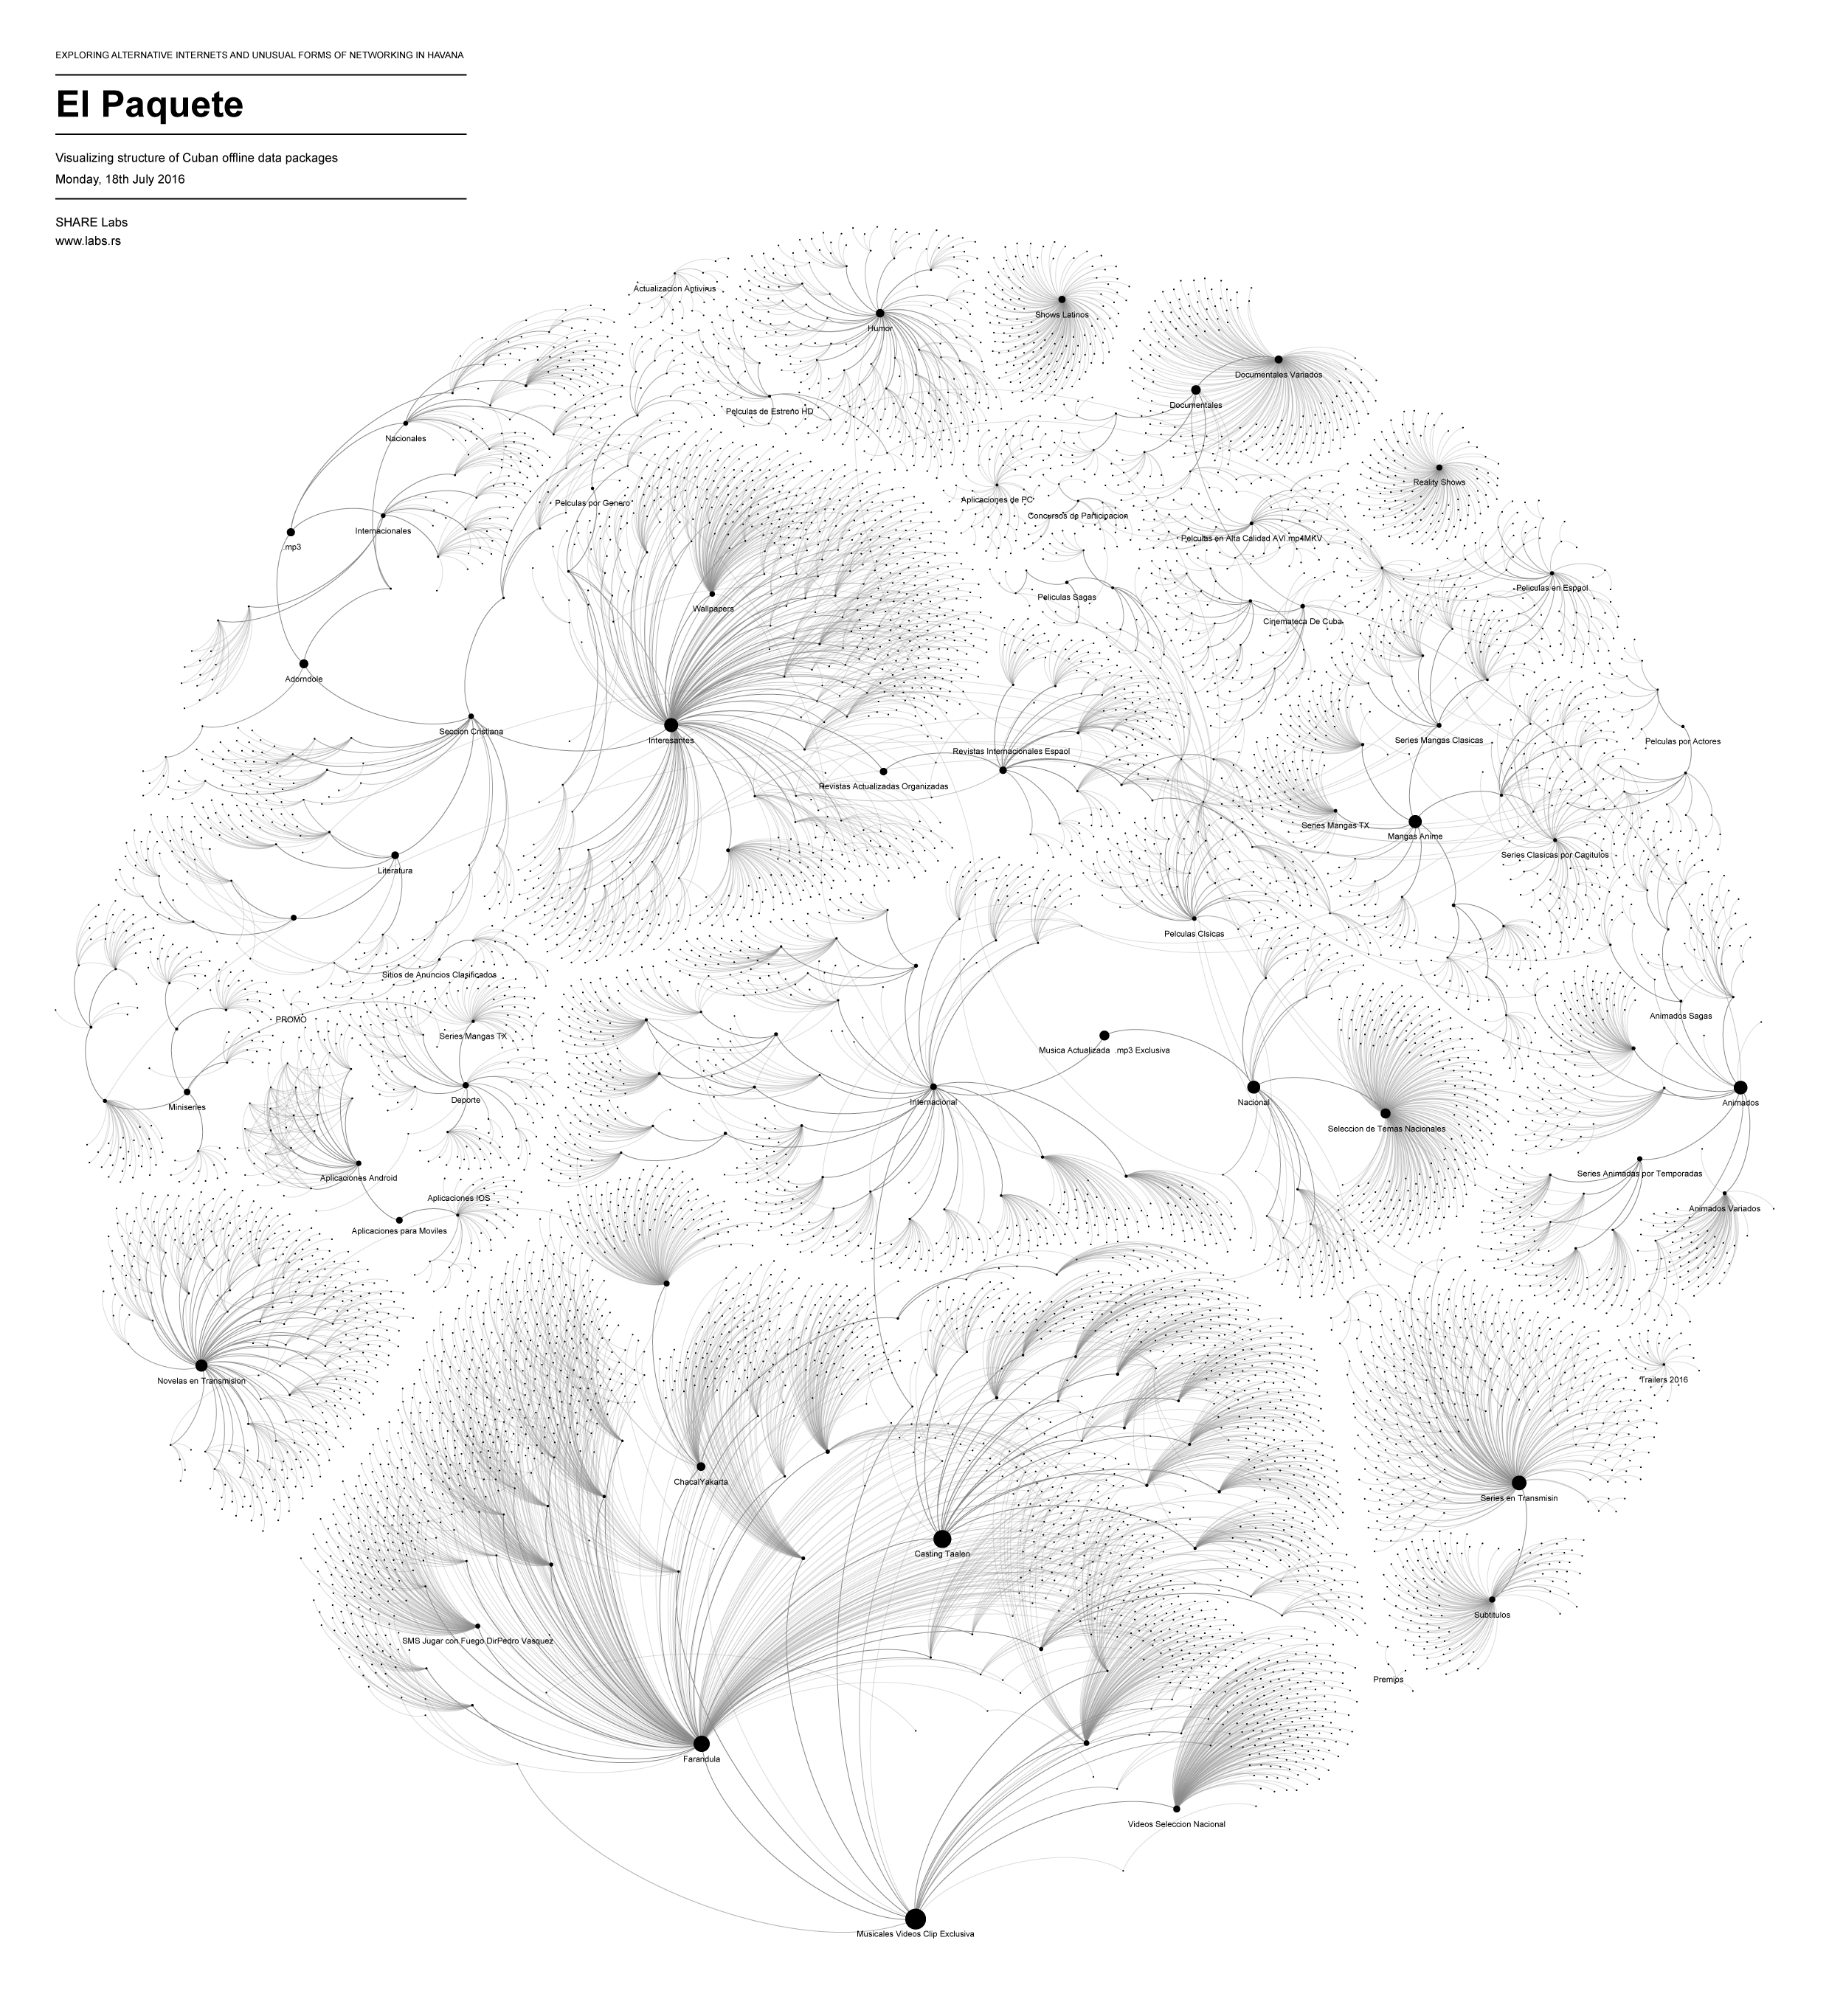
Internet dealers : Hot, slow and dark spots of Havana
If you are walking on the streets of Havana and see a group of people standing in the corner and staring at their smartphones, you probably bumped on some of the 35 famous WiFi hotspots established by the government run ETECSA, the one and only telecommunication company in the country.

Official Wi-Fi hotspot at Fe del Valle in Centro Havana.
Some of the official WiFi places, mostly in public parks around the center of Havana are massive open air cyber party zones. Sometimes there are hundreds of people with their laptop computers and mobile phones trying to send email, check their Facebook account or try to use some VoIP services.

Official ETECSA “telecommunication agent”
In order to use those WiFi spots, an official “telecommunication agent”, that you can find in your neighborhood behind an improvised open air reception desk, needs to register your account, with your real name and ID. Then you can buy WiFi credit, 1 hour for 2 CUCs, that is approximately 10% of the Cuban average monthly salary.
Around most of those official WiFi spots, there are numerous invisible, parasitic infrastructures attached to it exploiting this resource in many creative ways.
As you approach the WiFi zone, you will probably be offered cheaper internet access by some not so official “telecommunication agent”. If you are not directly approached by them you should search for the person who owns the device that creates the pirate hot spot. Sometimes the SSID itself can help you with that. Names of the WiFi networks can be “guywiththegreenshirt” or ”guyunderthetree” for example.
 On the edges of the official WiFi zones
For one CUC (approximately 1 USD) he will enter the WiFi password in your mobile phone and you will be ready to surf on the most painfully slow internet.
 Nanostation ”in the box” behind trash can
Pirate pop-up WiFi zones
But sometimes those pirate WiFi zones appear on the places way out of the official WiFi zones. We bumped into one near to Malecon in Centro Habana.
 Buying Internet access from unofficial “agent of communication”
In matter of minutes this guy was surrounded by few dozens of people, surfing on a hotspot and earning few Cuban average monthly salaries in one hour.
 Unofficial popup hotspot
Those unofficial popup hotspots are some kind of ephemeral street cyber cafes, places for meetings and socialising for the community where people have not only established Internet connection but meet and exchange files and content between each other, locally. There are many invisible activities happening between their devices, without accessing the Internet. To enter this local, off the net, communication they use a Chinese made application Zapya, that allows users to exchange files and have a group chat locally without WiFi connection. Sometimes people do just that, go there, chat with people, exchange files for free and don’t use Internet connection at all. It is important to add that mobile phones, which have been restricted to Cubans working for foreign companies and government officials, were legalised just 8 years ago in 2008.
Parasite networks
The risk that the person who sells the connection takes, is that someone else, buys Internet access from him for 1 CUC and then share, re-sell the same connection to other people with his own hotspot for the same or lower price. This is exactly what the first guy does to someone else after all. The guy is probably using his own do-it-yourself infrastructure made of nano stations and repeaters to aim and connect to some hotel or official WiFi zone where he pays 2 CUCs for an hour, pretending to be a regular user. Then he shares this connection with for example 20 people at his street corner with high probability that he will probably be misused by someone else in the same way on the next corner. It’s a form of parasite fractal network, networks within networks, defragmenting into little pieces until the last byte of connection is sucked and the last possible peso is charged from someone.
Share Lab, Havana 2016
]]>
Most of those traces are hidden in metadata, i.e. tiny pieces of information stored in IP packets, headers of your emails or files that you are creating.
There is an ongoing debate over the significance of metadata. We wanted to question а somewhat heretical argument that bulk metadata contain sensitive information about private life of internet users and confront it with a ruling opinion that such statement is overrated. We have therefore undertaken the following social and scientific experiment using different methodologies. The purpose of this research is to investigate and consequently inform the scientific and popular audience about the real importance of metadata for our privacy.
In our previous research we explained how metadata is being collected and accessed by numerous actors – government agencies, Internet service providers, Internet companies such as Google or Facebook, data dealers or producers of mobile phone applications. We explained the invisible infrastructure behind data flow, but we never had a chance to investigate what these actors can really do when they have access to a vast amount of metadata about you. This data investigation is exactly about that.
This story is about the power of Metadata.
Our little “Big Data”
In the next few days Wikileaks and Transparency Toolkit published a searchable database of Hacking Team’s emails revealing details of their operation, contacts and communication with government agencies, companies and individuals around the globe as well as the functionalities of their cyber surveillance weapons.
Hacking Team designed a modular, multifunctional and cross platform surveillance solution, RCS (Remote Control System). The solution gives the operator a full and uninterrupted access to and control over the infected device, the privileges of the operator of the software are limitless, they can send email or SMS and make phone calls, listen in on the user’s phone calls and read encrypted communication. The access is not limited exclusively to the software, the operator can also manipulate with the hardware on the infected device, i.e. activate the microphone or the camera and record audio and video or take photos. The software is designed in such a manner that its operation goes undetected by any anti-malware or anti-spyware scanner, its traffic is well blended in with the user’s legitimate Internet traffic.
We were given this pile of data and soon we REALISED there was another gem hidden in it. We were able to extract a substantial amount of metadata – headers from hundreds of thousands emails from their database. We got our own little portion of Big data and that is where our research began.
Do It Yourself Metadata Investigation
The concept behind data-mining and analysis operation performed by the government agencies around the world is that metadata can be analysed to reveal connections between people, and these links can generate significant investigative leads.
This is not exclusively done by government agencies, our metadata is constantly collected and examined by major Internet companies such as Google and Facebook, but for the purpose of profiling of users and transforming our behavior into profit, which reaches tens of billions US dollars per annum.
Thanks to Edward Snowden’s revelations in June 2013 we got insight into the NSA Stellar Wind, Boundless Informant, PRISM and XKeyscore programs. One of the scopes of those programs was collecting and analysing large amount of email metadata. Analysis involve operations such as contact chaining, building a network graph that models the communication (e-mail, telephony, etc.) patterns of targeted entities (people, organisations, etc) and their associates from the communications sent or received by the targets.
NSA IG-DRAFT REPORT
“Metadata is extraordinarily intrusive. As an analyst, I would prefer to be looking at metadata than looking at content, because it’s quicker and easier, and it doesn’t lie.”
Edward Snowden
Edward Snowden
In some kind of reverse engineering process we explored the possibility of using their own methodology for an independent data investigation of the Hacking Team, one of the “CORPORATE ENEMIES OF THE INTERNET”.
Investigation process
Email Metadata : Building blocks for our investigation
Let’s begin with a short explanation of our little treasure – email headers. Every email consists of three components: the envelope, the header, and the body of the message. The envelope is a part of the internal process by which an email is routed, the body is the actual content of the message and the header, the third component of an email, is the point of interest of our research.
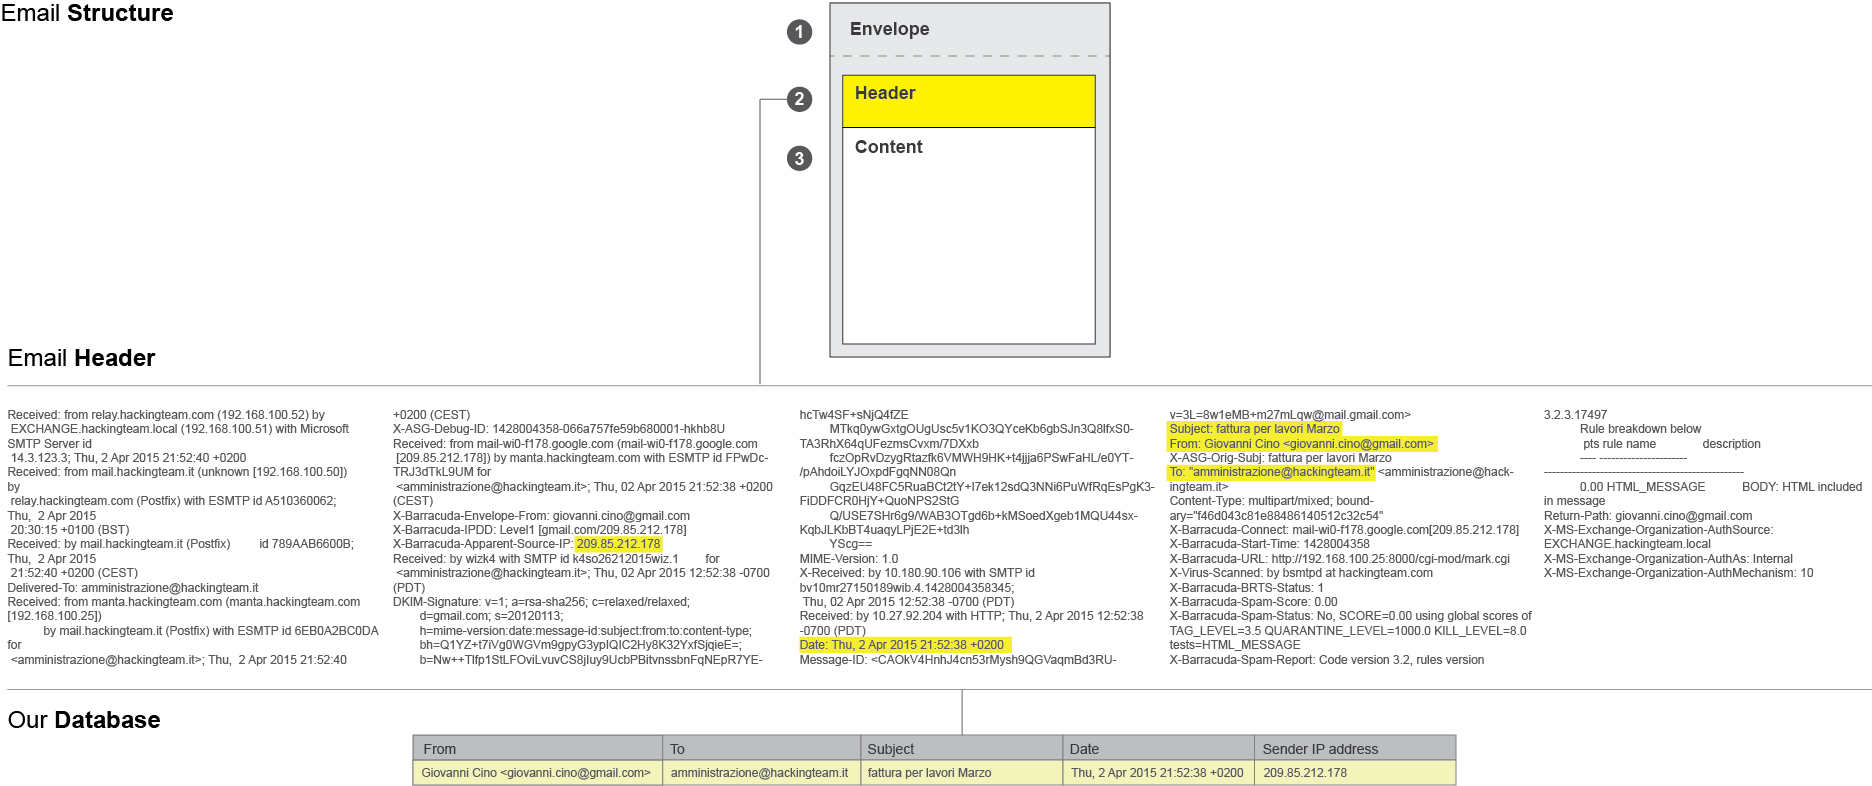
Headers identify particular routing information of the message, including the sender, recipient, date and subject, sending and receiving time stamps. In some cases email headers also contain the IP address of the sender and information on the route an email takes as it is transferred from one computer to another.
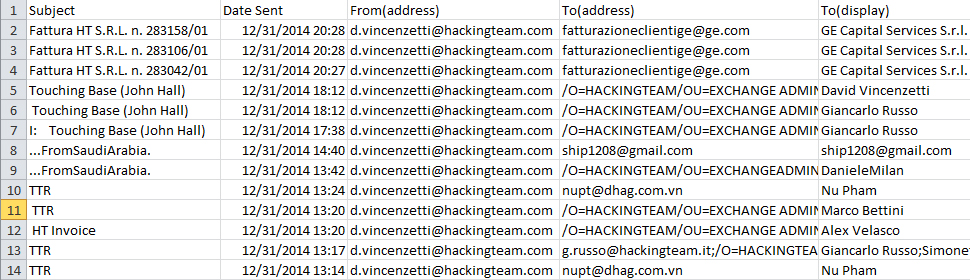 Tools : Export from MS Outlook Code Two Outlook Export > Data processing MS Excel
After extracting data from around 60 accounts and hundreds of thousands emails of Hacking Team employees, we got a database we could work with.
Needles in a haystack
The first step we took in exploring this pile of data was to perform a Social Network Analysis, a strategy for investigating social structures based on network and graph theories. It characterises networked structures in terms of nodes (individual actors, people) and ties or edges (relationships or interactions) that connect them. In our case, the network graph represents an analysis of all email headers exchanged between Hacking Team employees and their contacts between 2012 and 2015. Even at this very begining of the investigation we were able to detect the main internal and external actors and ties, more precisely by the amount of exchanged emails between them.
By selecting the individual nodes, we are able to explore their individual social ties and contacts.
Social network Analysis of hacking team email database ( period 2013-2015 )
Tools : Social Network analysis with Gephy exported with Sigma.js by Oxford Internet Institute
By filtering out the nodes with less than a 100 exchanged emails, we isolate the internal Hacking Team communication and get a closer look at their internal structure based solely on it.
Social network analysis of nodes with +100 exchanged emails
TOOLS : SOCIAL NETWORK ANALYSIS WITH GEPHY EXPORTED WITH SIGMA.JS BY OXFORD INTERNET INSTITUTE
Giving that this was somewhat a learning process of our own, while exploring the metadata we came to notice that our understanding of data and leads we got from it highly depended on the type of visualisation we applied to the data set. Sometimes ties between different actors were more successfully, more clearly revealed by using different visualisations. Like in this example, where we see the same data set as the one presented above, but this time in the form of a heat map.
Heat-map of internal communication
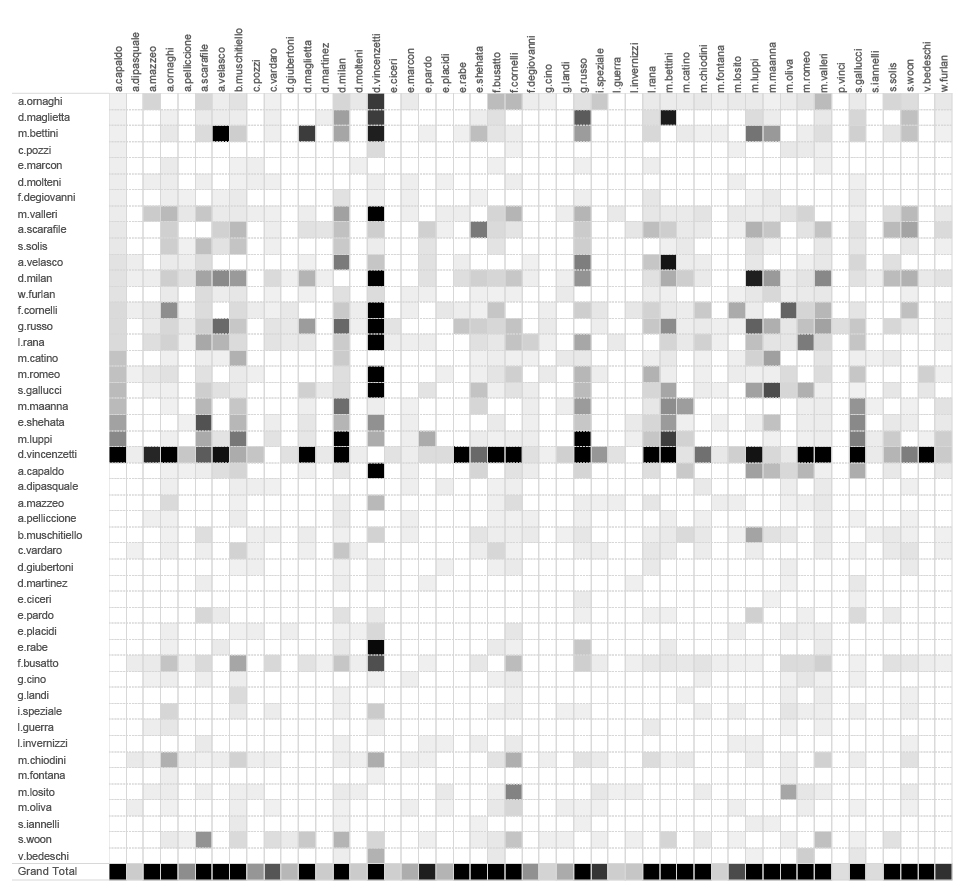
By spotting the darker squares we can explore individual ties between different employees within organisation. D. Vincenzetti is clearly the main actor in this graph, but we can also notice a few other strong relations across this heatmap, that can help us get a better insight into their organisational structure.
Finally, using the insights from both visualisation methods, we are able to shape a communication chart that might represent a credible representation of the organisational structure. It probably doesn’t display relations that are in accordance with what is written on their business cards, but on the other hand it probably represents real relations between people within the organisation better.
Potential organisational structure based on the level and direction of communication
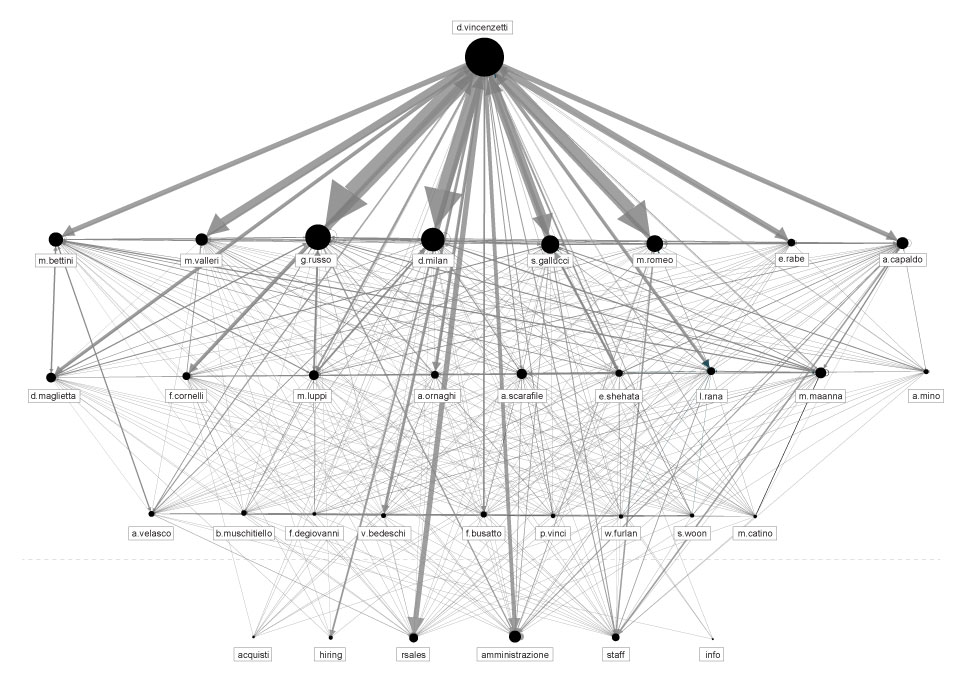
Setting aside the organisational structure, if we were to add another interesting piece of information retrieved from metadata – the time component, we would be able to track the activity of every individual employee in time, based on the number of sent messages from each one of them. Having done this, we created the following activity chart. With this kind of analysis you could, for example, speculate or determine which part of the year is the busiest for the organisation or, combined with other information inputs, when certain employees went on vacation or took a leave of absence.
Number of sent emails per HT employee in time (2014)
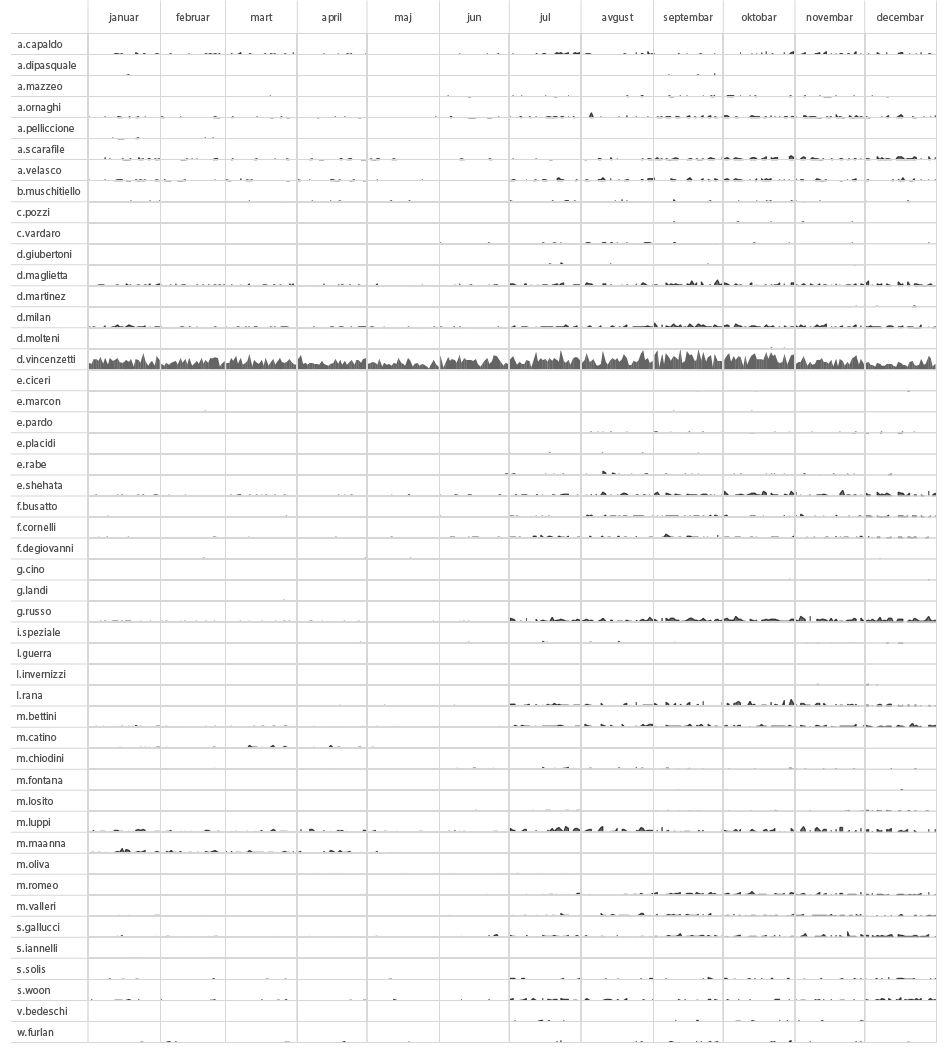
Exploring External Contacts
Even more interesting, or relevant for investigative data journalism and our effort to understand the nature of the organisation that we are investigating, are probably the external contacts.
In our set of data that means around 4600 different individuals that exchanged emails with Hacking Team employees in the course of 2 years.
If we exclude all the @hackingteam.com adresses and rank results by the number of records we are going straight to the point. This is the list of Hacking Team contacts with more than 50 emails exchanged.
External contacts with more than 50 emails exchanged with HT Employees ( 2014-2015 )
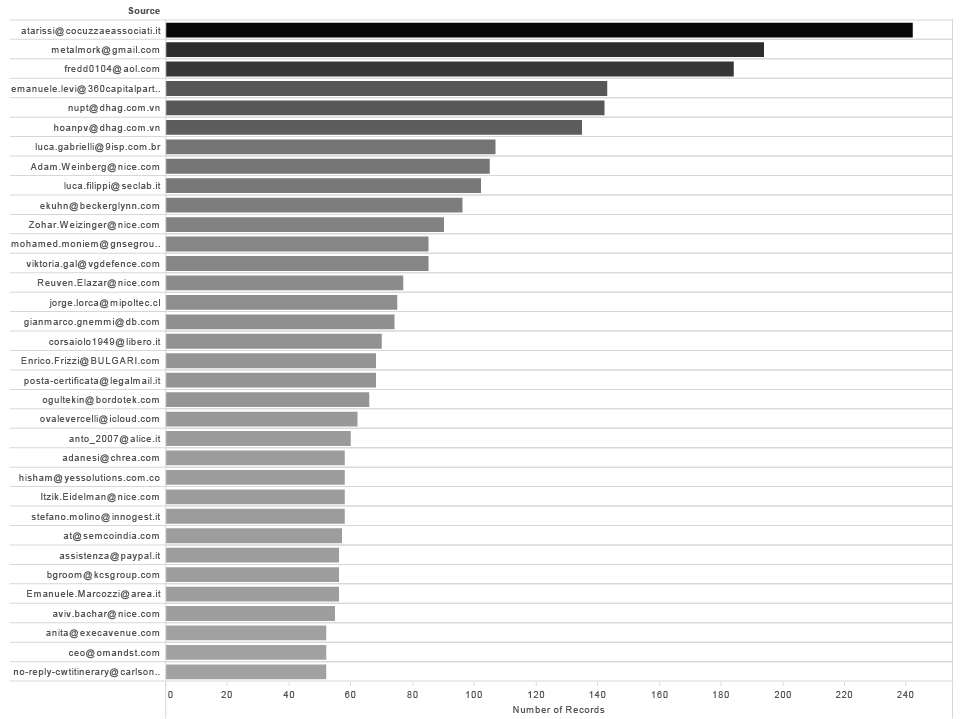
If we add the Hacking Team employees on the other axis, we will get information who in the team communicated with external contacts and how frequent and strong the communication was.
Number of emails exchanged (>30) between HT employees and external contacts ( 2014-2015 )
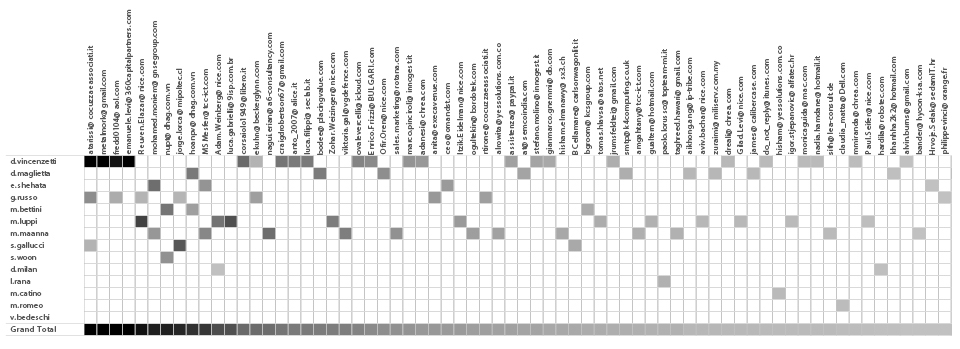
Additionally, if we add the time component, we have a complete overview of who communicated with whom and when.
Timeline of individual communication of external contacts and ht employees ( 2014-2015 )
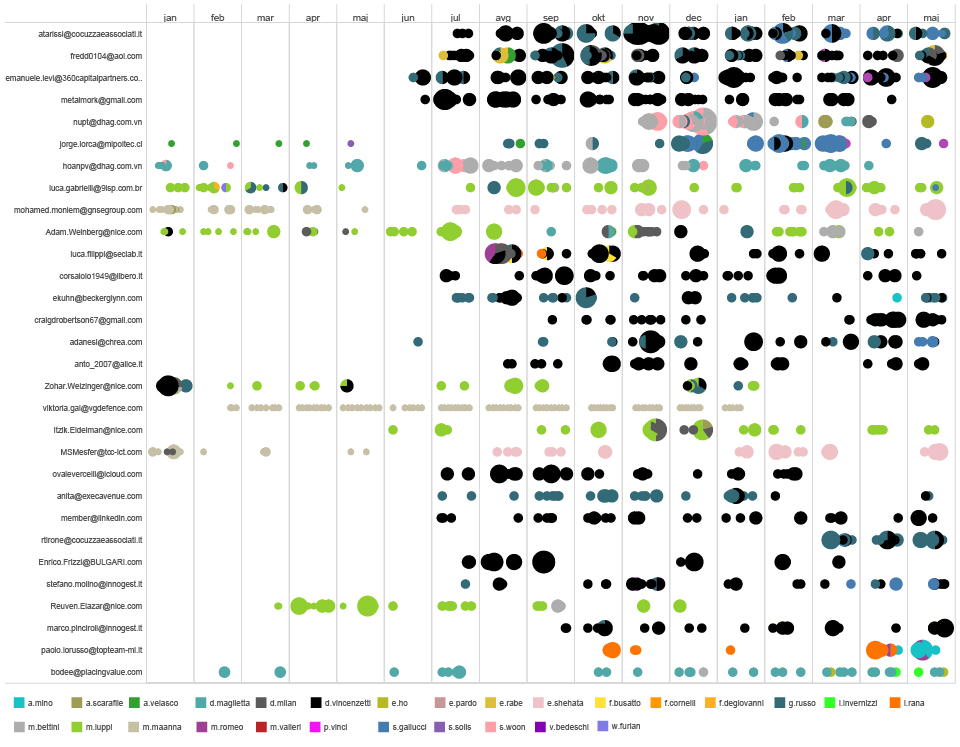
We grouped the emails by domain, and after some research about the companies behind the domain names, we classified them by the type of service they officially provide.
external contacts grouped by the domain name based on the d.vincenzetti emails
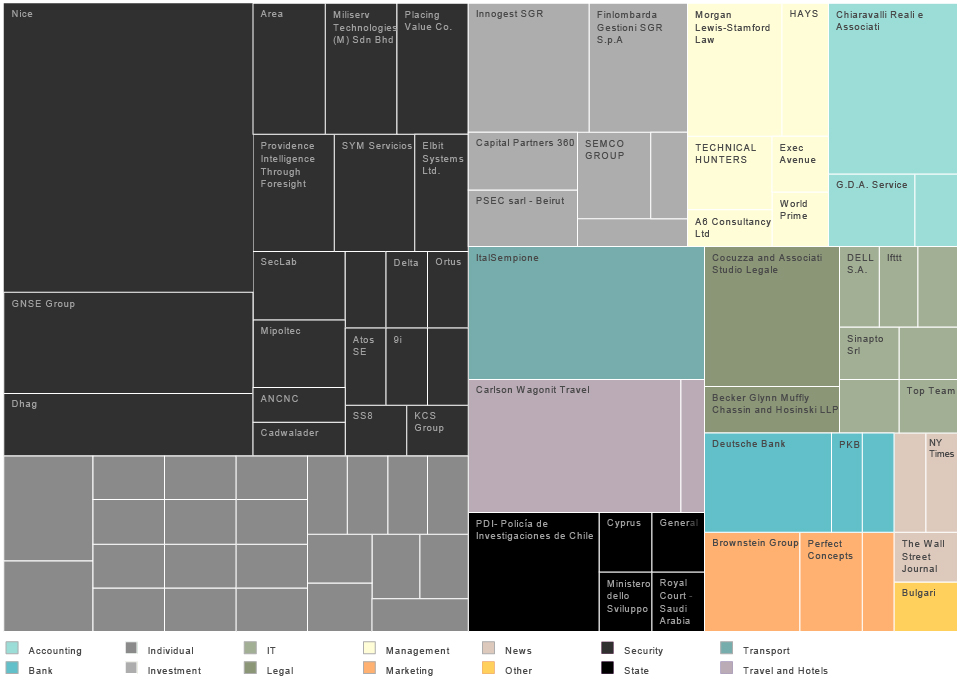
According to this treemap the biggest group of organisations collaborating with HT are from the “digital security” sector, followed by individual contacts, i.e. “consultants” and venture capital companies.
We can explore the relation between selected companies and Hacking Team in time.
Timeline of selected companies email communication with ht employees (2014)
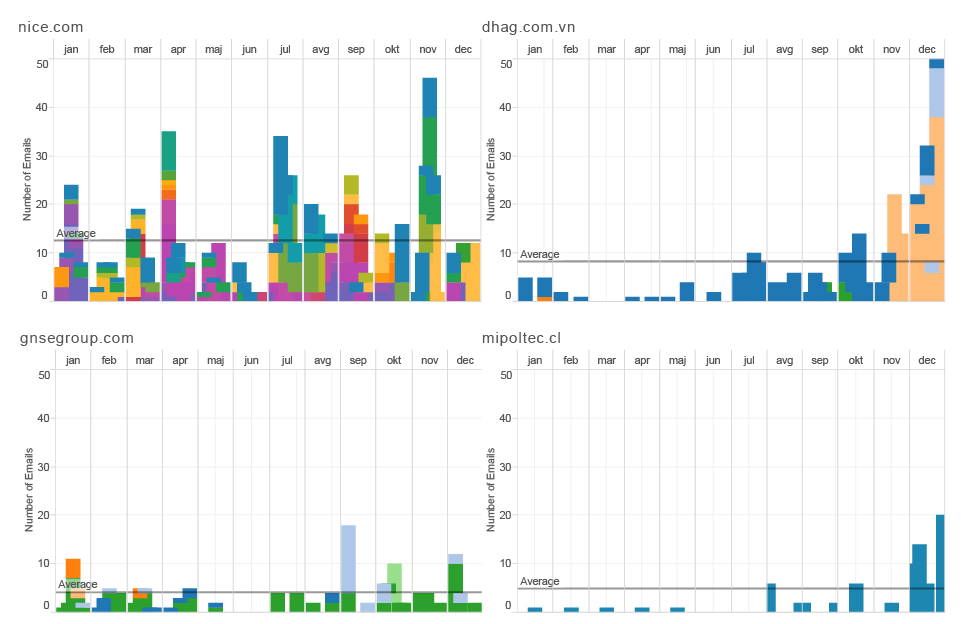
According to their official STATEMENT “NICE solutions empower organisations to capture, analyse, and apply, in real time, insights from both structured and unstructured Big Data. This data comes from multiple sources, including phone calls, mobile apps, emails, chat, social media, video, and transactions. NICE solutions are used by over 25,000 organisations in more than 150 countries, including over 80 of the Fortune 100 companies”. Looking at the data we analysed we can probably conclude that the same expertise and tools for collecting data and analysis is shared and being sold on different markets and to different target groups, Hacking Team for government agencies and Nice Solutions for companies and law enforcement agencies.
Pattern of life
Humans are amazing pattern-recognition machines. We are constantly analysing complex sets of inputs, and making decisions based on facts we previously encountered or learned. But in recent years, we are not the only ones who analyse patterns around us, we are becoming more and more the object of analysis, mostly performed by machines and algorithms.
The unique way we interact with the technology we use, the unique set of contacts we have or our unique behavioral patterns define our metadata signature, our fingerprint. In the eyes of the algorithmic analysis every single person is unique.
Pattern-of-life analysis is a method of surveillance specifically used for documenting or understanding subject’s habits. It is a computerised data collection and analysis method used to establish the subject’s past behavior, determine its current behavior, and predict its future behavior. This form of analysis is generally done without your consent, and it’s applied not just in the security field, but it is a core activity and business model of many of the biggest Internet companies. More commonly, pattern of life analysis is called profiling. Inputs for this analysis are in most of the cases our metadata collected from emails, IP traffic or data from mobile phones and other technology we use.
Even though we are just limited to email metadata in our research , we will try to perform pattern of life analysis on one key figure from Hacking Team and try to see what we can get.
According to the previous phases of our metadata investigation, an obvious choice of a node (person) with the biggest amount of internal and external contacts and communication is [email protected]. We will call him Mr.D.
We are trying to understand 3 main things here:
What is the behavioural pattern of Mr.D ?
What are the anomalies in this pattern?
How different the behavioural pattern of Mr.D is in comparison to his social/professional circle?
pattern RECOGNITION : sum of Mr.d sent and received emails per hour during the day (2014)
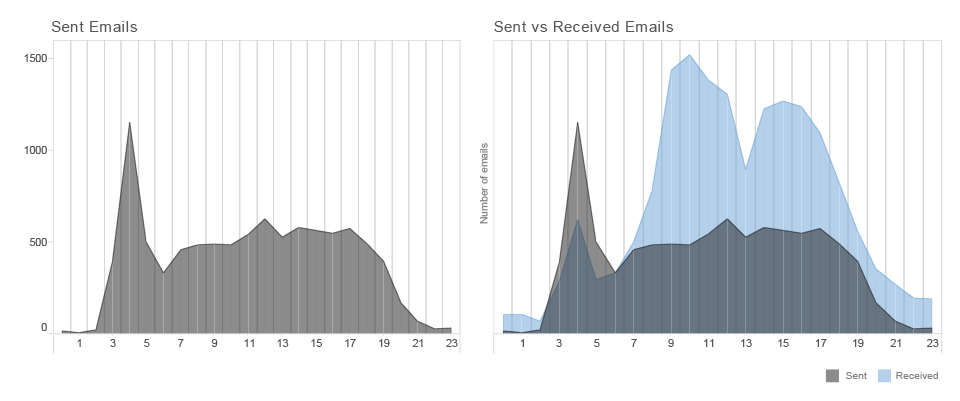
Sent emails represent the behaviour of the person that we are examining and received emails represent the overall behavioural pattern of his social or professional environment.
Mr.D is not the same as other people.
He starts his activities quite early in the morning. Almost every day around 4 a.m. is his time of concentration, the moment when he sends the biggest amount of emails during the day. If we are comparing the number of sent and received emails we can see that Mr.D has different habits than most of his contacts. His social and professional circles are most productive around 10 a.m., most of them have a lunch break around 1 p.m. and their productivity rapidly declines from 4 p.m. On the other hand, Mr.D doesn’t have a big swings of productivity during the day. His peak during working hours is at noon. It looks like he doesn’t have a regular lunch break and when his co-workers and external contacts start to lose concentration in the afternoon, he has another peak of activity around 5 p.m.. Additionally, Mr. D seldom sends any emails after 8 p.m.
PATTERN RECOGNITION : SUM OF MR.D SENT AND RECEIVED EMAILS PER week days and months (2014)
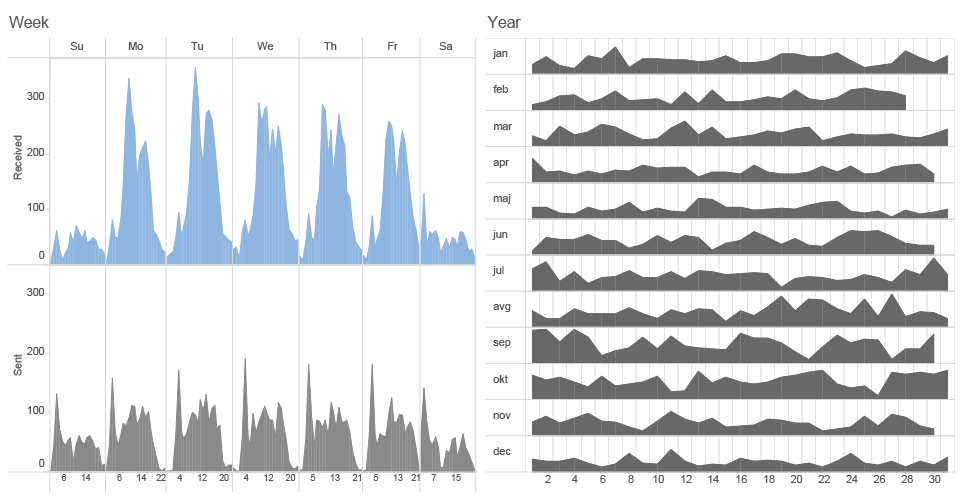
If we are analysing Mr.D’s behavioral patterns on a week’s scale we can find out that he is even working much more than his professional circles during the weekend as well. It looks like his only time out of emails is every saturday during lunch time around noon.
That is Mr.D’s average behavior, but what is even more important to our analysis are the anomalies in his behavior. Anomalies can point to many things. People are changing their behaviour when depressed, sick, working under pressure, when there are some deadlines or important events, when they are traveling or when they fall in love, for example.
ANOMALY detection : number of MR.D sent emails per hour (2014)
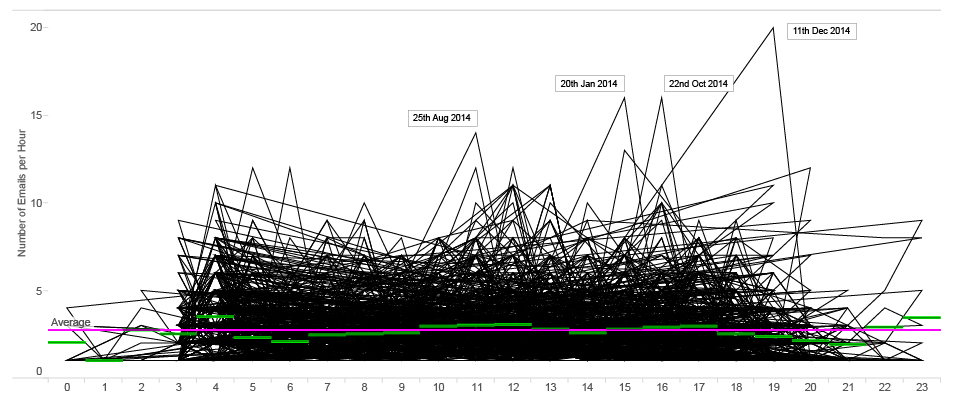
On this graph we can see some spikes that represent anomalies in Mr.D’s productivity.
For example, on the 11th of December at 7 p.m., he sent 19 emails during one hour compared to average 2.7 emails that he usually sends.
The following heatmap is probably most effective for spotting anomalies.
pattern RECOGNITION and ANOMALY DETECTION : heat-map of mr.d sent emails per hour (2014)
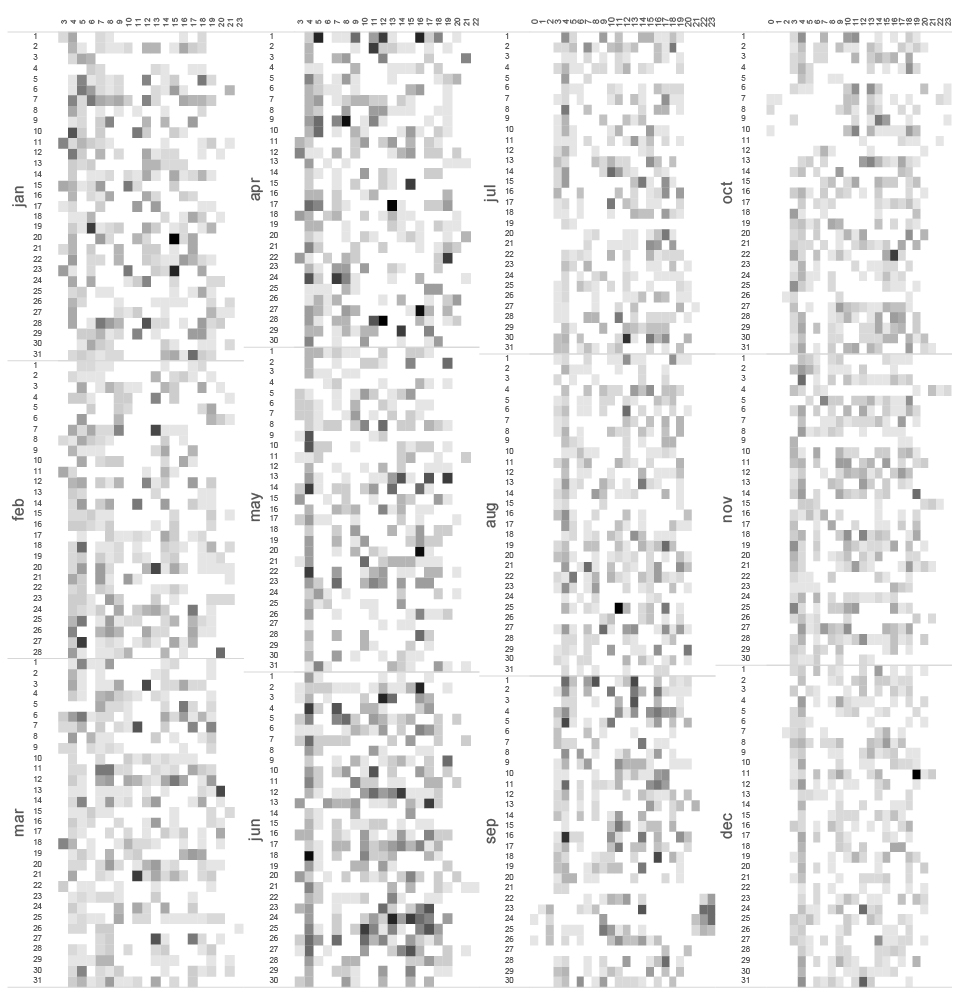
Looking at the heatmap, you can spot an interesting anomaly in September. On the 20th in the afternoon we see a really low level of activity, which is unusual for Mr.D, giving that we already know that his daily productive peak is around noon.
Further, on September 21st from 4 a.m, when he generally wakes up and starts work, there is no activity until the day after at 7 a.m.
In the next few days we see that the pattern is uncommon. It looks as if Mr.D sleeps in the afternoon and works intensively during the night. On September 27th, we can see again a lack of communication and then in the following days, Mr. D’s pattern is back to normal. Based on the other metadata inputs that we will explain later in our research, we found out that Mr.D was traveling to Singapore between the 21st and the 27th of September. With that we can easily conclude that a change in the time zone influences Mr.D’s email pattern.

We can find another anomaly in the pattern from October 5th to October 12th, but this pattern looks a bit different, it swings in another direction. On this occasion Mr.D went to the USA and it showed us how different time zones leave different footprints in his pattern.
There is also one really interesting pattern anomaly on June the 24th and the following day (you can see darker squares and an increased level of communication). On that day, researchers from Citizens Lab published analysis “Police Story: Hacking Team’s Government Surveillance Malware” exposing the functionality and architecture of Hacking Team’s Remote Control System (RCS) in a never-before published detail. This report had a great media coverage, including media such as The Economist, Associated Press, Wired, VICE, International Business Times, Forbes and others. We can see how this stressful event for Hacking Team reflects on the pattern of Mr.D’s emails.
Mysteries of the Subject
Aside from the defined activity patterns and discovered anomalies, email subjects also reveal a very detailed overview of Mr.D’s communication with other employees of Hacking Team.
timeline of emails sent from mr.d to individual ht EMPLOYEES in 2014 ( hover on graph for subject line )
TOOL : TABLEAU
Just to make a short but interesting digression: while creating this graph of email subjects we stumbled upon the moment A.Pelliccione left Hacking Team in March 2014. At this moment his communication with Mr. D stops. Based on the IP location data that we will present later, we also found out that he moved to Malta and started communicating through a different email address – reaqta.com.
We can argue whether the email subject should be considered metadata or not. However, looking from a technical point of view, the subject is a part of the header in the same way as other types of information (From, To, Date, etc.). Basically, it’s just a matter of choice of the person who is to analyse the metadata. For the intents and purposes of our research, we will consider the subject a legitimate source for metadata analysis.
timeline of subject lines ( 2014 )
TOOL : TABLEAU
Getting back to email subjects, they can sometimes give us some really amusing information. For instance, many companies such as Amazon, list the ordered items in the subject of a Confirmation email you receive after your payment has been processed.
By extracting the emails sent by Amazon to Hacking Team employees, we were able to get an insight into their purchases.
timeline of emails with subjects from amazon.it
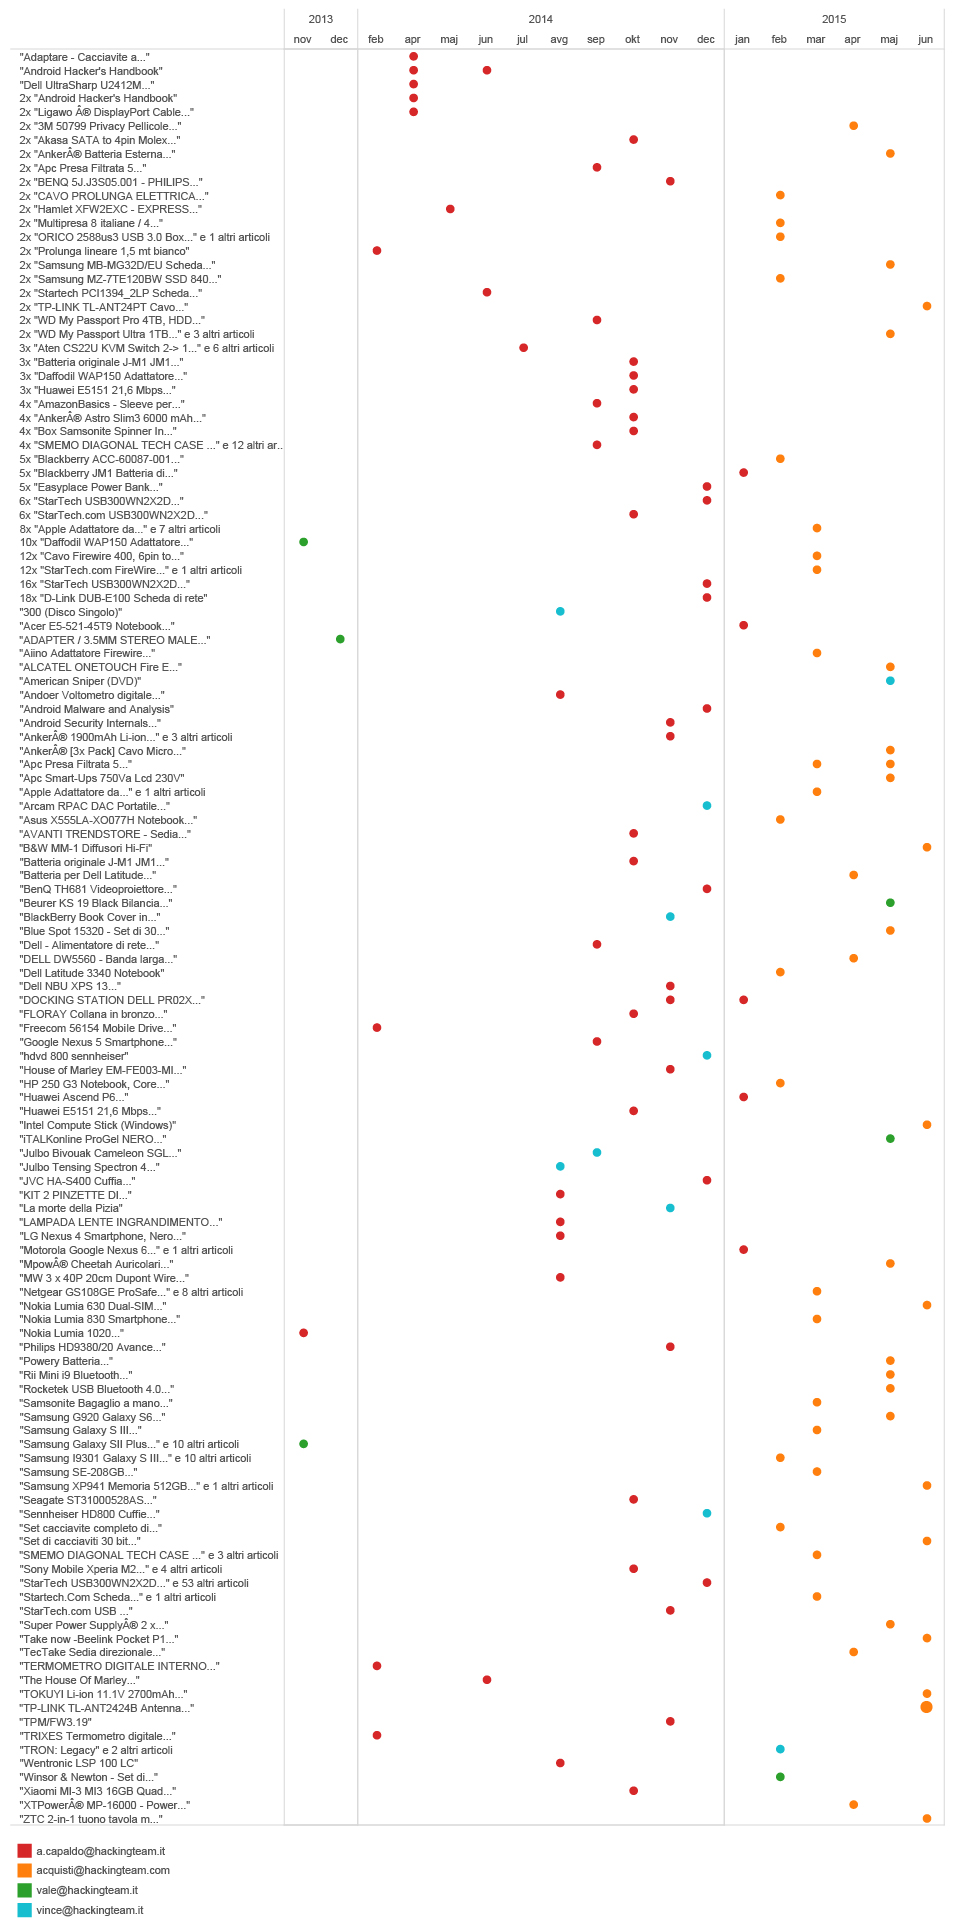
But there are some more extreme examples.
If we look at the treemap of Hacking Team partners, there is a company called Carlson Wagonit Travel. According to the company’s website, they deliver solutions for business travel, meetings and events management. For HT they arrange and buy plane tickets, book hotels and provide travel assistance. They have one bad habit (which is quite common for many booking agencies), every time an airplane ticket is booked, the agency would send an email with name and airport codes, contained in the subject line, to the prospective passenger. Extracting that information from the subject and cross-referencing with the date the email was sent, we are able to get an approximate information about the journeys of HT employees.
The list of Hacking Team frequent flyers and locations they visit looks like this.
map of ht employees flights based on cwt emails subject lines
TOOL : TABLEAU
These data give some interesting information related to our assumption of how the organisational structure of Hacking Team looks like. If we go back to our organisational structure graph based on social network analysis and compare with this list of frequent flyers, we can see that the most frequent flyers are not very high in the hierarchy according to our network graph. However, if we group the flights by passenger’s name, we realise that each of the most frequent flyers is based in a certain place, and covers a certain region/market, such as SE Asia, Middle East, South America etc. Conclusion that we can get from this is that those employees are responsible for certain markets or regional Hacking team offices around the world.
individual ht employees flights map based ON CWT EMAILS SUBJECT LINES
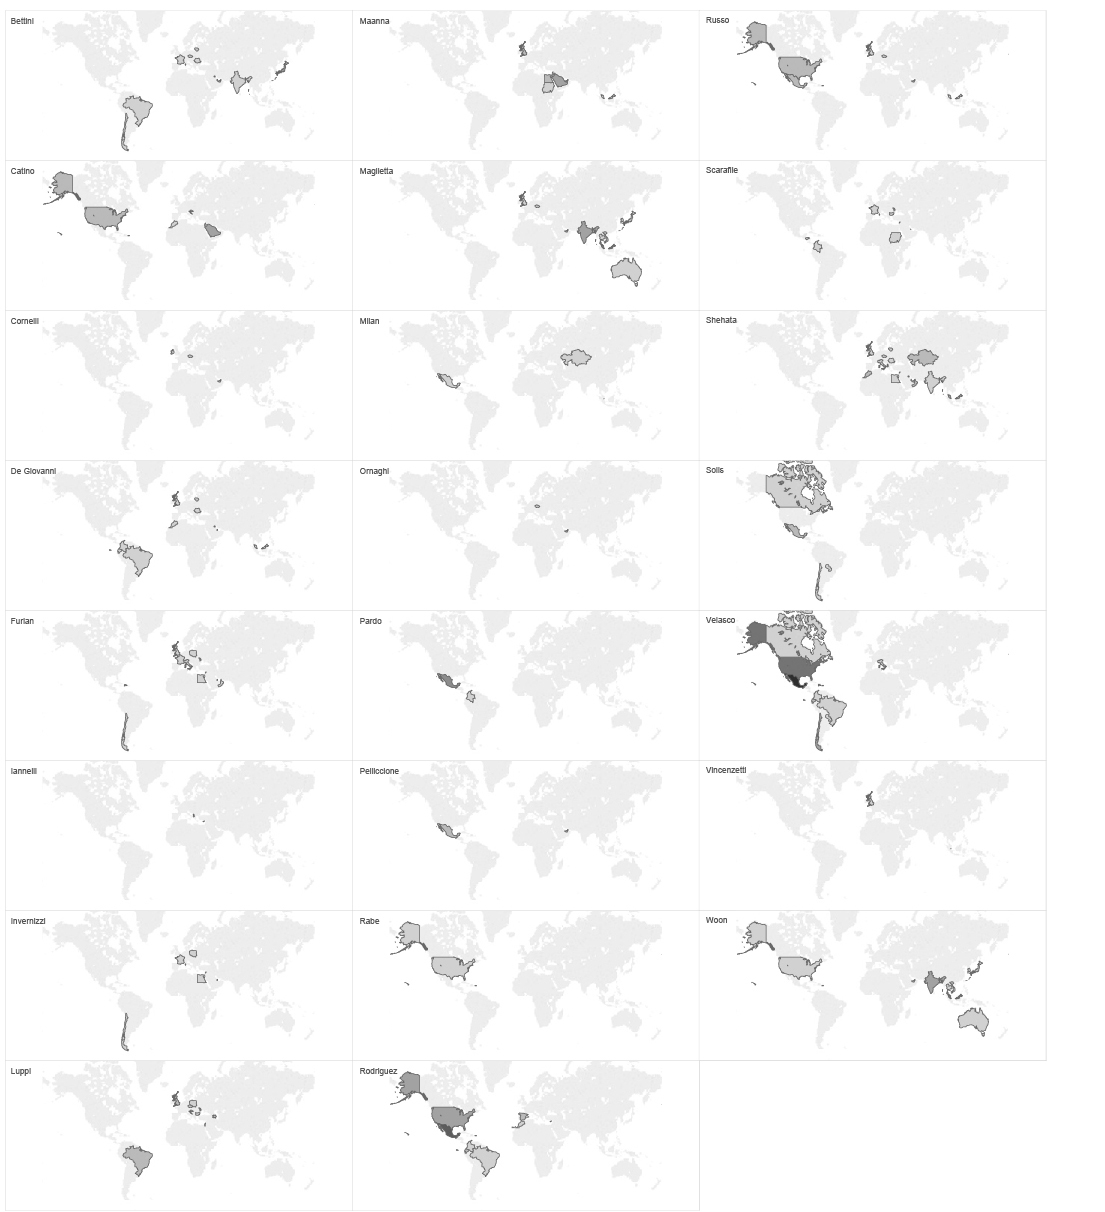
If we regroup the same set of data, by location, we can see at which point in time and where two or more Hacking Team employees have met or have traveled together. This implies potential business meetings, sales of surveillance tools, establishing new relations with international customers and government agencies around the globe.
timeline of INDIVIDUAL HT EMPLOYEES FLIGHTS to different countries BASED ON CWT EMAILS SUBJECT LINES
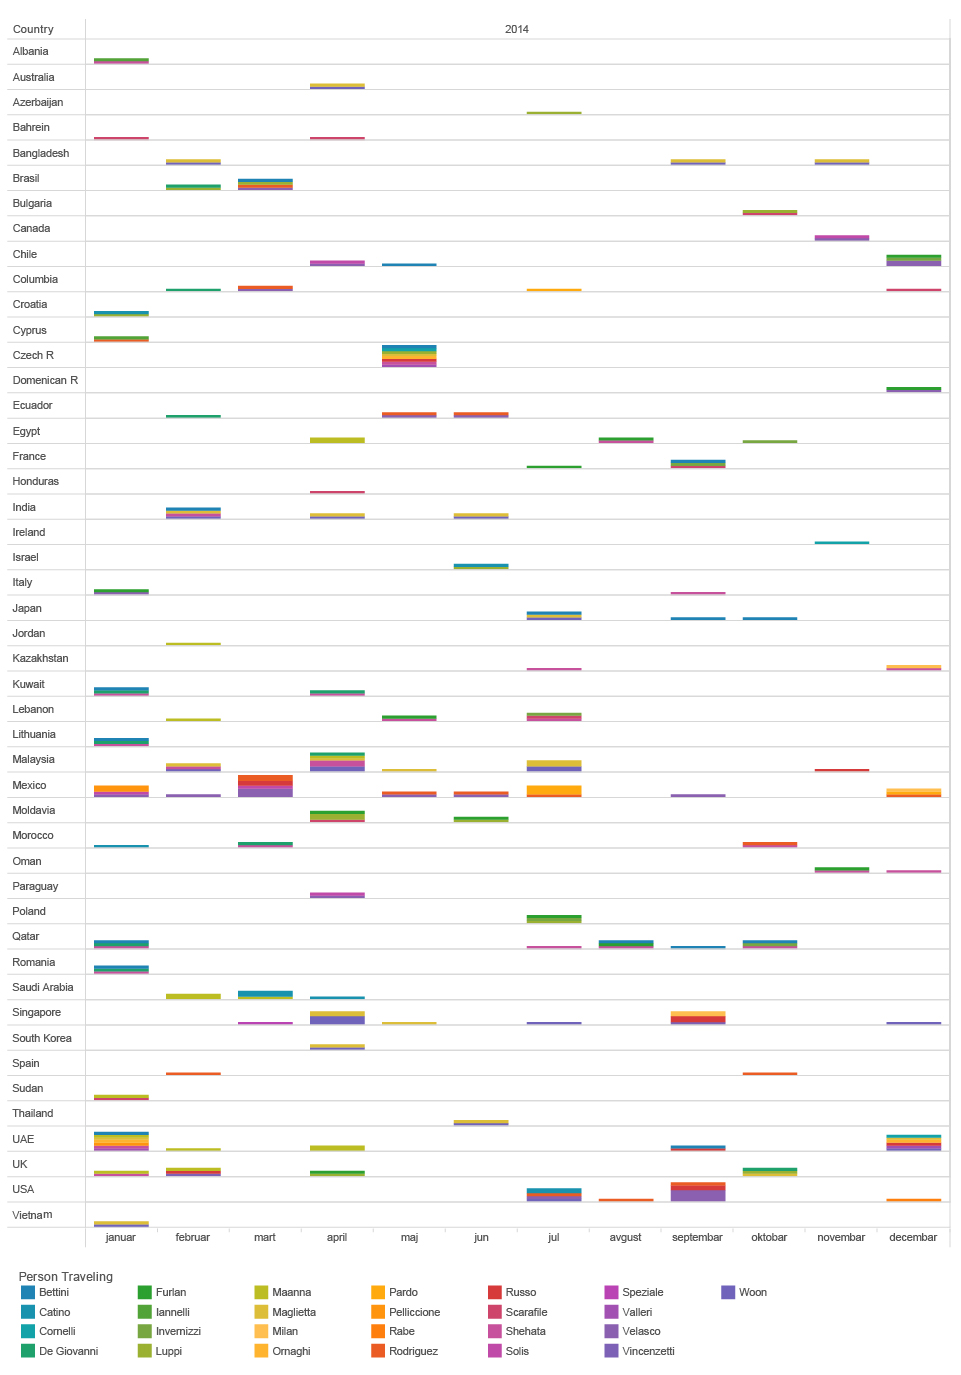
TOOL : TABLEAU
Homing pigeon
The email header hides one even more precise location information. In some cases, the email headers reveal the IP address of the sender. The IP address can then be geolocated, using some publicly available tools, to the level of a city or individual router. In the context of our investigation, this allows us to trace every one of Mr.D’s contacts. Every time someone sends an email to Mr.D, that person basically reveals their location to us. Just by analysing the metadata of Mr.D’s received emails we can get information where the senders are located, when they changed city or country.
This allowed us to locate even more precisely in time all employees of Hacking Team.
timeline of hT employees ip locations based on emails received by mr.d (2014-2015)
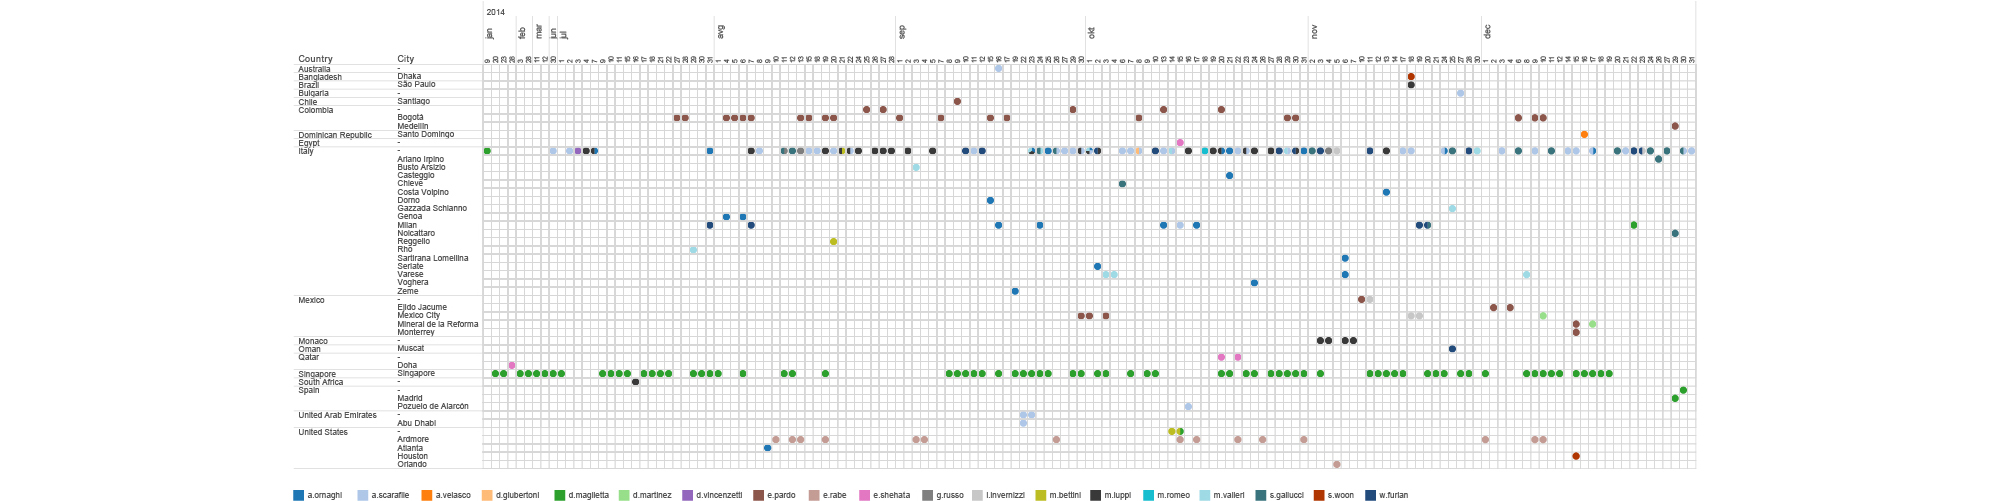
We can see for example, that most of the employees are located in Italy, but there are some of them being situated in different places around the world.
D.Maglietta is for example head of their office in Singapore but he spends Christmas in Spain. E.Pardo is in Bogota, Colombia most of the time and he had a visit from another HT employee A.Scarafile on January 14th. We can see how E.Shehata jumps around the Middle East visiting Qatar, Lebanon, United Arab Emirates, Egypt and Jordan. E. Rabe is situated in Ardmore, PA, USA but moved on February 14th to another suburb of Philadelphia. And finally, even though HT claims to have an office in Washington DC, based on metadata we didn’t find any evidence that would support that.
On a World map, the distribution of their locations looks like this.
map OF HT EMPLOYEES IP LOCATIONS BASED ON EMAILS RECEIVED BY MR.D (2014-2015)
TOOL : TABLEAU
Locations of the external contacts of Mr.D give us a real insight into their global operations.
MAP OF external contacts IP LOCATIONS BASED ON EMAILS RECEIVED BY MR.D (2014-2015)
TOOL : TABLEAU
This tiny piece of information allows us to explore individual contacts in each country, to find their main partners, even to track locations of their contacts in time.
MAP OF EXTERNAL CONTACTS IP LOCATIONS ( ZOOM or move map to explore other regions )
TOOL : TABLEAU
It’s Just Metadata
More often than not, the power of metadata is being taken naively or its potential usage is being oversimplified in comparison with the content of our communication. But we see that even our not very sophisticated, DIY methods, enabled us to create a deep and clear image of someone’s habits and activities, using information extracted from ‘only’ email metadata. Although our investigation primarily discovered relations, patterns and anomalies of someone’s work life, it still gave us an insight into that person’s habits that border with private life. In the end, metadata scans someone’s behaviors on a much deeper level than traditional surveillance practice related to content could ever do.
At moments, while conducting this investigation, it certainly felt as if we were peeking into the deepest corners of someone’s life. What felt even more disturbing is the idea that our subjects of analysis are probably less aware of their behavioral patterns that we are. It’s just metadata, and in our case just one little segment of it. This is why our research provoked an internal debate within our team on the ethical issues of this kind of practice and on the form in which the findings of this research should be published. On numerous occasions, supporters of NSA surveillance programs, claimed that collecting and analysis of metadata is not surveillance. According to our data exploration, we can claim that it can be even more intrusive than regular content surveillance.
Who has access to metadata?
Understanding who has access to metadata and the possibility to analyse it will give us an answer to the question of the new power structures and distribution of wealth in the information society.
Companies
The first and obvious group are the companies that provide services such as Google or Facebook. They don’t just have access to the metadata, they have actual data and content on their servers. Quality, variety and amount of metadata that for example Google owns about every user of his services, stored in gigantic datacentres are unprecedented MONOPOLIES OF COLLECTIVE DATA. Through their core business models they are pioneers of metadata exploitation. It could even be said that the first data centre setup by Google in 1998 can be considered the milestone of the birth of the metadata society.
The first and obvious group are the companies that provide services such as Google or Facebook. They don’t just have access to the metadata, they have actual data and content on their servers. Quality, variety and amount of metadata that for example Google owns about every user of his services, stored in gigantic datacentres are unprecedented MONOPOLIES OF COLLECTIVE DATA. Through their core business models they are pioneers of metadata exploitation. It could even be said that the first data centre setup by Google in 1998 can be considered the milestone of the birth of the metadata society.
INFRASTRUCTURE
The second group with access to metadata is related to the the internet’s infrastructure. Those are Internet service providers, mobile service providers, Internet exchange points and submarine optic cables and they can access data when it flows through their cables, routers and servers. The quality of metadata that they can collect depends on the endpoints attached to the infrastructure, but in any case they have access to the basic metadata of the internet packets. Even though the content of, say, emails, is supposedly encrypted (at least when using these mainstream services), the metadata is not, because the email architecture simply has to rely on metadata that are readable, as explained before.
The second group with access to metadata is related to the the internet’s infrastructure. Those are Internet service providers, mobile service providers, Internet exchange points and submarine optic cables and they can access data when it flows through their cables, routers and servers. The quality of metadata that they can collect depends on the endpoints attached to the infrastructure, but in any case they have access to the basic metadata of the internet packets. Even though the content of, say, emails, is supposedly encrypted (at least when using these mainstream services), the metadata is not, because the email architecture simply has to rely on metadata that are readable, as explained before.
GOVERNMENT
National Laws in most cases give the Government or some of the Agencies thereof a legitimate access to users’ data, including email and other metadata. Internet infrastructure owners or companies that provide services are obliged to cooperate with Governments whose jurisdiction they are under. They often comply with Government requests and have different forms of technical cooperations. However, in many countries Government agencies have invested in developing programs for mass surveillance of citizens based on collecting metadata. These programs often rely on software that creates and exploits backdoors (as is Hacking Team’s case) or use some other creative way to get access to metadata.
National Laws in most cases give the Government or some of the Agencies thereof a legitimate access to users’ data, including email and other metadata. Internet infrastructure owners or companies that provide services are obliged to cooperate with Governments whose jurisdiction they are under. They often comply with Government requests and have different forms of technical cooperations. However, in many countries Government agencies have invested in developing programs for mass surveillance of citizens based on collecting metadata. These programs often rely on software that creates and exploits backdoors (as is Hacking Team’s case) or use some other creative way to get access to metadata.
Those are the hunters, hoarders and scavengers in the ecosystem of the metadata society, but there are some smaller species worth mentioning as well. Metadata is often a resource for different businesses based on data collection and analysis in the field of digital marketing, business analytics or scientific research. You can even be a subject of surveillance in your work environment. The company you work for could perform metadata analysis of your productivity, anomalies in your behavior during work time and analysis of your contacts. To name an example, this kind of internal company surveillance service is provided by one of the Hacking Team main partners – Nice, mentioned earlier in this text.
Understanding the power of metadata brings us closer to understanding the algorithmic governmentality as a concept and practice. The quality of metadata is that it is really easy to process and it can be done by machines and algorithms. In the eye of the algorithm, we are observed through our profiles, sets of behavioral patterns and anomalies extracted from our metadata. Automatic processing and algorithmic analysis of those data in real time leads to the world in which algorithms can decide whether we are terrorists or regular citizens, are we suitable for a loan in the bank, an insurance policy, or who is going to appear in our social stream. Algorithms can eventually predict our future behaviour based on our past metadata, bringing us closer to the concept of pre-crime, the tendency in criminal justice systems to focus on crimes not yet committed.
We are not going to conclude anything about Hacking Team’s activities, because that was never the goal of our research. We wanted to understand, hands-on, through research and practice how metadata analysis can be performed and what we can learn from it. We hope that researchers and investigative journalists can use our data and exploration for their own research and that they will be able to find new connections and leads based on metadata.
Contributors
Vladan Joler – concept, research, data analysis, data visualization, text
Andrej Petrovski – data mining and processing, text
Nikola Kotur – data processing and development
Tamara Pavlovic – editing and proofreading
Jan Krasni – peer review
More about Share Lab you can find here
For any question, raw data for research, or anything else, please contact us on info.at.shareconference.net
]]>
At least one Serbian security service negotiated the purchase, while the Ministry of Defense comes up as a trial user of the spy software made by Hacking Team (HT), a company from Milan whose electronic databases were made publicly available last week by Anonymous and Wikileaks.
Not long after the Italian company’s Twitter account had been compromised, more than 400 gigabytes of data were published, including internal documents, client lists as well as source code.
Huge HT databases are still in the initial phase of analysis by experts, journalists and activists around the world. Share Foundation team singled out a company correspondence related to Serbia, in which members of the Security Information Agency (SIA) and the Ministry of Defense have participated, along with a private company located in New Belgrade.
The negotiations lasted until the end of 2011, partly with mediating services from a private company for trade and manufacturing of computer equipment “Teri Engineering“ from New Belgrade, whose CEO arranged meetings, software testing and negotiated the price. In an internal discussion, this Belgrade company was mentioned as a “player” which could introduce the spy software manufacturers “to the whole central Europe”.
According to the available information. the first contact from Serbia was established after the international exhibition of internal security equipment MiliPol Paris 2011, when a member of the Security Information Agency (SIA) contacted a branch of Hacking Team, asking if a presentation of HT software in Belgrade could be arranged.
SIA and Hacking Team
The software is known as the Remote Control System, RCS, based on the targeted spreading of viruses on computers and mobile phones of persons under surveillance. Most clients using this system are states and security services from across the world.
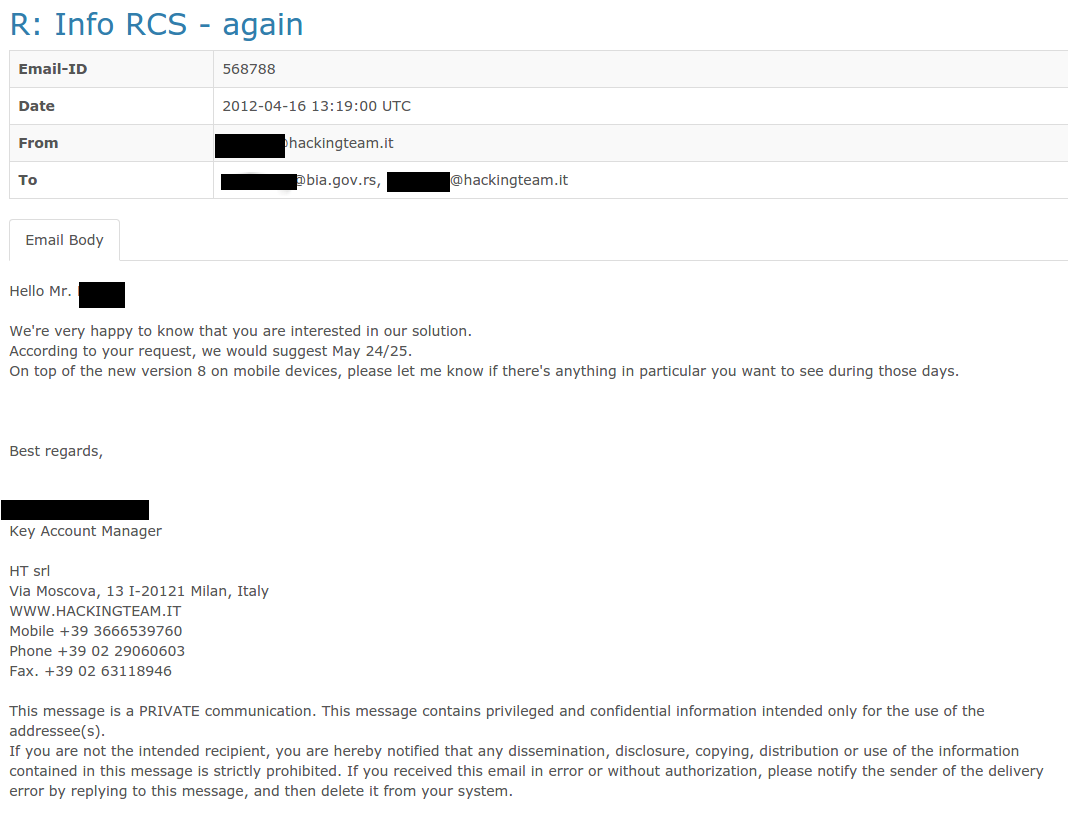
The initial presentation in Belgrade surely took place, but the correspondence dies down until April 2012, when the same SIA member addresses the HT manager, who will notify him that the new version of the software will be available in May and that they could meet at the end of that month.
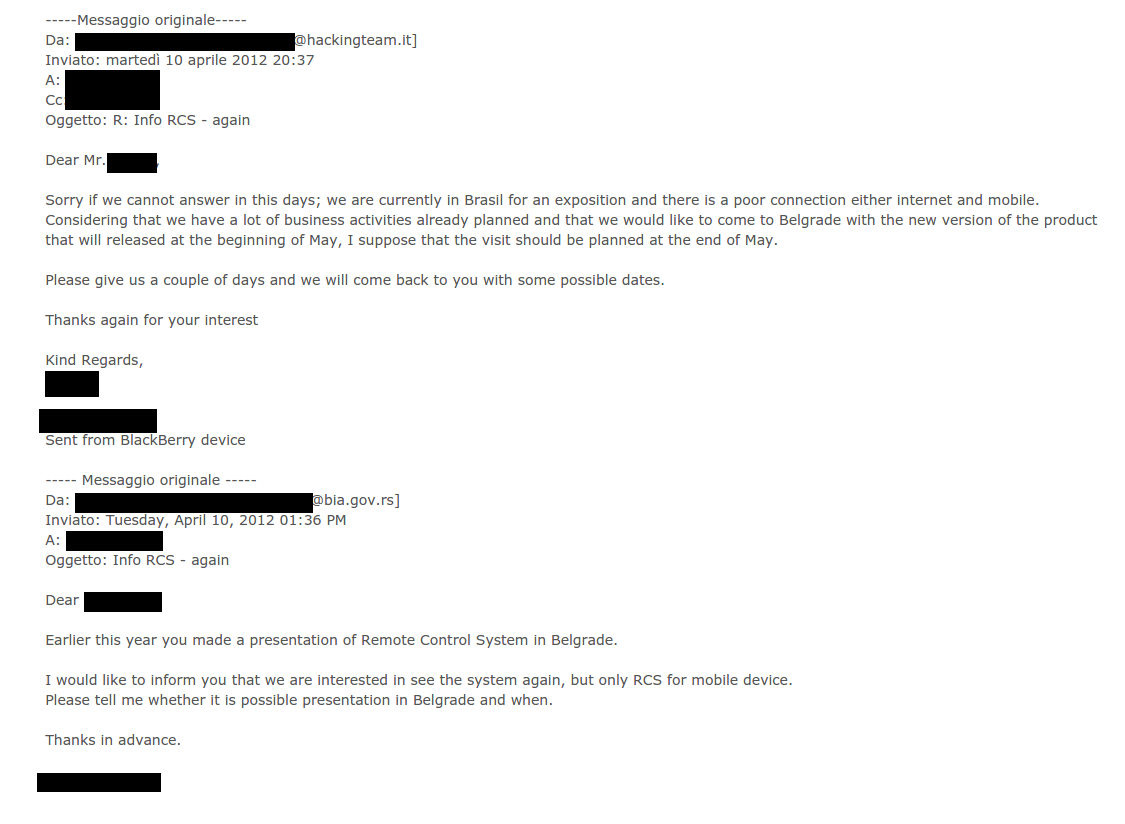
In the internal correspondence of the HT manager regarding the planned presentation in SIA Headquarters in Belgrade on 24 and 25 May 2012 it is noted that the SIA was “already introduced to the software in their Headquarters in the beginning of the year and a month ago in Rome”. It is stated that the SIA is now calling them to test only the software for mobile device surveillance. One of the HT representatives communicating with the Serbian security service member is mentioned in “Spyfiles 3”, a Wikileaks database with information related to many global manufacturers and vendors of spy equipment and software.
MSA searching for the spy virus
Independently of the communication with the Security Information Agency, at the same time the CEO of “Teri Engineering”, a private company from Belgrade, addresses the Hacking Team managers, with a recommendation (and a percentage for closing the deal) from Nice Systems, an Israeli company specialised in electronic surveillance and data analysis. In the correspondence, the intermediary from Belgrade lists MSA which is an abbreviation for Military Security Agency (“VBA” in Serbian) as a possible client, and offers local implementation services.
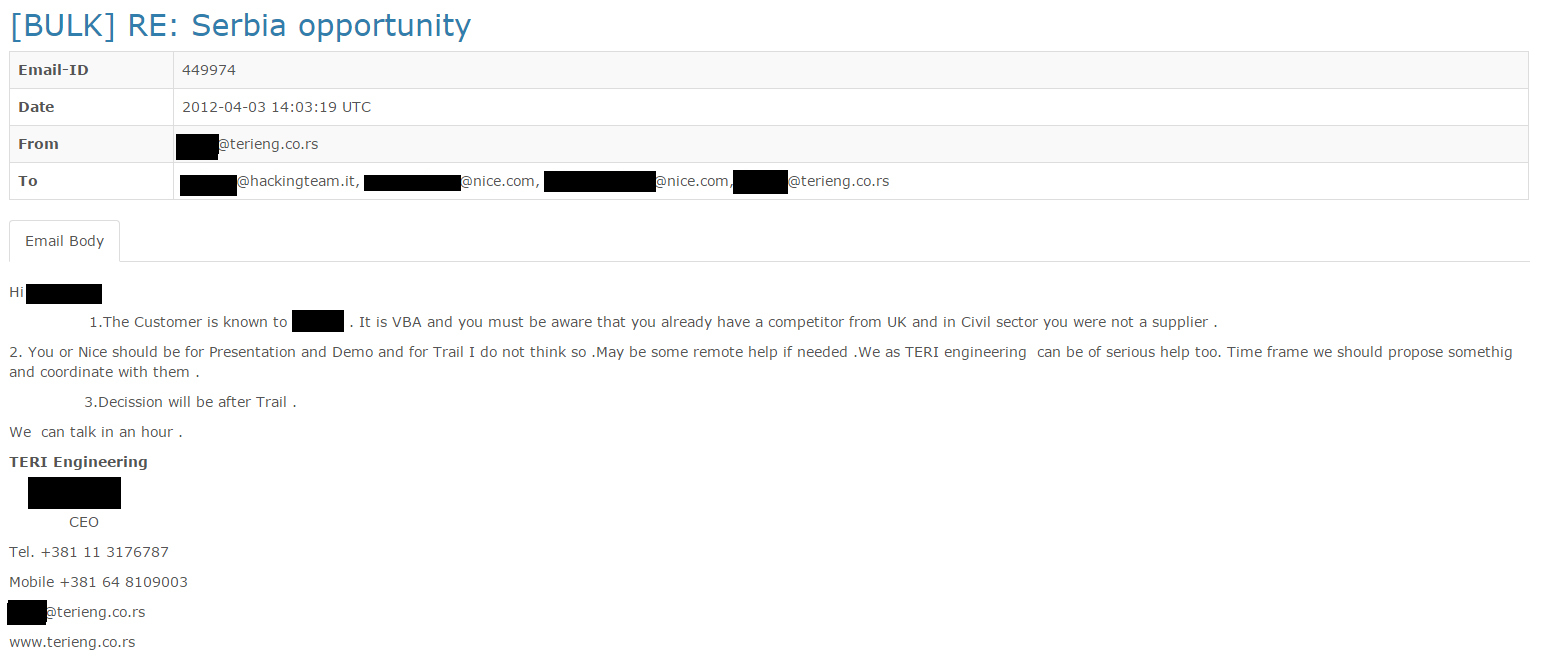
The negotiations begin in April, a month before the parliamentary elections of 2012, and the intermediary from Serbia insist that the presentation is held as soon as possible. From the emails it could be understood that the presentation was held shortly afterwards, and that the client from Serbia (MSA) received the system for a trial.
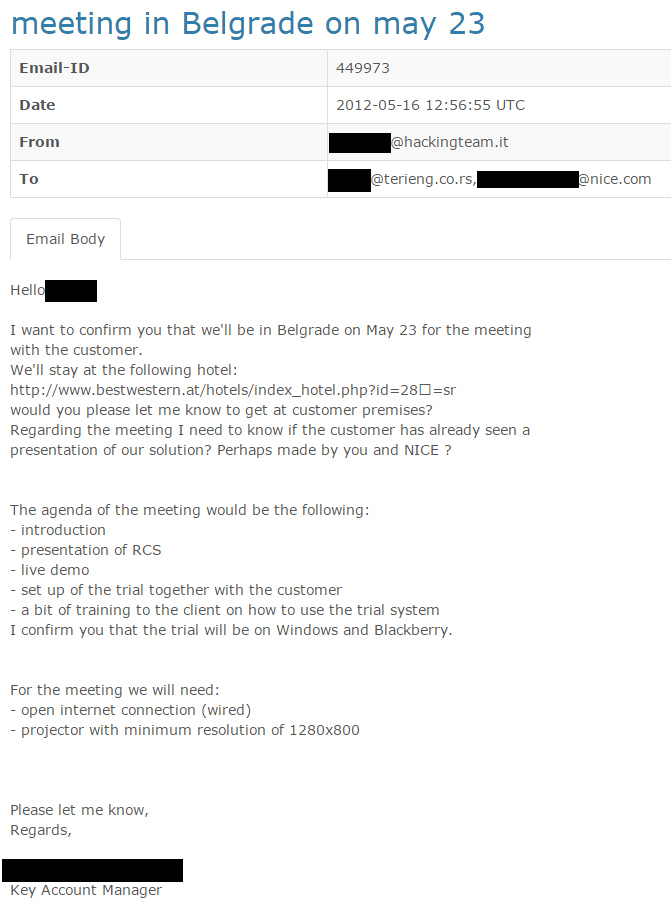
Negotiations on price soon followed, and the intermediary – despite the hefty commission for her company and the partners from Israel – managed to significantly lower the price from close to 500.000 euros to around a half of that amount. A person with an email address on the Ministry of Defense domain participated in the correspondence regarding the technical details of activating the virus and using the infected phone.
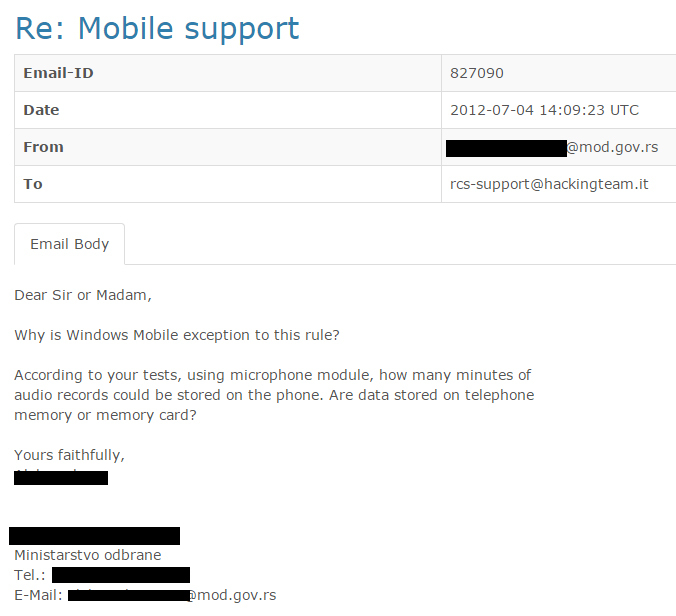
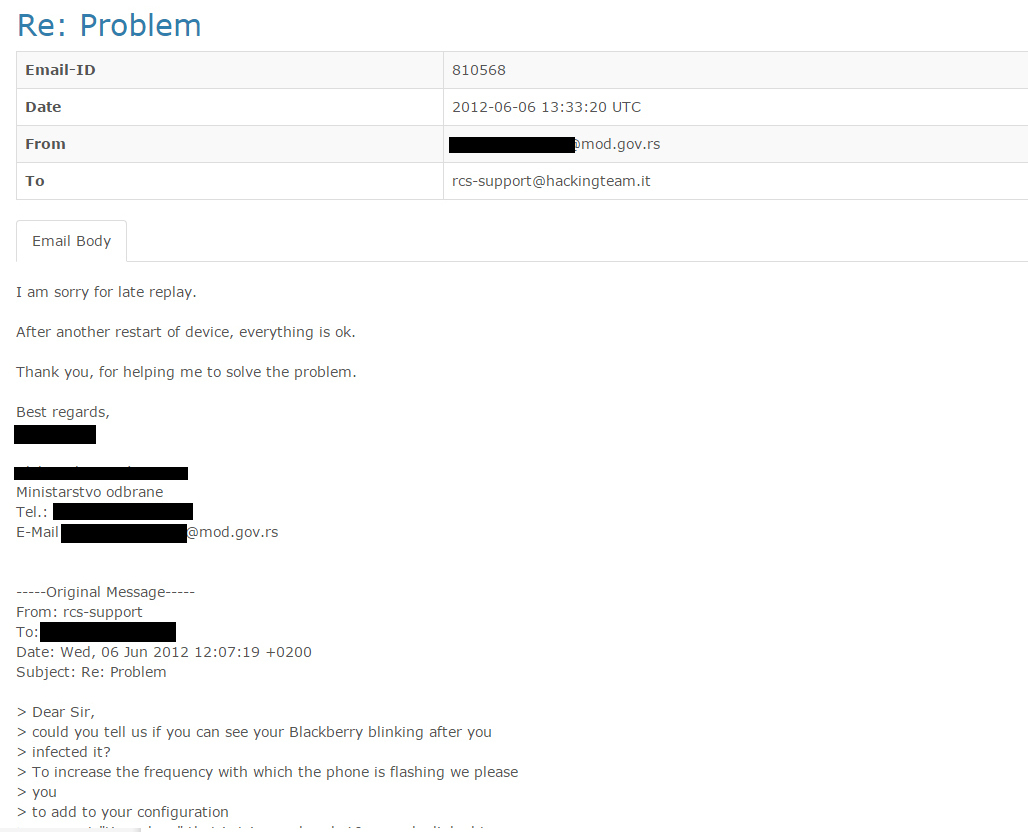
In late fall 2012, CEO of “Teri Engineering“ from Belgrade notified HT that because of possible “problems with the budget”, the procuring entity (instead of MSA/Ministry of Defense) could be Telecom Serbia, “100% state-owned company”.
Same year in September, after the trial was finished, the intermediary from Belgrade told the HT representatives that their system had a problem “which does not exist with the competitors”. It was Gamma, a company from London, whose software FinSpy, as it is known, soon found its buyer in Serbia.

Communication continued at the start of 2014, when there is a news from Belgrade that the budget for this deal was finally adopted, but negotiations stumble because of the price. Another obstacle were the parliamentary elections (March 2014) and the expected changes in the Ministry of Defense and security agencies, with new personnel appointments awaiting.
Hacking Team tried to arrange another presentation in Belgrade, aiming to divert their potential client from the competition. At that moment however, the competing spy software is already in Serbia.
In May last year, the communication from Belgrade totally dies down.
How do the agencies monitor infected devices
Until now, several ways how the Hacking Team’s system uses exploits in targets (e.g. devices) were identified. It is an advanced graphical interface in which most operations are performed with a single click. With the system, buyers also receive an instruction manual how to execute different types of infections, physically and on the internet.
The most common way of infecting targeted devices via the internet is to send infected documents (.doc files) by email, which when saved automatically start downloading spyware in the background and install a “backdoor” on the infected device, therefore implementing HT spyware.
In the control panel, there is a list of all infected devices, with their maximum number depending on the specific product. It is important to note that every system is tailor-made and that the price of the system depends on its functions, supported devices (PC, Mac, BlackBerry, mobile devices) and operating systems (Windows, Linux, OS X).
Primary use of this software is to monitor the system on which the spyware is implemented and not be recognised by the anti-virus program, which is why it is necessary to update the system regularly, so the price of yearly maintenance is 20% of the total value of the licence (75.000 €).

As part of its server, Hacking Team also had a KnowledgeBase, where it was described in detail which data from which devices and operating systems can be extracted. There are also instruction how to infect devices, as well as analysis of different anti-malware software.

For technical support, user would open a ticket on Hacking Team’s website and then their team would do a reconstruction of the problem in a laboratory and found a solution, which can be another reason why the maintenance price is relatively high.
Users of RCS software are mostly governments or government agencies. The system works on the basis of proxy servers which “launder” the traffic through several countries, so it is virtually impossible to technically determine who performs surveillance and where is the surveilling operator located.
During the past several years, Hacking Team, a manufacturer of surveillance software and equipment, has been targeted by civic organisations because of its active role in the global development of the surveillance industry without civilian control, as well as selling the software to countries known for heavy human rights abuses, even when it represents a violation of UN sanctions, in case of Sudan.
Hacking Team was a key actor in the research carried out by CitizenLab at the start of last year, because of the sale of RCS to various governments. Their product was used for tracking the award-winning Moroccan news portal “Mamfakinch“ in 2012, as well as human rights activists from the United Arab Emirates.
Last year, Privacy International warned of the possibility that this company had received million and a half euros from funds connected to the Region of Lombardy in 2007. From the leaked financial databases it can be seen that Mexico, Italy and Morocco are the biggest Hacking Team clients, with “orders” valued at several million euros in total.
Share Foundation wrote about the legal framework for import of this kind of software in Serbia back in 2013 because of the “Trovicor” case, stating that rules for dual use goods must be applied and that a permit from the Ministry of Trade, Tourism and Telecommunications is obligatory. In October 2014, the European Commission updated the list of dual use goods, inter alia because of the need to control IT intrusion software (‘spyware’) and telecommunication and internet surveillance equipment. In accordance with this, the Government of the Republic of Serbia has also adopted aDecision in May 2015 to fully comply the national control list of dual use goods with the European Commission’s list.
On the other hand, use of equipment such as the one being sold by Hacking Team is not explicitly prescribed as a measure that state bodies can use. If we assume that certain organisations can be authorised to use this equipment, in our legal system that wouldn’t be possible without a court decision in accordance with the law. Using it in any other way would be an obvious violation of human rights which are guaranteed by the Constitution of the Republic of Serbia and numerous international conventions.
While smartphone penetration in Serbia is about 35% and constantly rising, the percentage of mobile phones in use is well over 130%56. Which means that about a quarter of the populations has more than one mobile phone. Metadata as a type of information was mentioned earlier, and in this context it is important to mention that each and every device regardless of whether it is a smartphone or an earlier generation mobile phone generates metadata. The only difference being that older mobile phones don’t support Internet, thus they don’t generate metadata related to Internet use. Because of the relatively high and rising number of smartphone users, as well as the prospects of development of the matter, this research is conducted from a smartphone’s perspective.
Every smartphone commercially available in Serbia (and in the World) at present supports three types of traffic through the cellular network i.e. calls, SMS and mobile data (mobile Internet). It is important to note that all three types of traffic go through the same infrastructure, ergo the points in which surveillance is possible are the same for all of them. This would mean that in this part of the research we are talking about mobile device generated traffic in general and emphasising the differences that come to pass in all three different types of traffic.
So, let’s start from the beginning and explain the way a device connects to a network, or rather how it authenticates itself on the network. For the purpose of authentication the device uses 2 ID numbers, the first one is the device’s IMEI number (International Mobile Station Equipment Identity), and the SIM card’s IMSI number (International Mobile Subscriber Identity). Both numbers are unique and predefined for every device/SIM card. The mobile carriers have an infrastructures of Base Stations (BS) that are geographically distributed throughout the area that’s being served by the operator. The BS form the backbone of the entire mobile infrastructure.
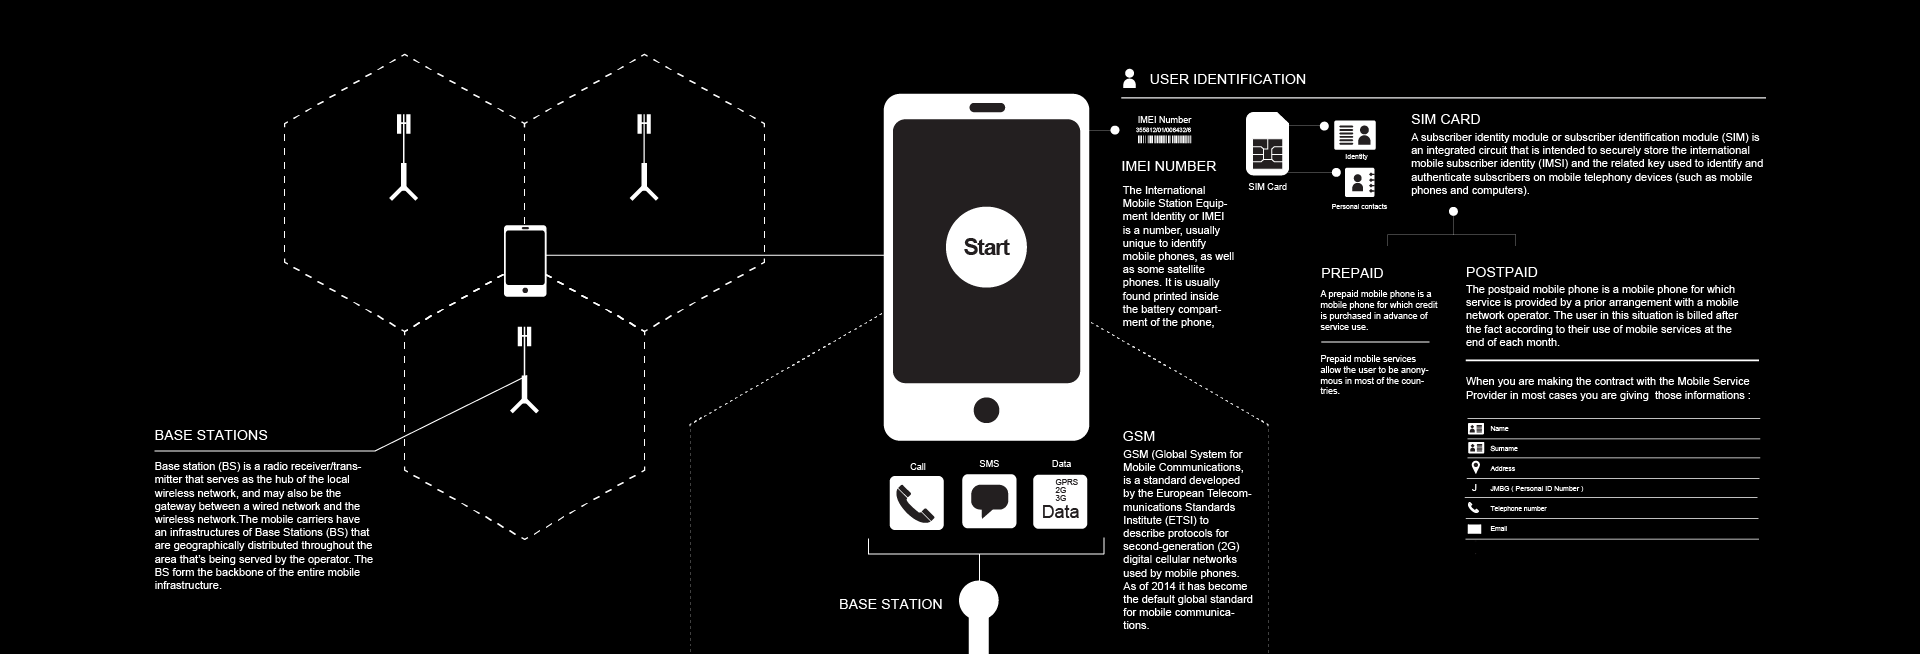
When a call is initiated the caller’s device contacts the nearest BS, and the BS forwards the call to the Mobile Switching Centre (MSC). The MSC then informs the BS that is nearest to the called user who gets the call. Once the call is established (the called user answers the call) meta data is being generated in the MSC. The MSCs archive the metadata in the carrier’s own datacentre. The content of the calls is not being archived, but also passes through the MSC.
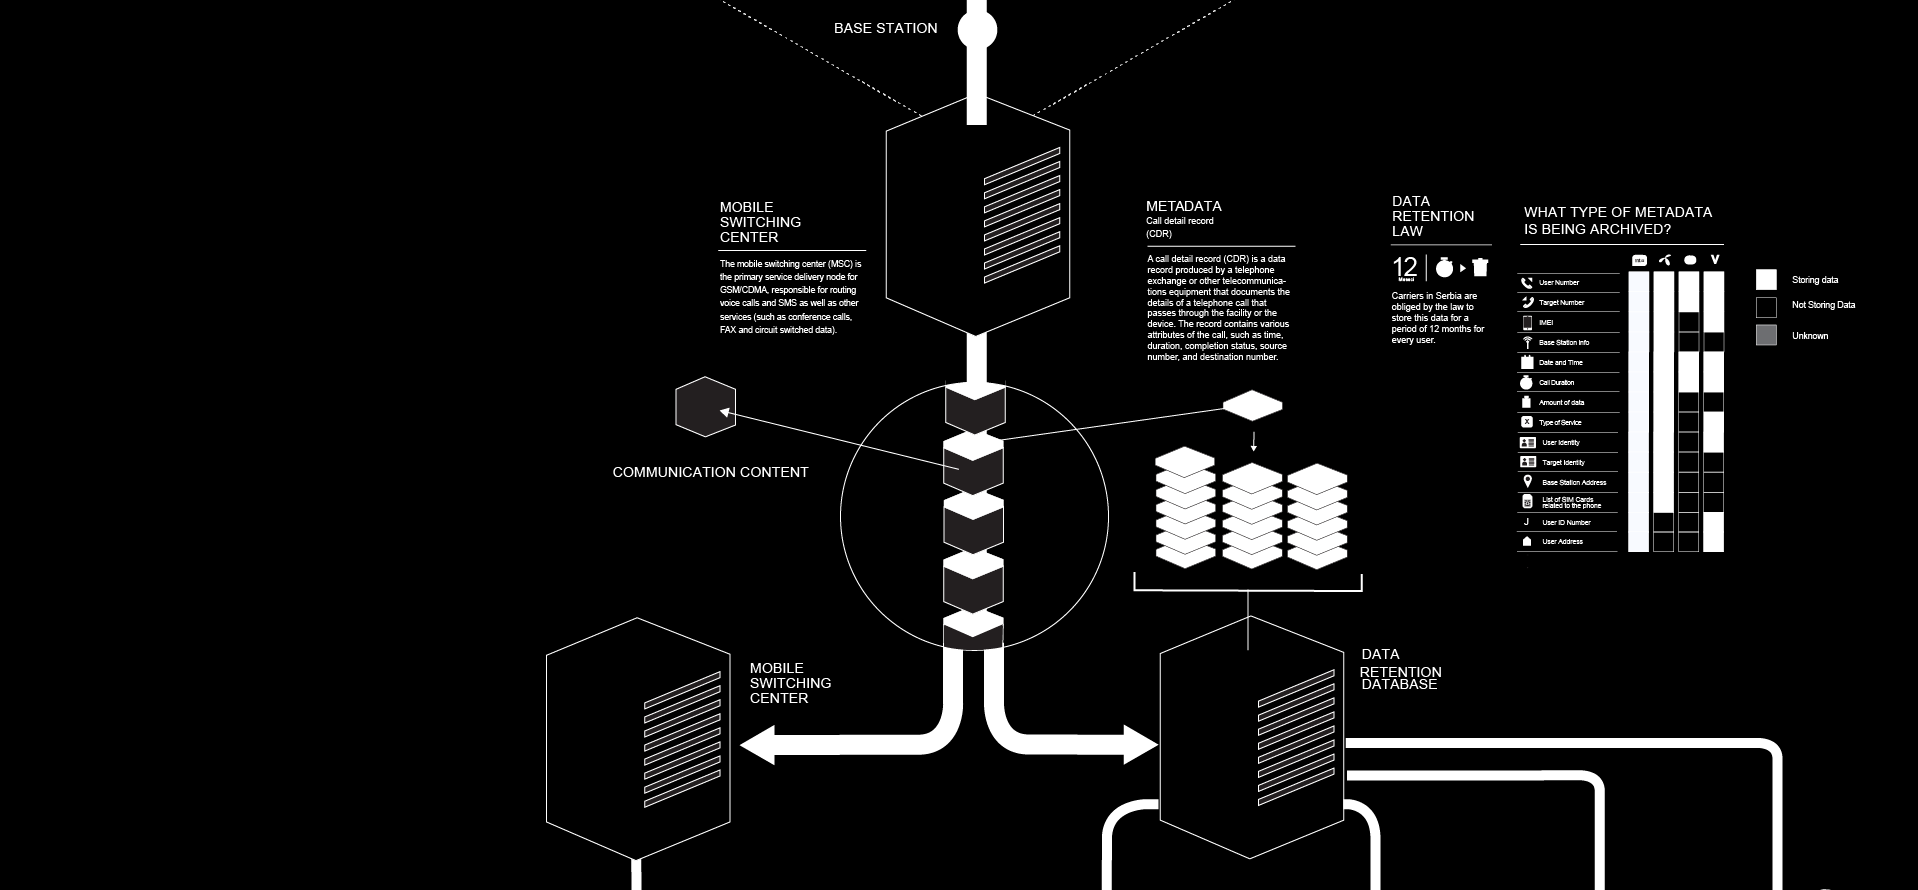
What type of metadata is being archived?57
The answer to this question varies from carrier to carrier, at least in Serbia, but there is a general set of metadata that all carriers archive i.e. Caller’s number, called number, IMEI, details about the BS, date and time of the call, duration of the call, amount of data (for Internet), type of service, details about the identity of both parties, list of all SIM cards that have been used in the current device (and vice versa, list of devices the current SIM card has been used in). There is also data that can not be classified as metadata, but can be accessed by having the aforementioned metadata, i.e. National ID number, user’s address (through contracts or registration of the SIM card for prepaid users) and device make and model (using the IMEI number). The process of archiving this data is called Data retention.
How is this data stored?
Carriers in Serbia are obliged by the law to store this data for a period of 12 months for every user. The data is stored on servers; there are no strict rules whether the carriers need to buy there own serves or can use other company’s servers to store all these data. However most of them have data centers in their ownership. All the operations on the servers are being logged for control purposes.
How can these data be accessed?
The mobile carriers in Serbia have designated departments that deal with affairs related to Data retention. The employees, who work in those departments are specially trained to deal with the entire process of data retention and access to retained data. When it comes to access of retained data, there have been identified several actors (i.e. state organs) that have accessed retained data in some way. Not all state organs have the right to access retained data, this right lays with the organs of justice, as well as the Police, and both civil and military intelligence agencies. Even within this group there are differences in who can access what and how. There are several mechanisms, or channels that can be used for access to retained data.
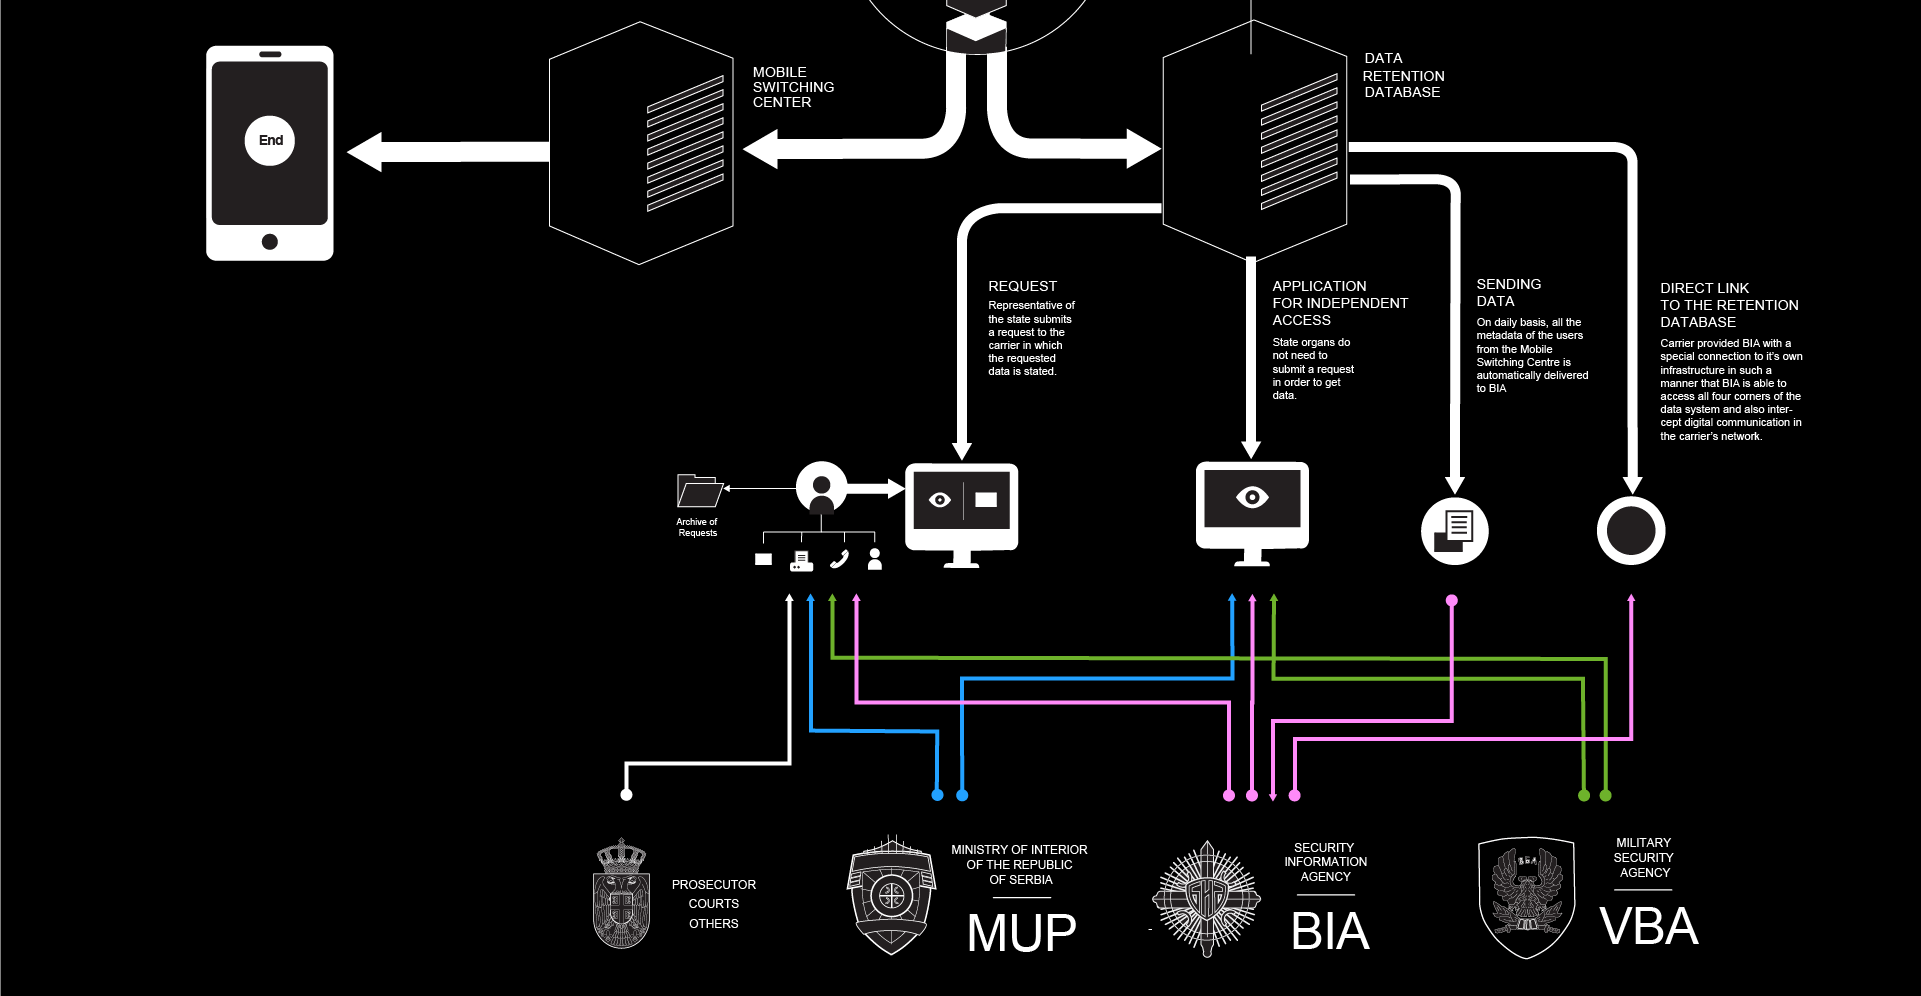
Request58
The first mechanism is the most simple one, it’s based on the request – response principle. This mechanism is used by all state organs and all carriers. Namely, a representative of the state submits a request to the carrier in which the requested data is stated. There are several forms that are commonly used for submitting these requests, mostly by email, fax, phone or in person. The special department within the carrier then processes the request and delivers a report based on the input that has been submitted. Potential issues in this mechanism include the fact that requests submitted by phone should not be (and in some cases are) processed because of the possibility of fraud, and the inability to deliver the appropriate documentation (a court order). Some of the carriers have developed a system for submitting requests by designating a limited list of dedicated e-mail addresses that serve this purpose.
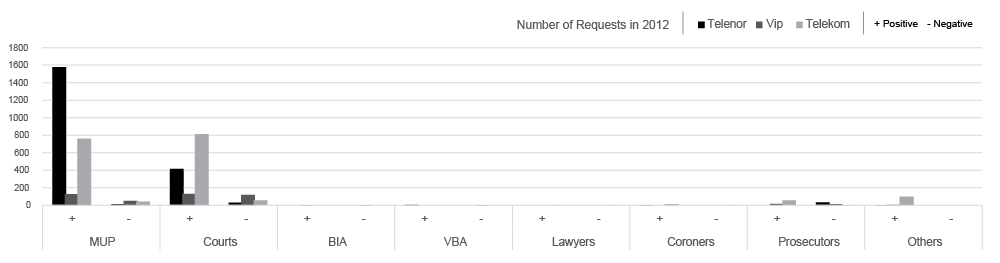
An upside of this mechanism is that every single request submitted to the carrier, this enables transparency and review of the requests the state organs submit.
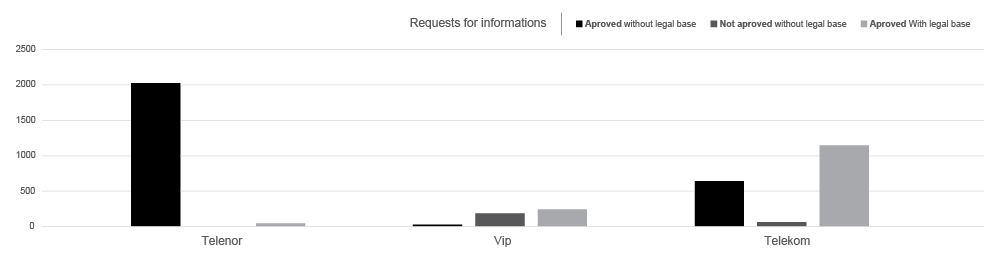
Application for Independent access to retained data
Another mechanism for access to retained data is the so-called Application for Independent access to retained data. This is a software implemented by some of the carriers in Serbia for the convenience of the state organs. This mechanism is used by the Police, and both the military and civil intelligence agencies. This basically means that these organs do not need to submit a request in order to get data. The application can be accessed online with credentials provided by the carrier. A set of different queries is available within the application which offers practically limitless access to all the data that is stored in the database in a form of different listings (outgoing calls, incoming calls, data usage, SMS/MMS communication etc.) All of the aforementioned listings, along with the basic details of the user whose metadata is being accessed, contain detailed information about location, duration of service, and all the other types of data that were mentioned earlier as retained data. Submitting a court order for accessing this data is not a requirement, so it is clear why this mechanism would be problematic privacy-wise.
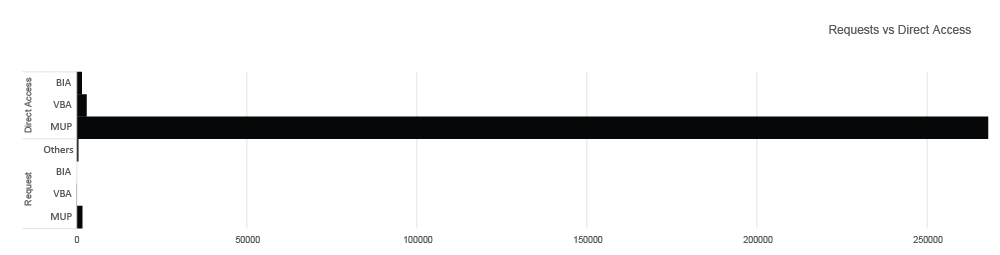
Even though these are the two primary mechanisms used by all carriers, there are some specific scenarios or specially established channels of commuting retained data between some carriers and some state organs. Here, we will give two such examples.
Sending data
There is an established connection between one mobile carrier and the Security Intelligence Agency (BIA) which represents a standalone mechanism for access to retained data, independent of all the other mechanisms. There has been a practise that on a daily basis, all the metadata of the users from the Mobile Switching Centre is automatically delivered to BIA. This creates special circumstances of non-transparent handling with retained metadata and implicates data collection on a mass level. Another issue with this mechanism is that it doesn’t comply with the legal provisions that allow for retained data to be stored for a maximum length of 12 months, because no authority monitors BIA for handling retained data. Further more, BIA doesn’t enjoy the right to archive metadata, this responsibility only lies with the carriers.
Direct Access To the Retention database
Another case is the link between another carrier (who only provides with Internet and landline services) and BIA. In this situation upon a request of BIA the carrier provided them with a special connection to it’s own infrastructure in such a manner that BIA is able to access all four corners of the data system and also intercept digital communication in the carrier’s network.
It is important to note that the two last mechanisms do not have any legal grounds. Furthermore, they are an active threat to user’s privacy and are in conflict with the legislation that regulates electronic communications and similar matter both in Serbia and on international level.
Wiretapping
The principle Metadata doesn’t lie is certainly true, as is the fact that if metadata is mapped right it can provide the interested party with much deeper insight to the situation than the content of the communication. However, this does not mean that the content is not important.
Wiretapping is a technique that has been around for as long as electronic communications exist. With the new technologies used in the communication infrastructure and the new services that are available, the concept of wiretapping has changed and evolved into a new concept which is called surveillance. Surveillance is much more than wiretapping, it can be conducted on many levels, such as personal or organisational, but also on mass level. This means that someone can have the ability to listen into each and every call being made on a national or continental level. Mass surveillance is illegal in almost every country in Europe, for security purposes the law establishes a concept of interception of electronic communications.
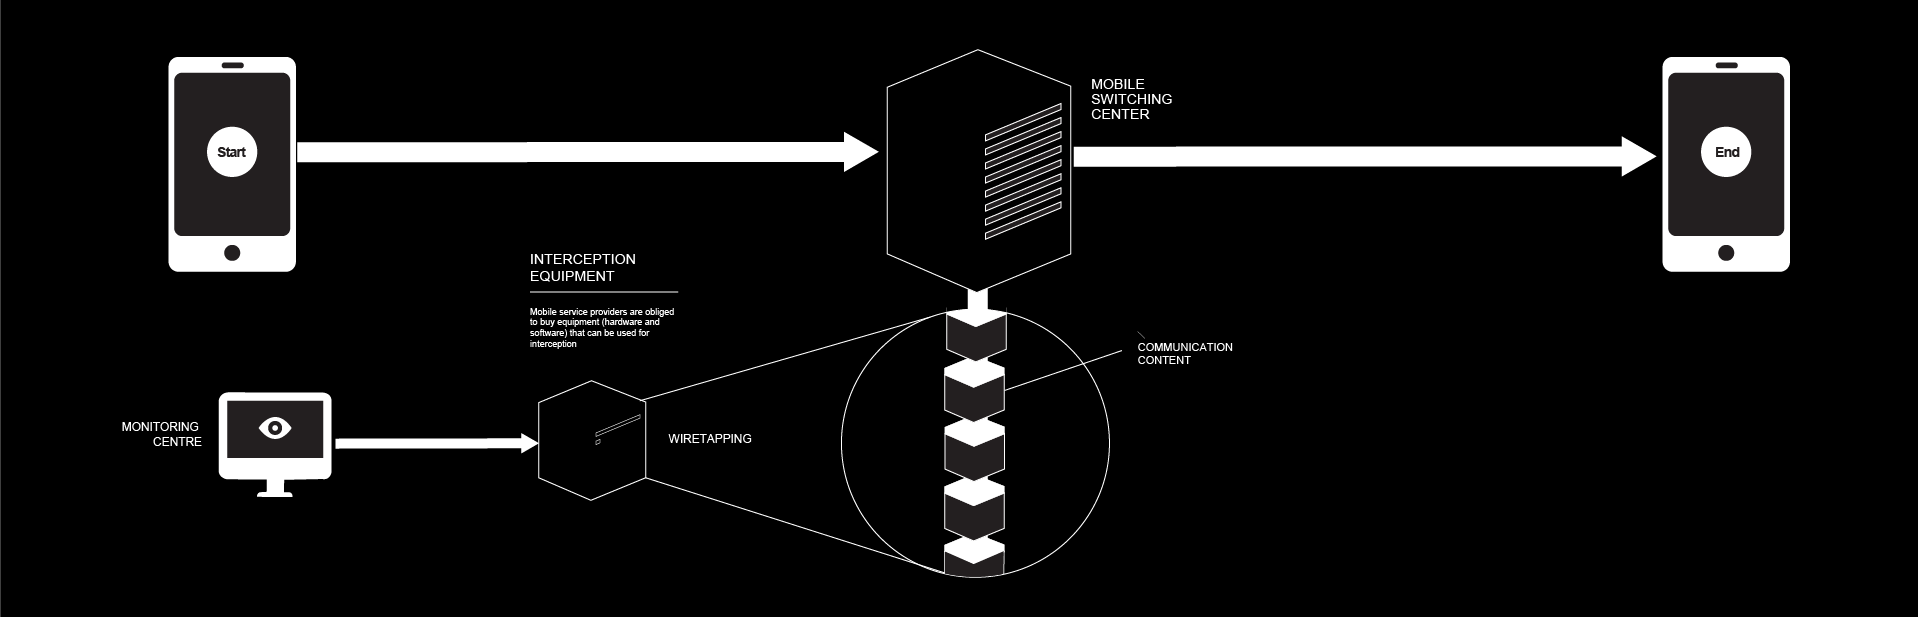
Interception of electronic communications means targeted surveillance, which can be conducted in special circumstances with appropriate court order and for a limited period of time. However, when it comes to these issues even seemingly minor flaws in the law can have serious consequences and make space for mass surveillance.
In the recent years there has been a portion of bylaws that establish the rights and obligations of carriers and state organs in regard with interception of electronic communications. These regulations are put in such way that carriers are obliged to buy equipment (hardware and software) that can be used for interception and deliver it to a Monitoring Centre, whose headquarters are within BIA. Afterwards, BIA de facto has carte blanche for operation with the equipment, whilst the carriers retain the obligation to fund the maintenance thereof. As stated above, the interception as a sensitive process is very well regulated, but the implications of the bylaws and the lack of transparency in the actual execution of the process are a sound reason to question the legitimacy of the procedure, as it is currently being established in Serbia.
![]()
Physical tracking in real time
Base stations were mentioned in the introductory segment of this piece. They form the backbone of the cellular infrastructure. Actually, it is because of the BS that the entire network is called cellular. A cell is a geographical area covered by a single BS. At any moment any mobile device is connected to three BS, for the purpose of continuity and redundancy. That means that at any moment in time three base stations send and receive signals to and from the device. Base stations are set up in such a way that record the distance to the device, which is in fact it’s location, through several parameters related to the signal, some of them are AOA (Angle of Arrival), TDOA (Time Difference of Arrival) and TOA (Time of Arrival). This basically means that anybody who has access to BS can at any moment with a high level of accuracy determine the physical/geographical location of any device connected to the network.
In Serbia, according to the bylaws mentioned in the previous section has access to a special terminal equipment for tracking of devices. Furthermore, there are custom-made mobile devices that are configured in a way that they can be used for geo-tracking in real time. This mobile devices are issued by the carrier to the state organs upon request. Which means that anyone who has access to that terminal equipment (meaning that it’s entirely up to BIA how it will be used) can precisely locate any mobile device connected to a network in Serbia59.
]]>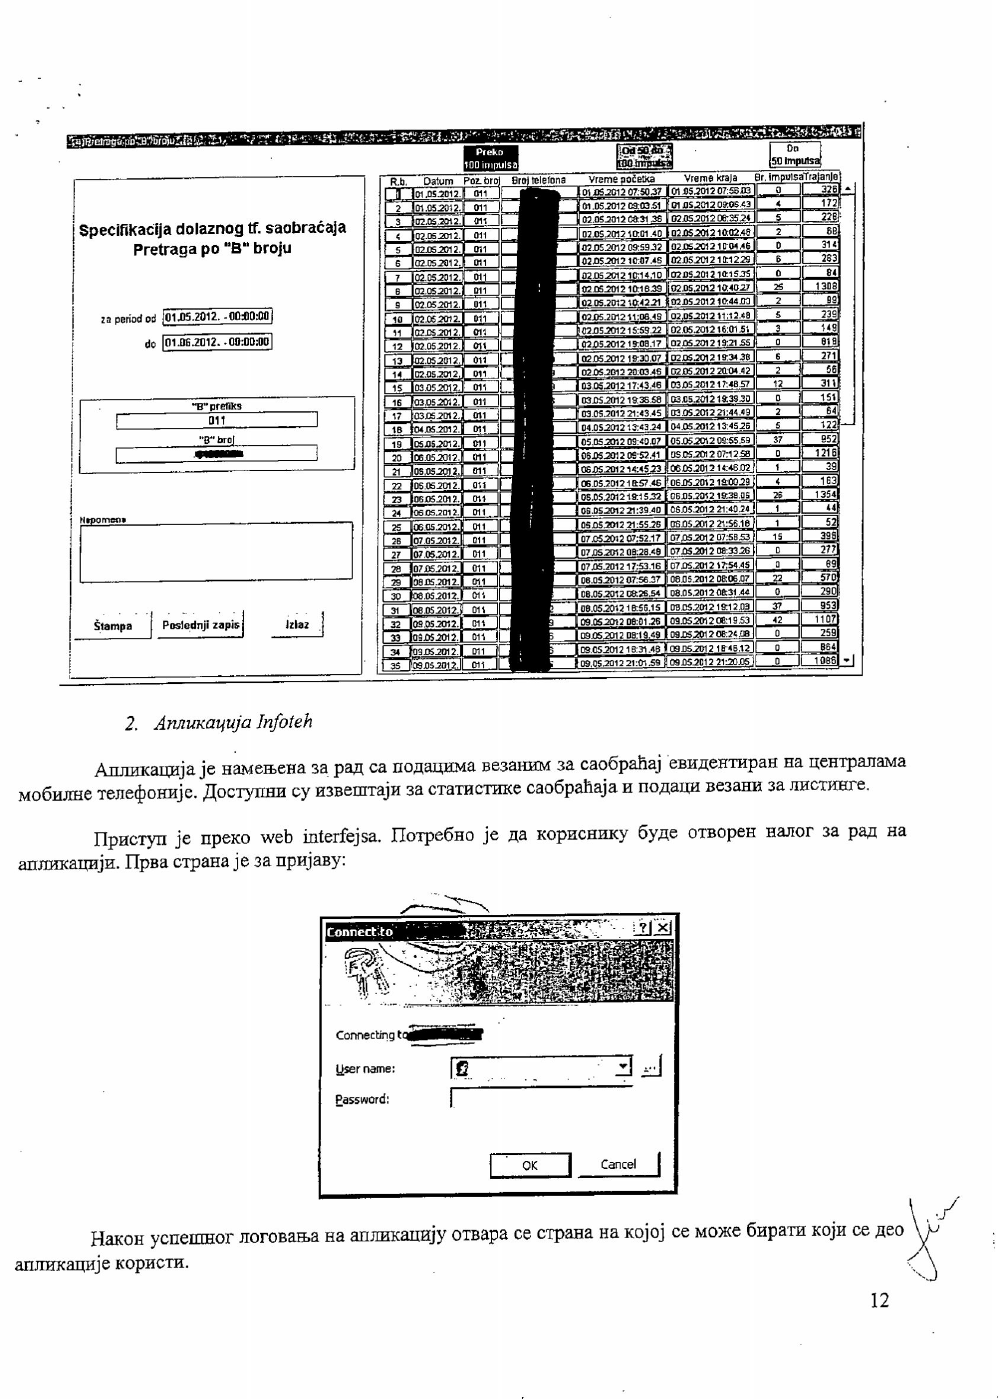
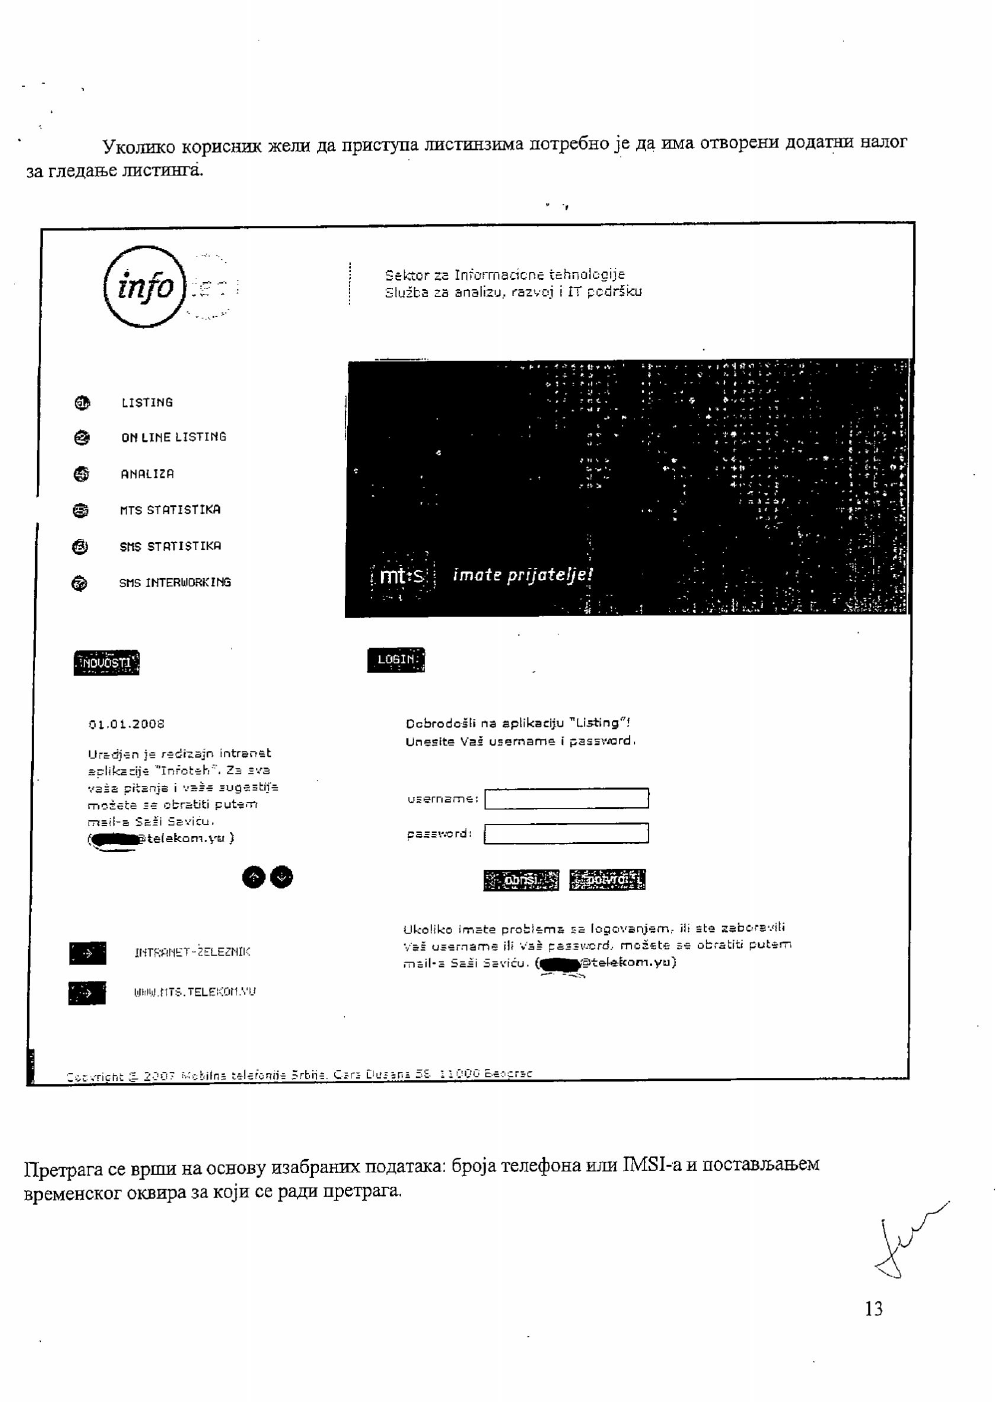
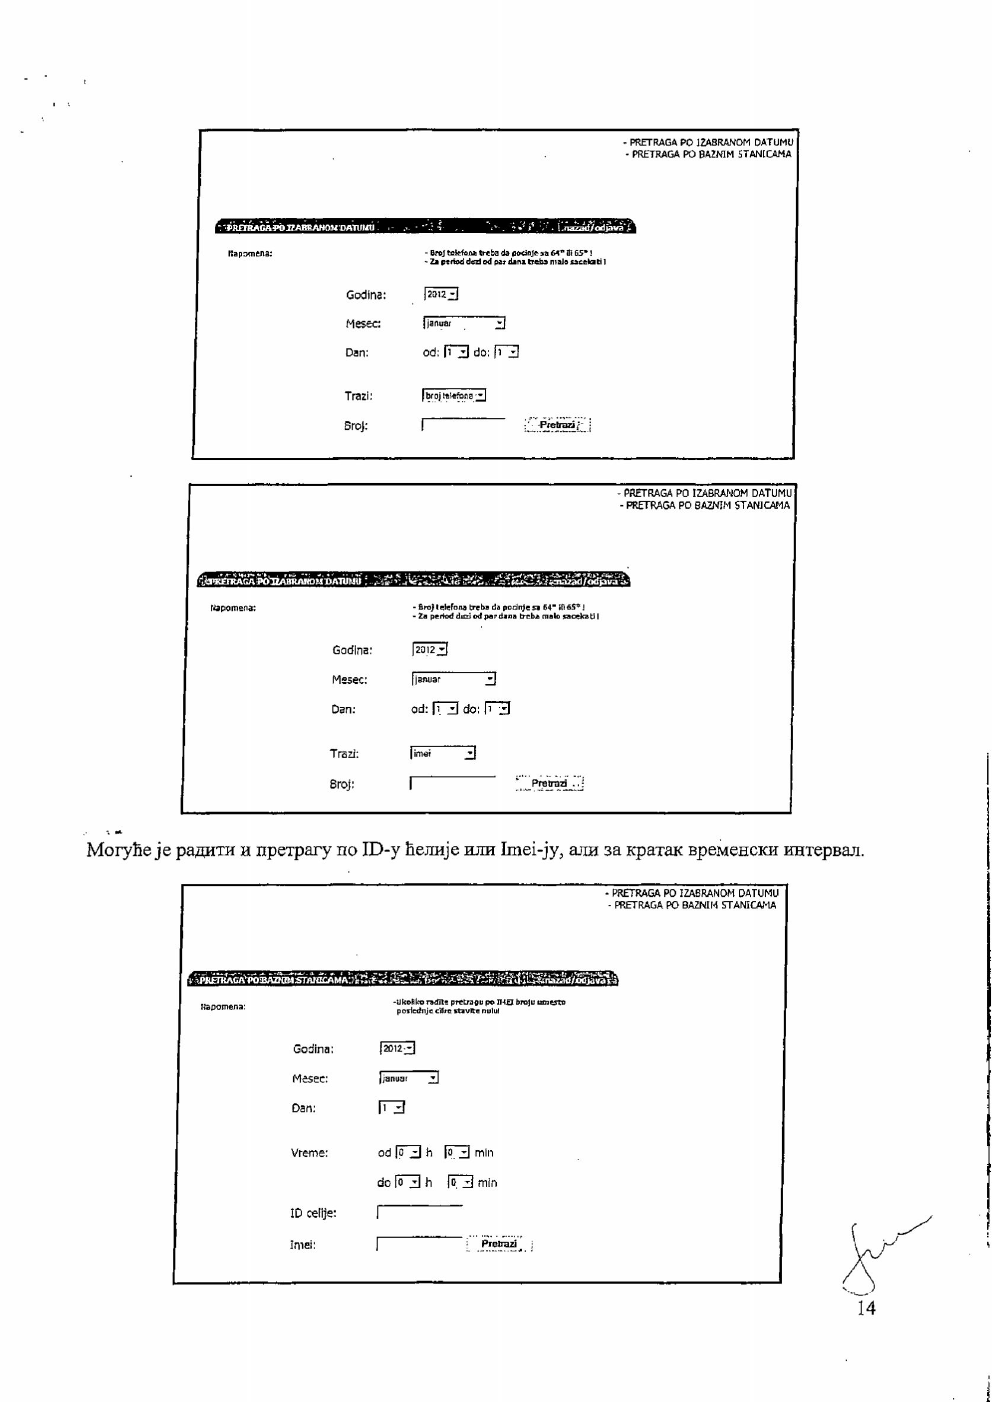
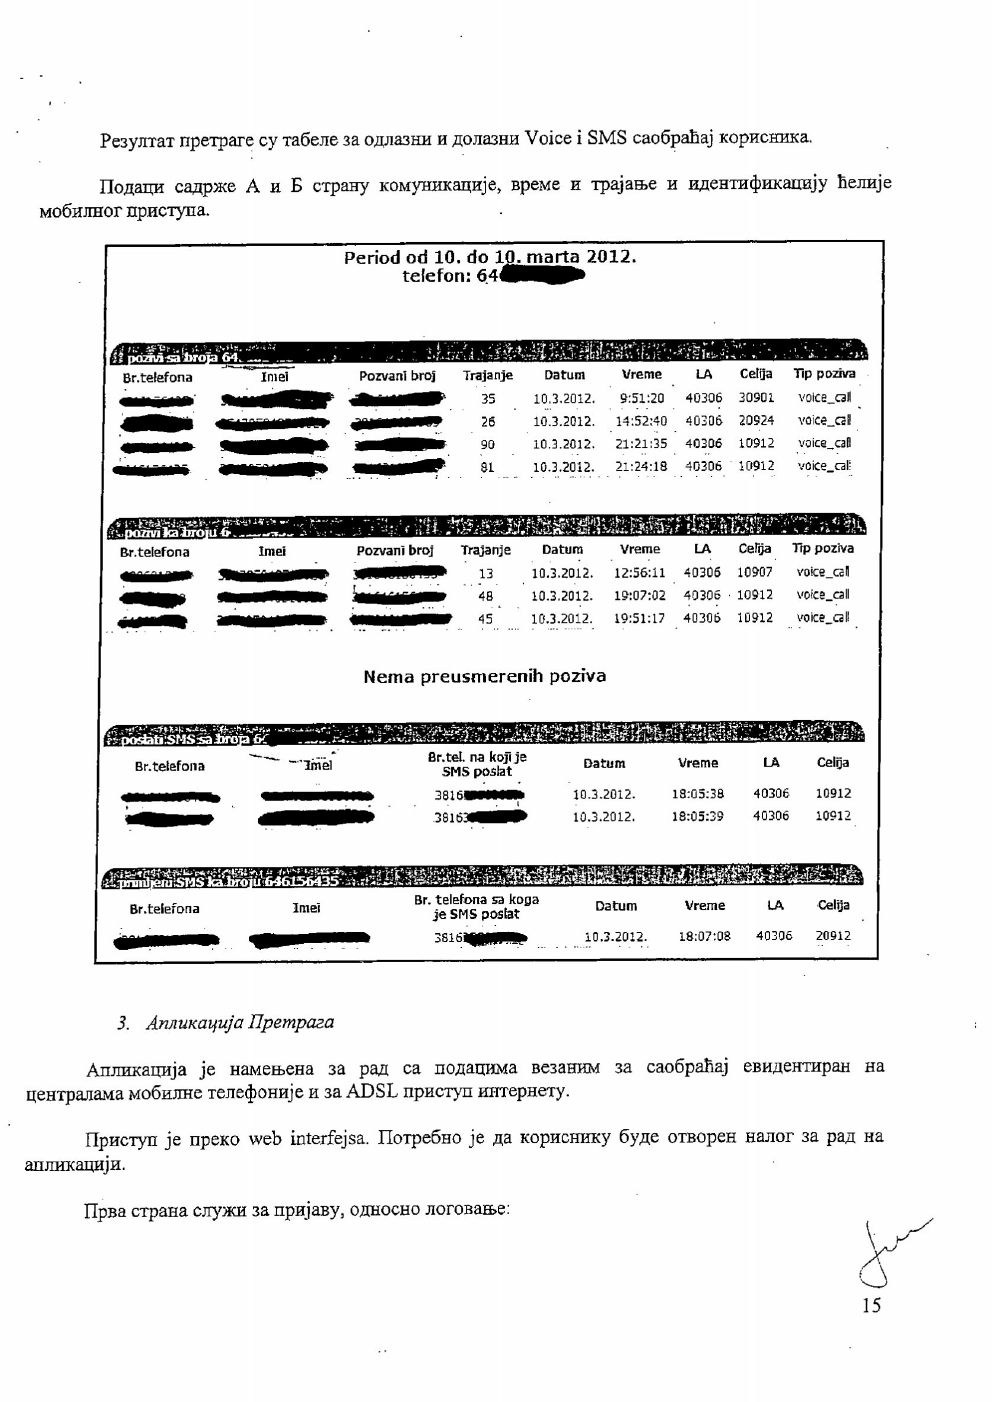
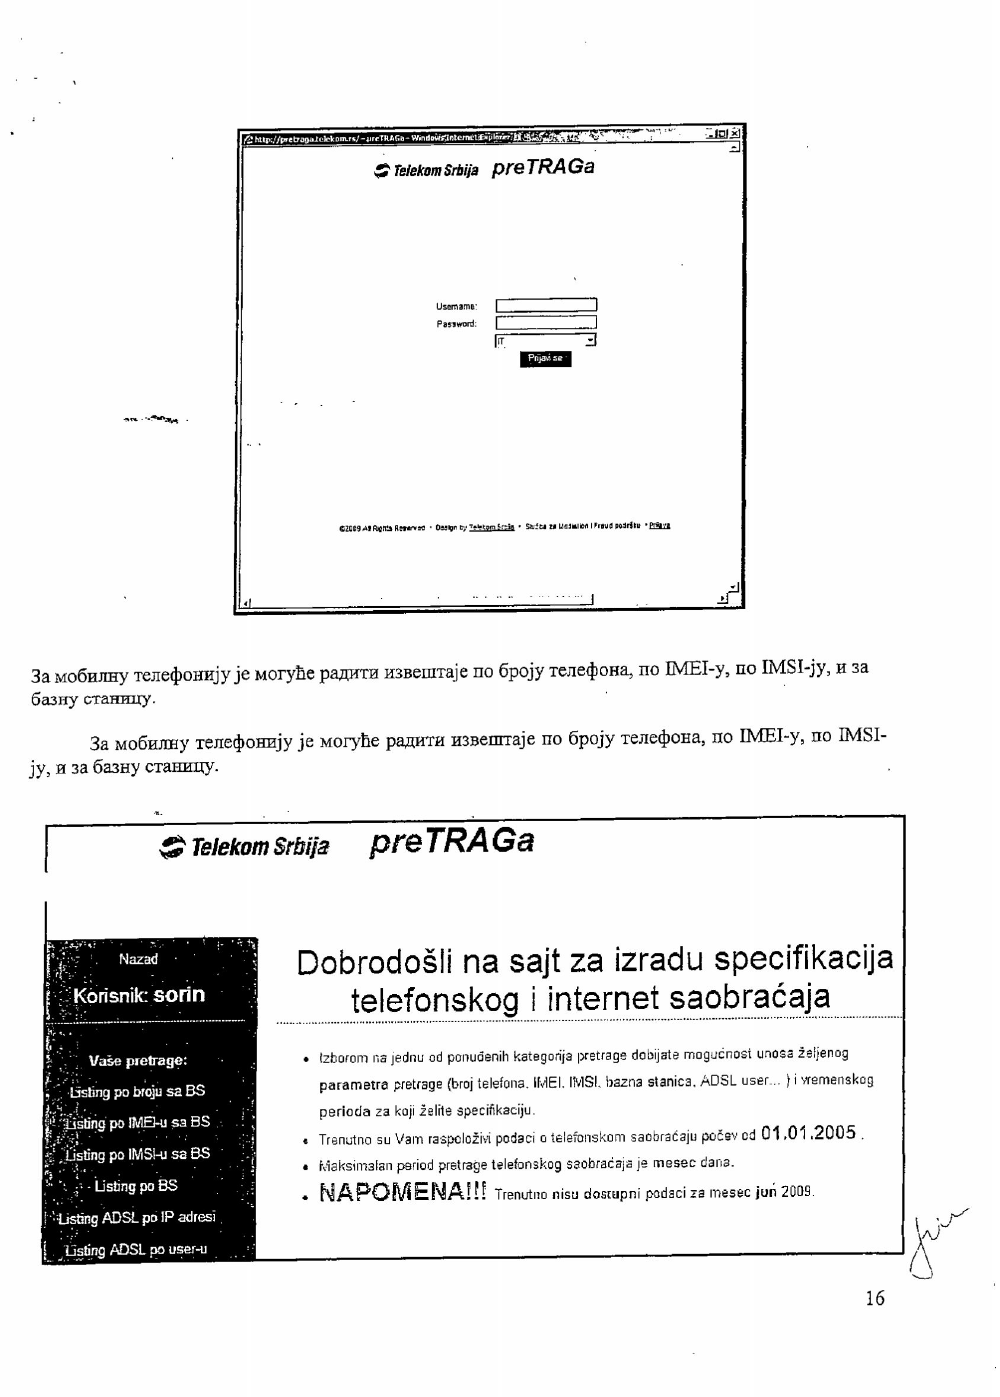
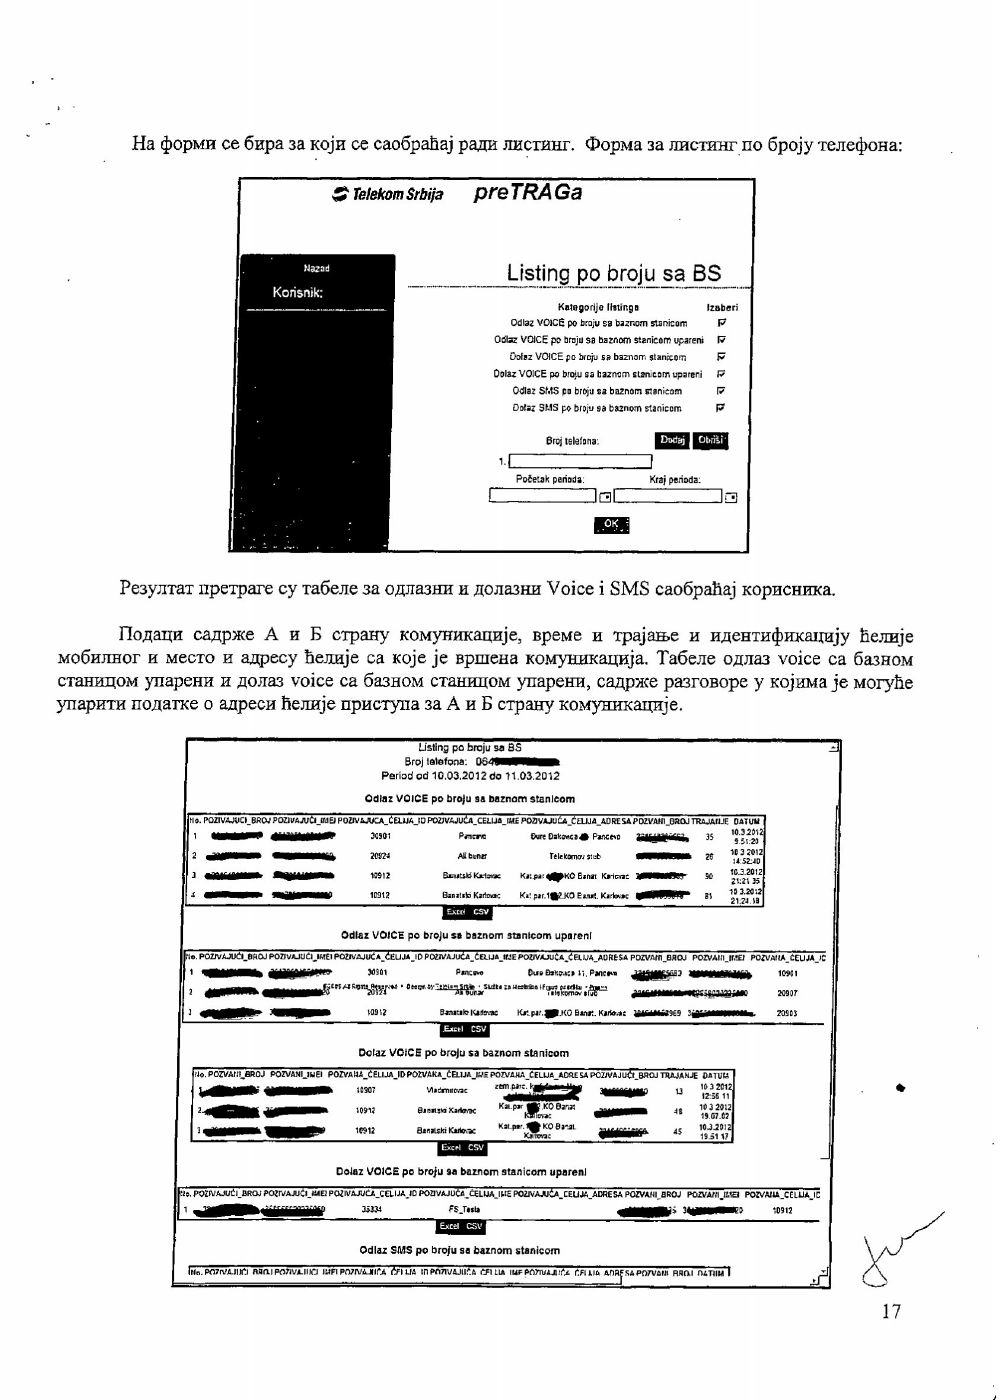
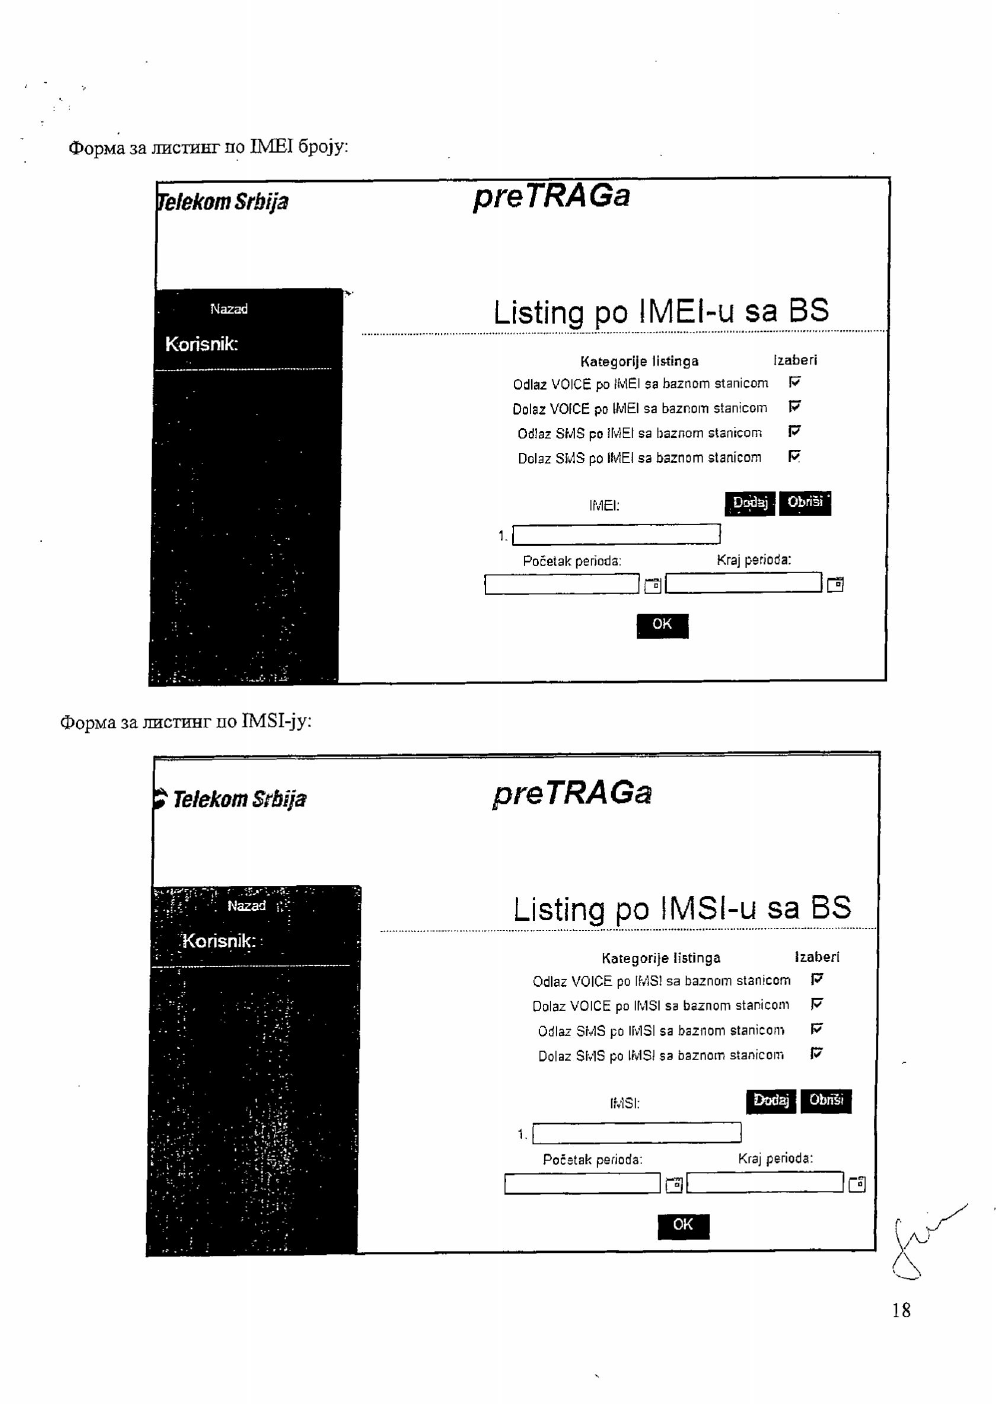
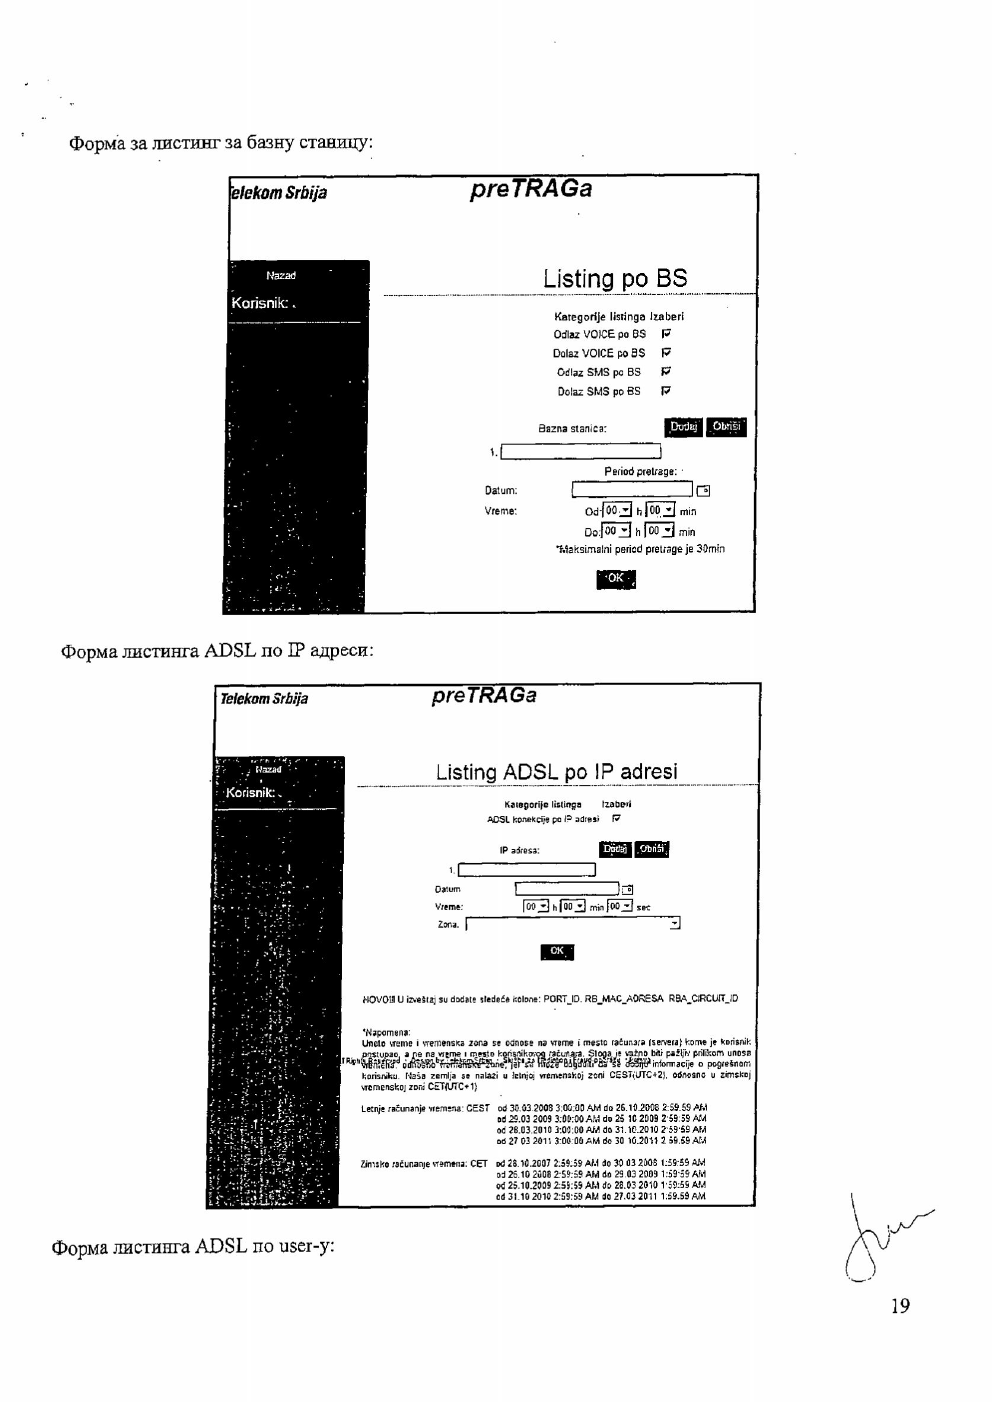
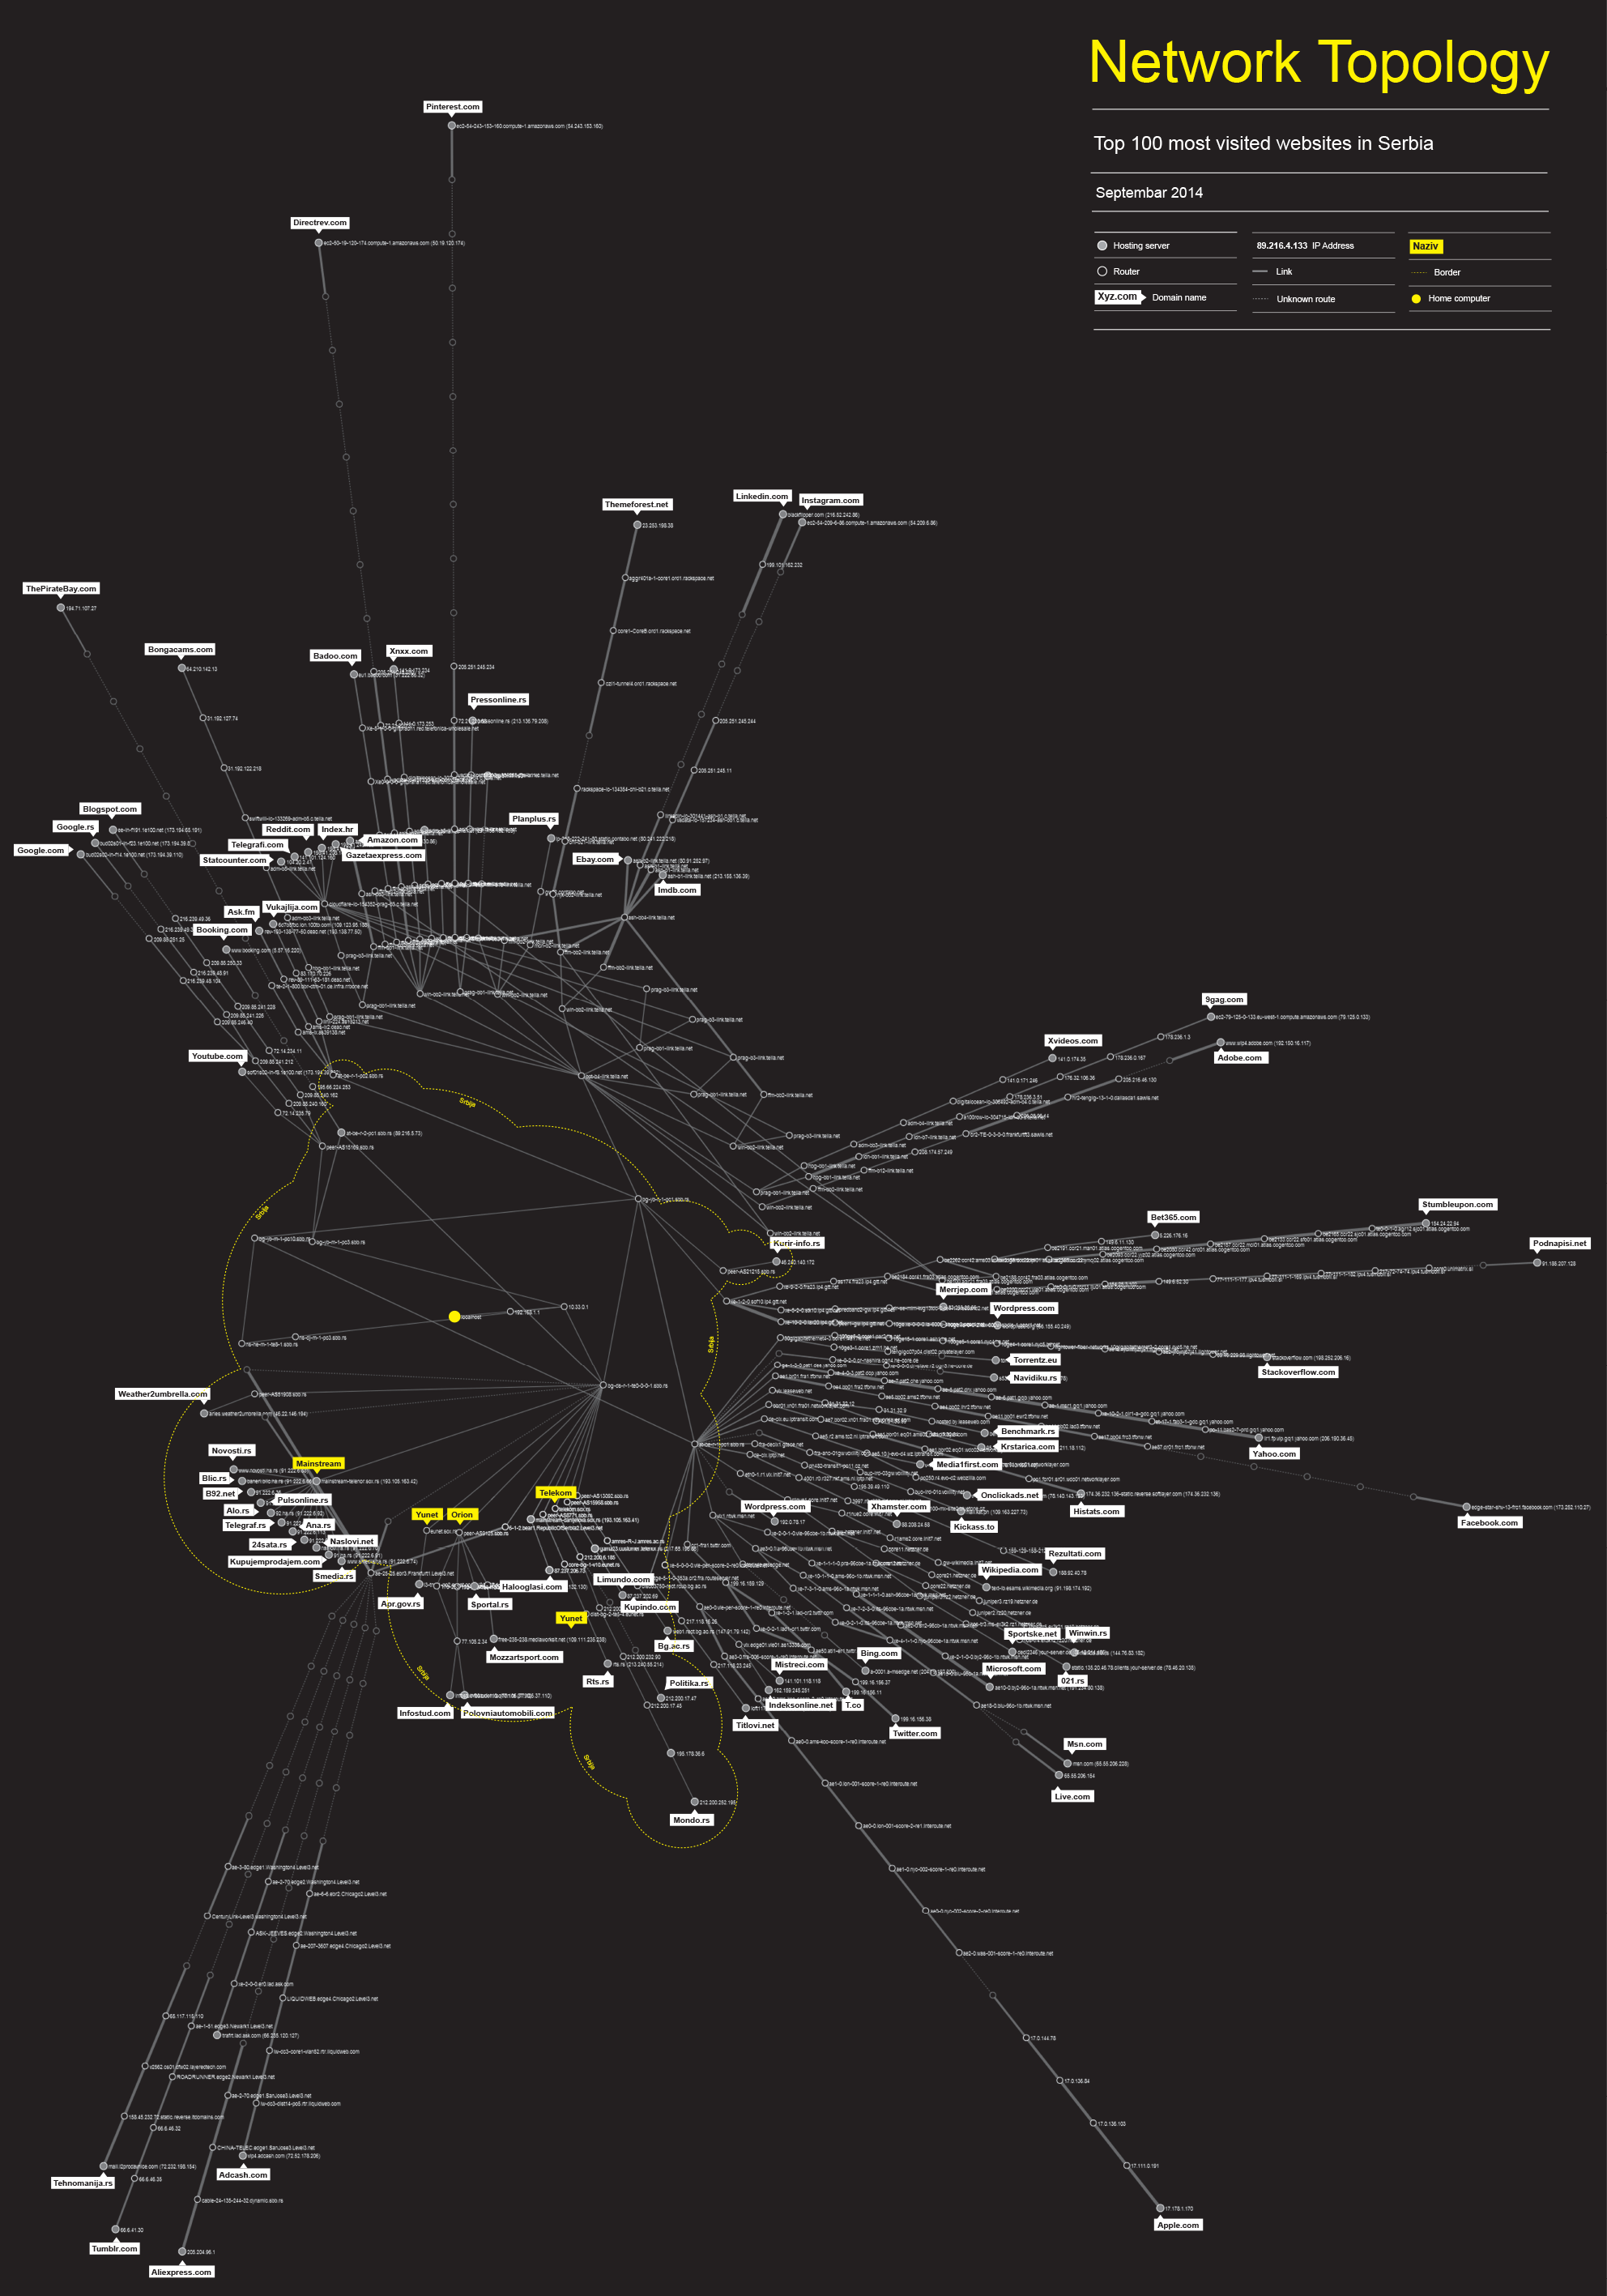
We used Nmap, an open source network security scanner for network exploration to traceroute and visualize the paths to the top 100 websites visited by users in Serbia58 according to the Alexa, Web Analytics company owned by Amazon. Similar to our previous maps, every dot represents one IP address (router or other network device) and the lines between the dots are the links – cables that connect them.
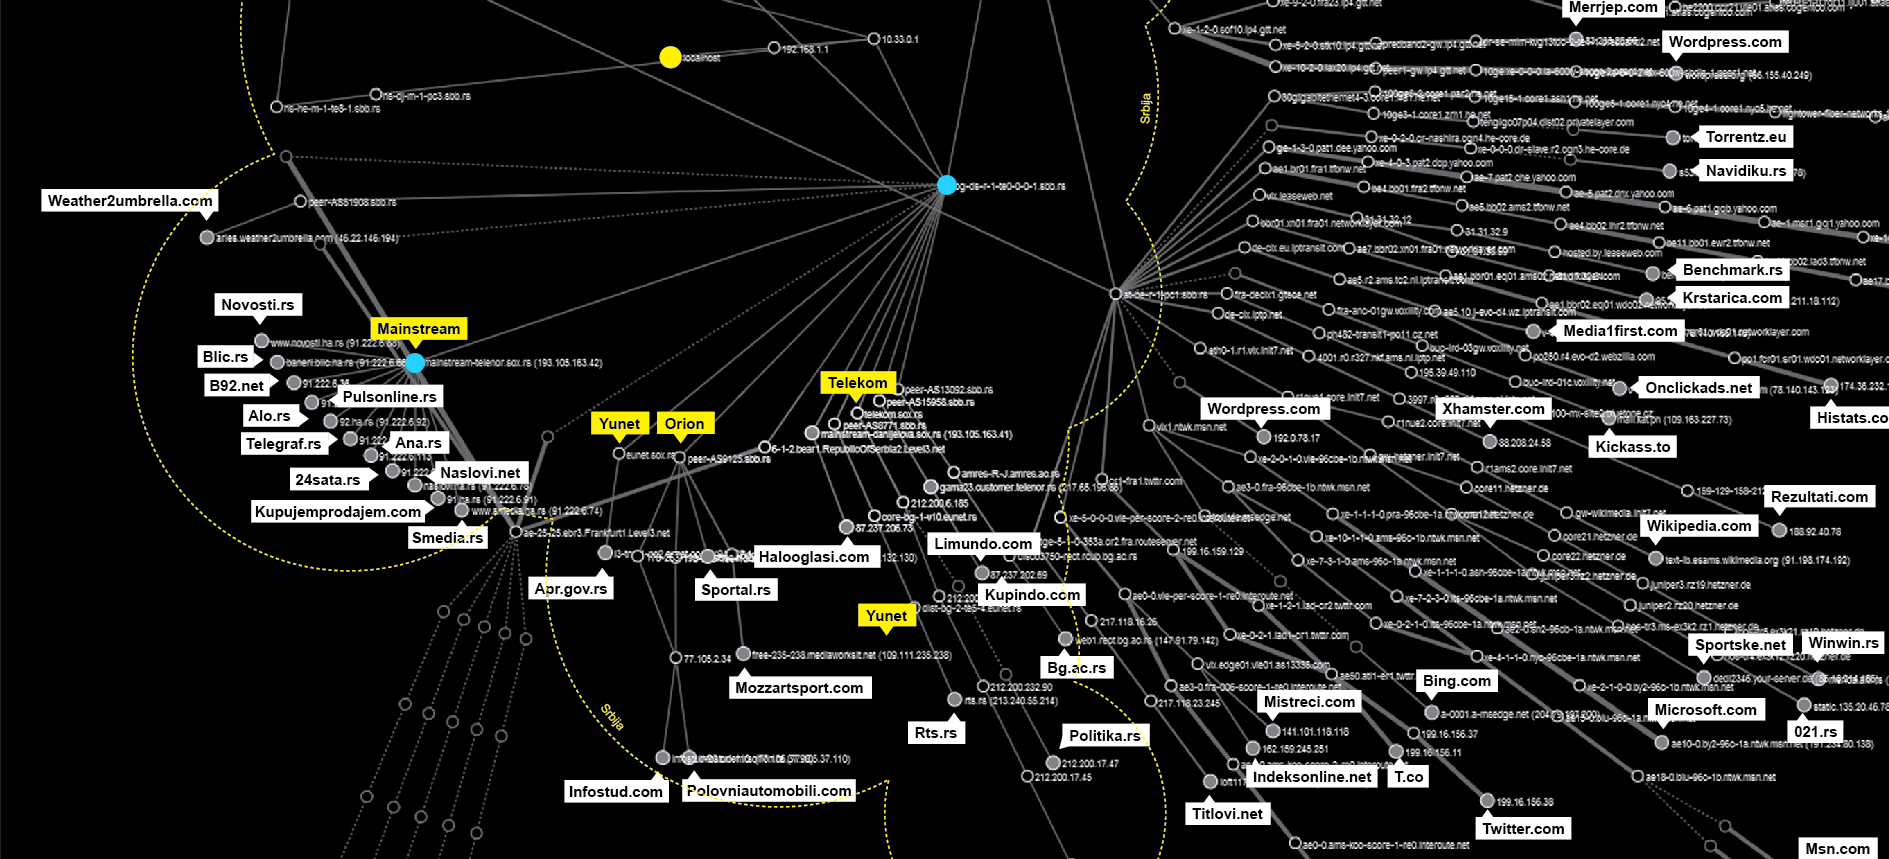
National traffic
This network journey starts at the yellow dot in the middle of the map. After a few local hops all the traffic heads towards a few points. Since our Share Lab is connected to the Internet via SBB, the biggest regional ISP, the results of this research are based on their network.
All the data travels first to their server in Belgrade at the SBB TelePark. All the traffic to the local websites goes through a single point (bg-ds-r-1-oe0-0-0-1sbb.rs).
So, in theory, if you would like to examine, filter or retain all the national traffic going through the SBB network, you would be able to do that using just this one point. In fact, SBB as well as the other ISPs in Serbia are obliged by the data retention law to do exactly that – to store all metadata about internet traffic and allow government bodies access them.
From this bottleneck of the national traffic, paths lead to different peering routers or to the Serbian Open Exchange (SOX). As we already explained in our Interconnection map of Serbia, networks, run by different Internet Service Providers, are interconnected at physical locations where their routers are connected by cables, such as in an Internet exchange points. Those are the places where different networks meet, merging different networks into a single system, allowing us to connect to other connected devices on any other network.
Local exchange points allow informations to flow more locally. Without them, internet packets would flow in different routes, and in case of no direct connection between two providers they would go through a third provider or even another country. Unfortunately, there is just one Internet Exchange Point in Serbia and most of the packets go to Belgrade from any other place in Serbia. If more local exchange points existed in different parts of the country, data would flow more locally and significantly shorten their route .
But there is another curiosity visible on this map. There is a spot on Telenor servers as a part of the SOX network (mainstream-telenor.sox.rs) that connects the most visited websites in Serbia. It belongs to Mainstream d.o.o, a company established in 2005 that provides hosting and maintenance services. More than a half of the local websites from our sample are hosted by this company. Most of them have racks with servers in three Data centers in Belgrade, but according to our map they are mostly situated at the Telenor Tier3 Data Centar.

Based on our map we can conclude that there is a high level of centralization of the local internet traffic. We can define 3 different levels of centralization :
- Centralization on the level of ISP – single point where all the traffic is routed
- Internet Exchange point level – there is just one IX in Serbia
- Hosting level – Most of the biggest websites are hosted by one single company
Points of centralization are points of power, and the more routers or ISPs meet at a single point the importance of that point, router, server increases. It is of great significance to know who has control over these points, given that those entities have influence over the internet in Serbia and, providing the opportunity, could use or misuse their power.
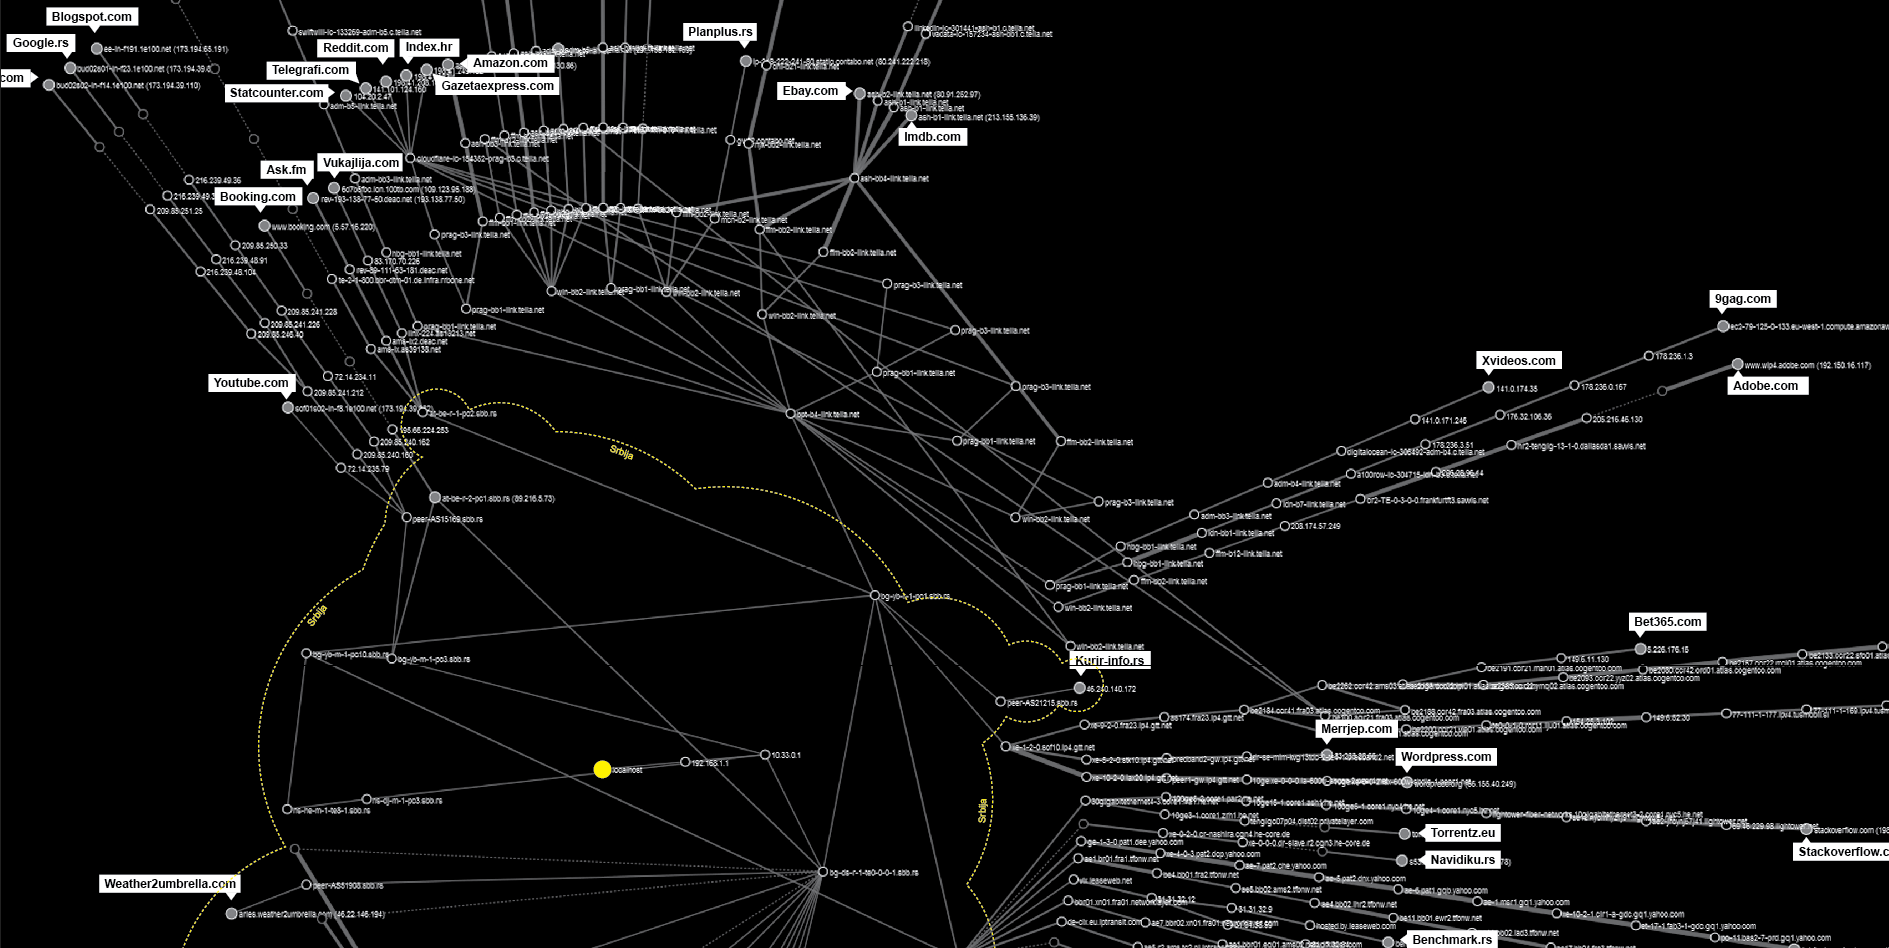
Exit points
From our findings we are able to identify few main data flow paths going out from the country. Similar to the centralization of the local flow over one single router, we have a few main spots through which our data passes before going out.
The two biggest points of centralization according to our map are:
at-be-r-1-pc1.sbb.rs, : mostly connecting to the routers related to DE-CIX in Frankfurt
bg-yo-r-1-pc1.sbb.rs : connected with bpt-b4-link.telia.net leading to the routers in Hungary and Prague
peer-A515169.sbb.rs : connected with Google owned websites
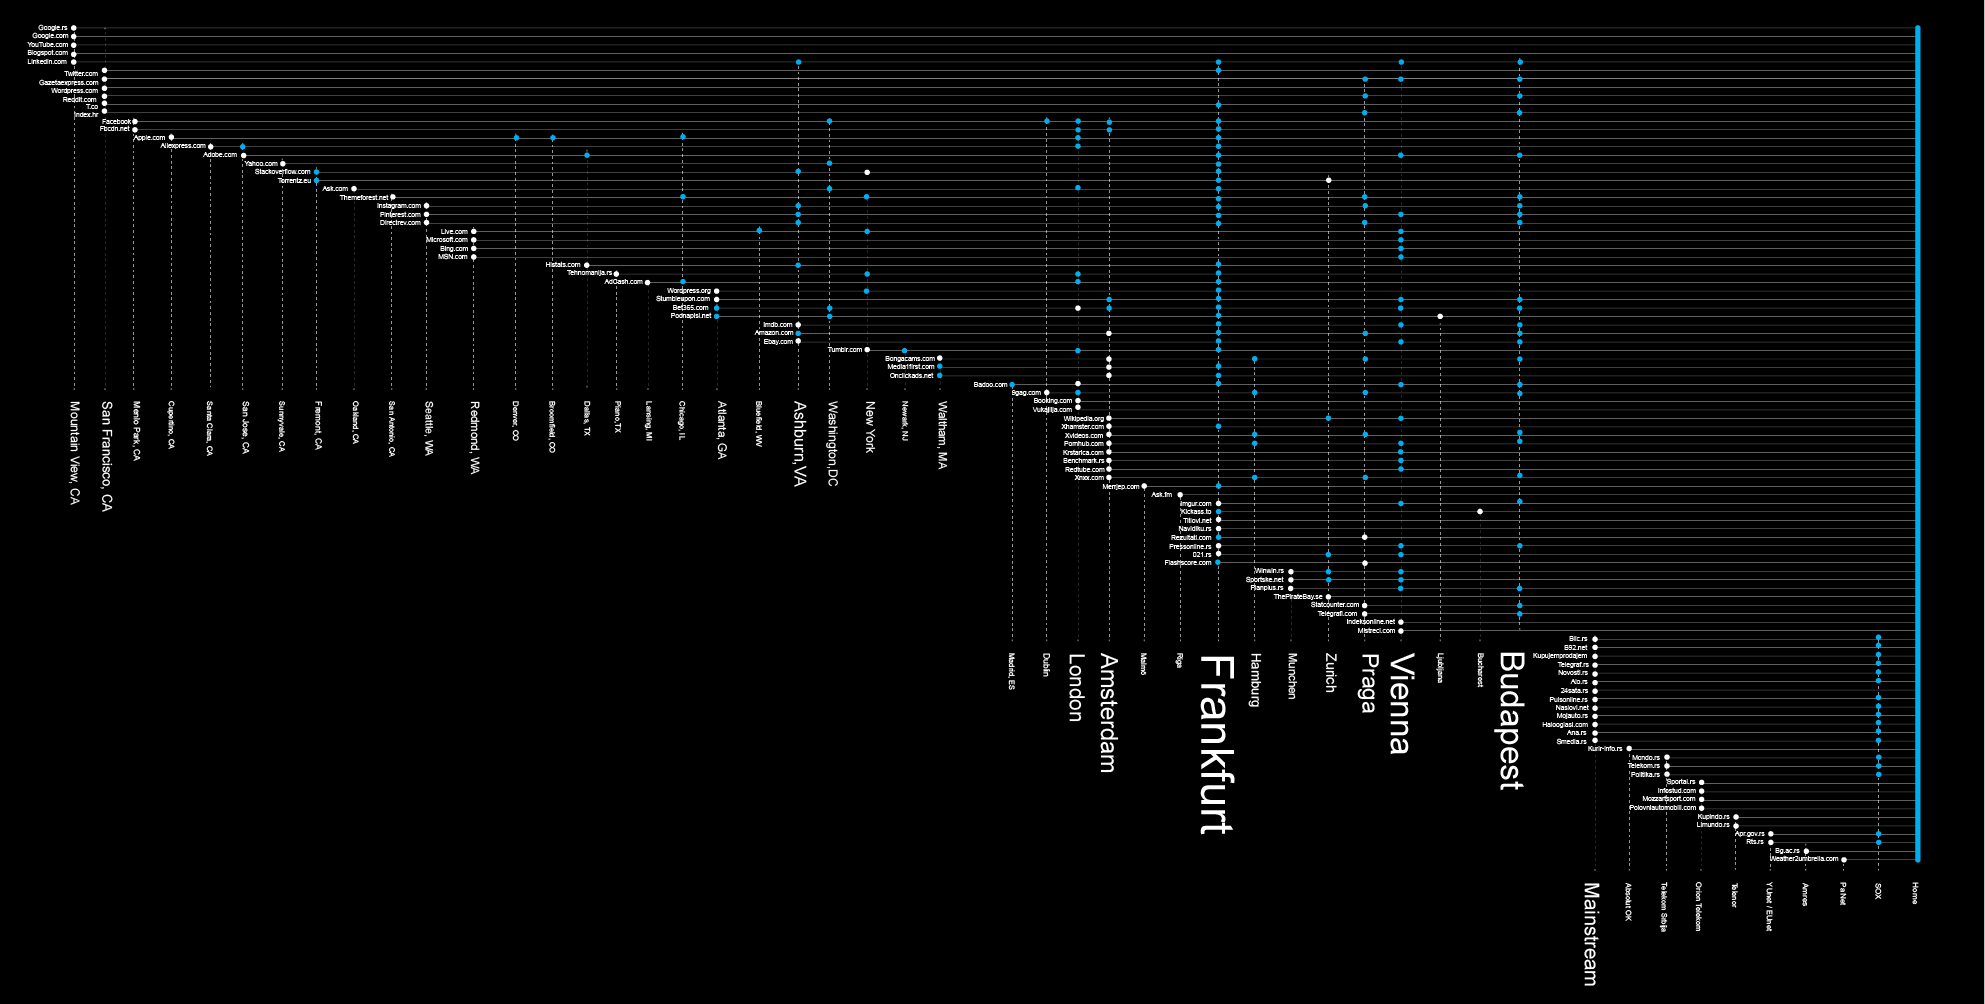
Data about Data Flow
Now that we have detected the main bottlenecks of the local internet traffic and the main exit points, let’s try to analyze the main ports and countries where our data flows to as its final destinations.
Of the total 100 most visited websites by users from Serbia, only 27 are actually hosted in Serbia. More than a half of those are hosted by a single hosting company. 63% of our Internet packets leave the country. Let’s examine where.
One big stream of data heads towards Budapest (25) ,Vienna (25) and another to Prague (15). Those are mostly transit ports, that transfer data further to Germany, the Netherlands , the UK or Switzerland.
Frankfurt, Germany, is by far the capital of our data flow, the biggest transit port of our data. Half of our packets pass through this city at some moment, mostly through the DE-C IX Internet Exchange Point. This place is not just the biggest gathering point for all internet packets that come from Serbia, but the biggest Internet Exchange place in the World, connecting more than 600 ISPs.
Even though Frankfurt is a transit capital, not a lot of data is actually hosted there. The biggest share of our sample websites that are hosted in Europe are situated in Amsterdam. Another interesting fact is that more than half of those 11 websites are related to pornography. This is the red light district of the Internet’s second biggest port.
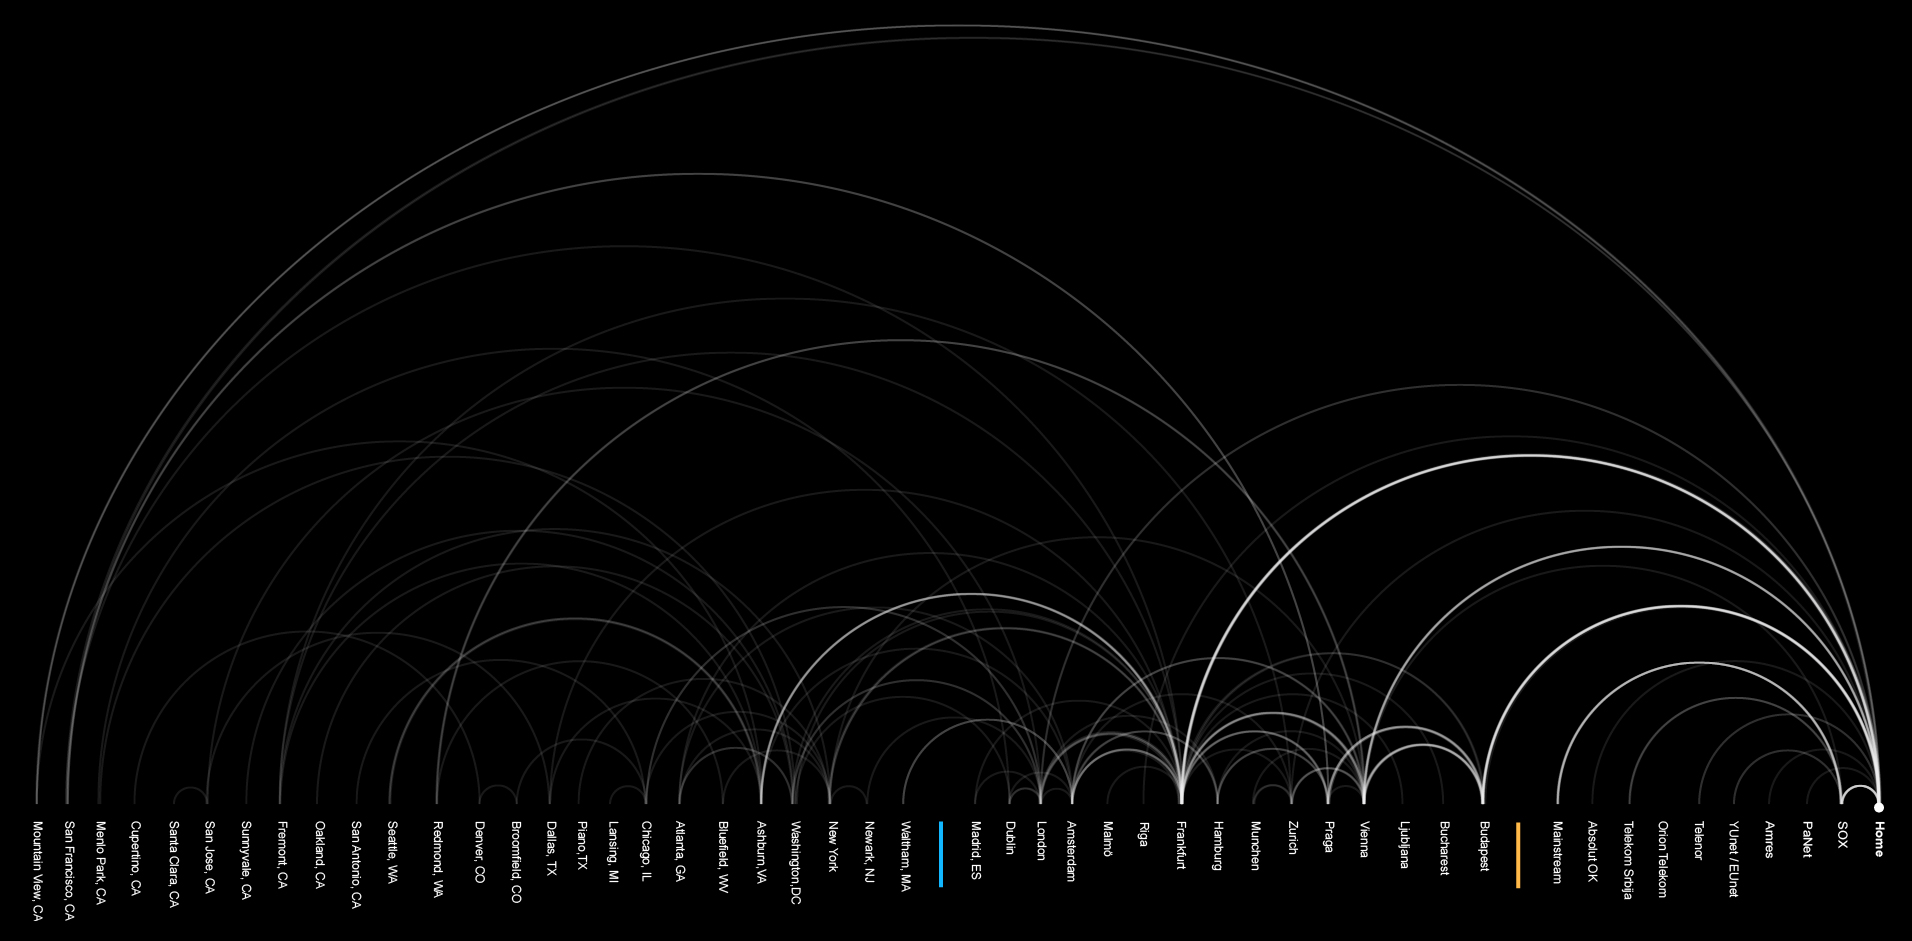
36% of our visits head over the Atlantic ocean to the US. Unlike the case of European countries where most of the data is in transit, here the data is hosted.
When looking at the overall picture regarding hosting of the most visited websites by internet users from Serbia, the conclusion that can be drawn is that the US’ hosting providers are dominant over the EU’s and Serbia’s (36% US, 27% EU, 27% RS).
Regarding data transfer, the most important location on the US East coast is Ashburn, Northern Virginia – one of the Internet’s capitals, home to a large number of data centers, a strategic communications hub for the eastern United States, a major communications gateway to Europe and the largest Internet peering point in North America.
Regarding the results of our research, the concentration of the final destinations of our Internet packets is dense on the West coast, especially around San Francisco and the Silicon Valley. But what we can not be sure of is whether this is the final destination or just a mask. The findings of our other research say that the exact locations are somewhere else, mostly around Northern Virginia, where big data centers of Google, Facebook and Amazon are located.
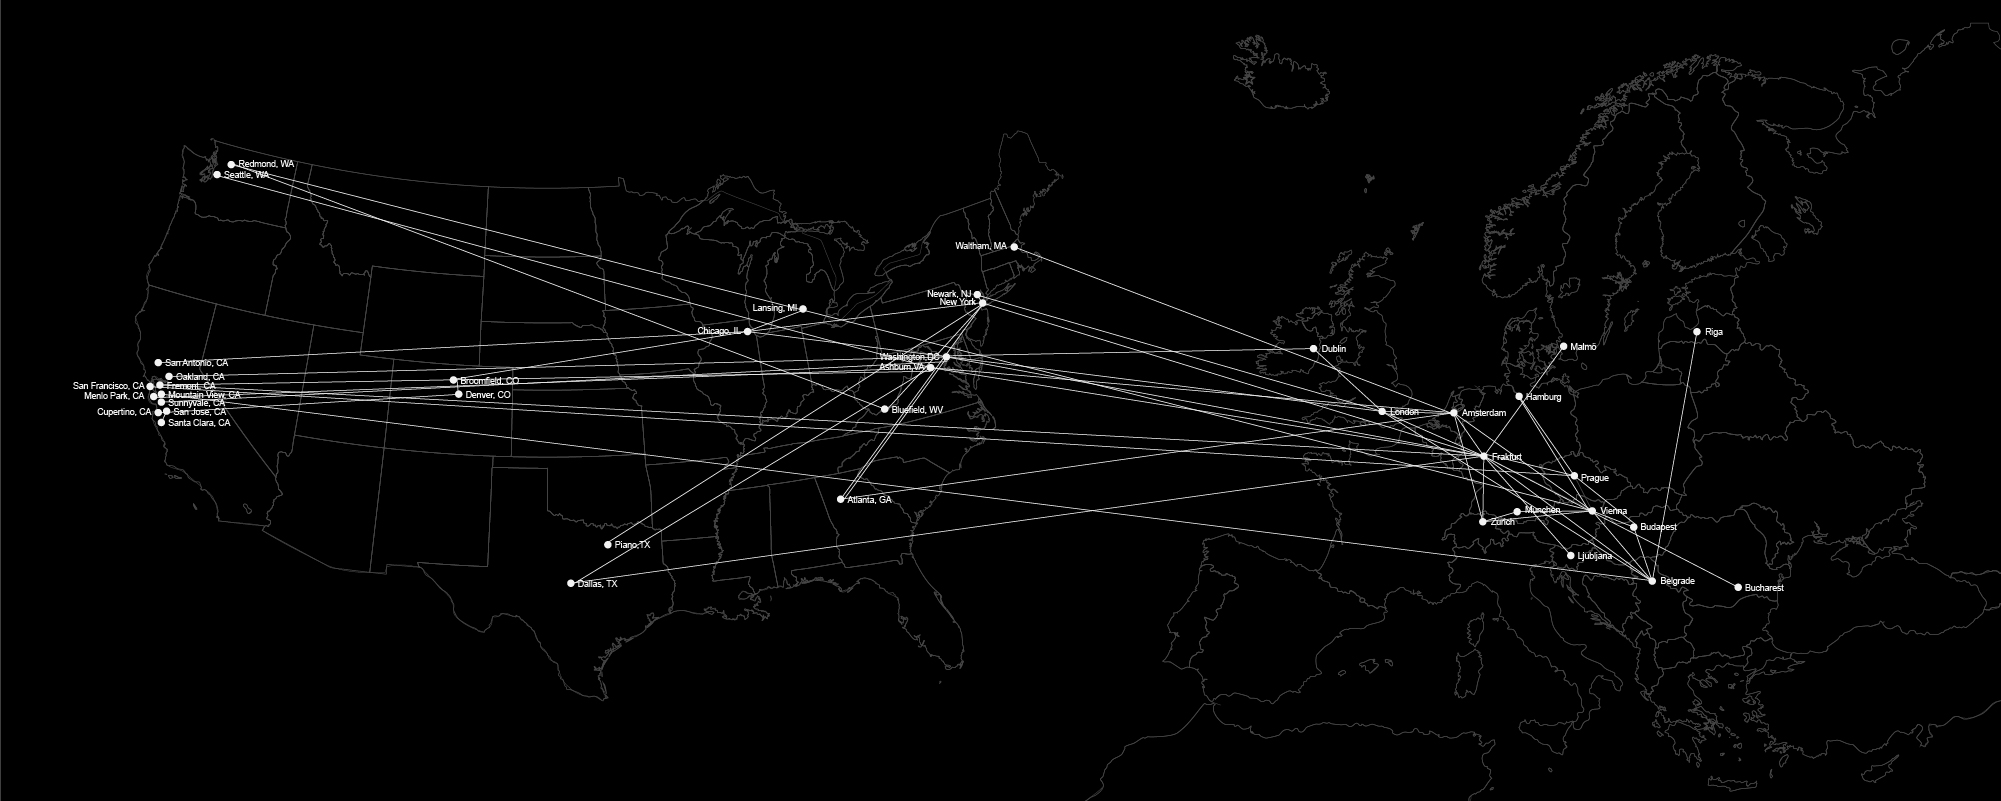
According to our research, it seems that the Internet we use is not such a decentralized place after all.
Based on our sample, the Internet we use consists of main data transit and hosting sites, capitals of data flow, situated in only 13 countries, where our data either flows through or ends its’ journey. This structure is very different from the original idea of a mash, decentralized network, conceptualized in the beginnings of the Internet.
On the other hand, none of the websites from the list of the top 100 visited are outside of Europe and the US, not even from the region.
National borders of the Internet
For the purpose of this research, we can examine two different types of “borders” that exist on the Internet. The existence of the first type is consequential to the fact that in order to operate in a certain country, Internet Service Providers are obliged to act in accordance with different national laws and regulations. The fact that physical infrastructure, i.e. cables, routers, switches and servers are located on the territory of one country and that this infrastructure is owned and managed by a legal entity (company or institution), subjected to national regulations, directly points to links between the state, Internet Service Providers and the data traveling through the networks. For example, Internet Service Providers operating on the territory of Serbia are obliged by the Serbian Law on Electronic Communications to keep all the metadata and give different state institutions access to this data. In order to ensure their customers access to the entire Internet, ISPs have different interconnection points with providers in other, usually neighboring countries. Data, while traveling from one ISP to another, crosses the theoretical border point where one state jurisdiction ends and another starts. Borders applicable to the Internet are the same as the ones found in the “real” world. Internet Service Providers are the gatekeepers of the Internet and therefore any potential form of state censorship, filtering or throttling of traffic is most likely be conducted in cooperation with them. Mapping interconnection points of national and international providers and analysis of the network topology structure allow us to better understand the key points of this infrastructure, where potential Internet censorship, filtering or traffic throttling could happen.
The second type of borders relevant to our research are those created by websites, Internet platforms or applications themselves. Every device connected to the Internet in order to communicate with other devices has an IP address. Even though IP addresses are more logical rather than physical, using only the IP address one could easily determine the country in which the device is located. The reason for this is that the IP addresses are assigned to users by a single authority called IANA (Internet Assigned Numbers Authority), which assigns the ranges of IP addresses to entities interested in buying them, but keeps a database as for which range belongs to whom and other data including to which country is the certain range connected. Because of this, websites, internet platforms or applications are able to detect from which country you are visiting and allow or block your access to the content or service. Reasons for blocking of access on the national level to the content varies from different intellectual property and copyright issues to the blocking of sexual, political or religious content under the pressure from different governments worldwide. In this case, the role of the gatekeeper is played by the companies that own websites or applications. You’ve probably already seen a message like this on sites such as YouTube: “This content is not available in your country”.
Data Flow and privacy
All the ISPs in Serbia and in the most of European Union countries are still legally obliged to store metadata. By storing and analyzing metadata, ISPs and government bodies are able to trace and identify the source and the destination, the date, time, duration and the type of communication. Even without access to the content, metadata reveals private information – sometimes much more than the content would.
Appearing in a video conference call in September 2014, Edward Snowden explained: “Metadata is extraordinarily intrusive. As an analyst, I would prefer to be looking at metadata than looking at content, because it’s quicker and easier, and it doesn’t lie… If I’m listening to your phone call, you can try to talk around things, you can use code words. But if I’m looking at your metadata, I know which number called which number. I know which computer talked to which computer”. Stewart Baker, former General Counsel of the National Security Agency (NSA), said: “Metadata absolutely tells you everything about somebody’s life. If you have enough metadata, you don’t really need content.” How much do the terms you google, all the subjects of your emails, the network of people you communicate with, websites you visit, your location and communication habits reveal about your private or professional life? Metadata analysis is much more intrusive and efficient than for example traditional surveillance techniques practiced by Stasi in former East Germany, described as one of the most effective and repressive intelligence and secret police agencies to ever have existed, employing by some estimations between 500,000 and 2 million occasional informants.
But, without metadata, communication on the Internet as we know it today would not be possible. In order for communication to be possible, we give consent to ISPs to handle and process our data and metadata, and at the same time by living in Serbia or the EU, under the data retention laws, we have agreed that our metadata is being stored, accessed and analyzed by different government bodies. On the other hand, information is the resource driving the Internet industry. The business models of the biggest Internet companies are based on collecting and analyzing our private information and automated profiling in order to sell targeted ads.
Having this in mind, our initial interest in this research was to try to better understand the invisible networks and mechanisms underlying those processes. In our previous work, the focus was more on the legal aspects and analysis of different cases of violation of human rights online, mostly related to privacy and freedom of expression. In order to achieve progress, we believe that we should try to examine and understand technical reality and processes well hidden under the surface of device screens, the complex and invisible mix of software and hardware layers consisting of infinite lines of code and vast amounts of cables, routers and servers.
]]>There was of course no way of knowing whether you were being watched at any given moment. How often, or on what system, the Thought Police plugged in on any individual wire was guesswork. It was even conceivable that they watched everybody all the time.
Nineteen Eighty-four, (George Orwell)
As you are connected to the network, information about your behavior is being continuously collected, stored and analyzed by numerous algorithms created to serve different goals for their owners. The market for the analysis of large sets of data is growing by 40% per year worldwide60 and data about our behavior, our interests, our preferences is for sure one of the most valuable set of data out there.
In this research, our main goal is to dive a bit deeper than the surface of the web and websites we visit and explore the network of hidden beneficiaries, companies that are collecting and analyzing data about our online behavior.
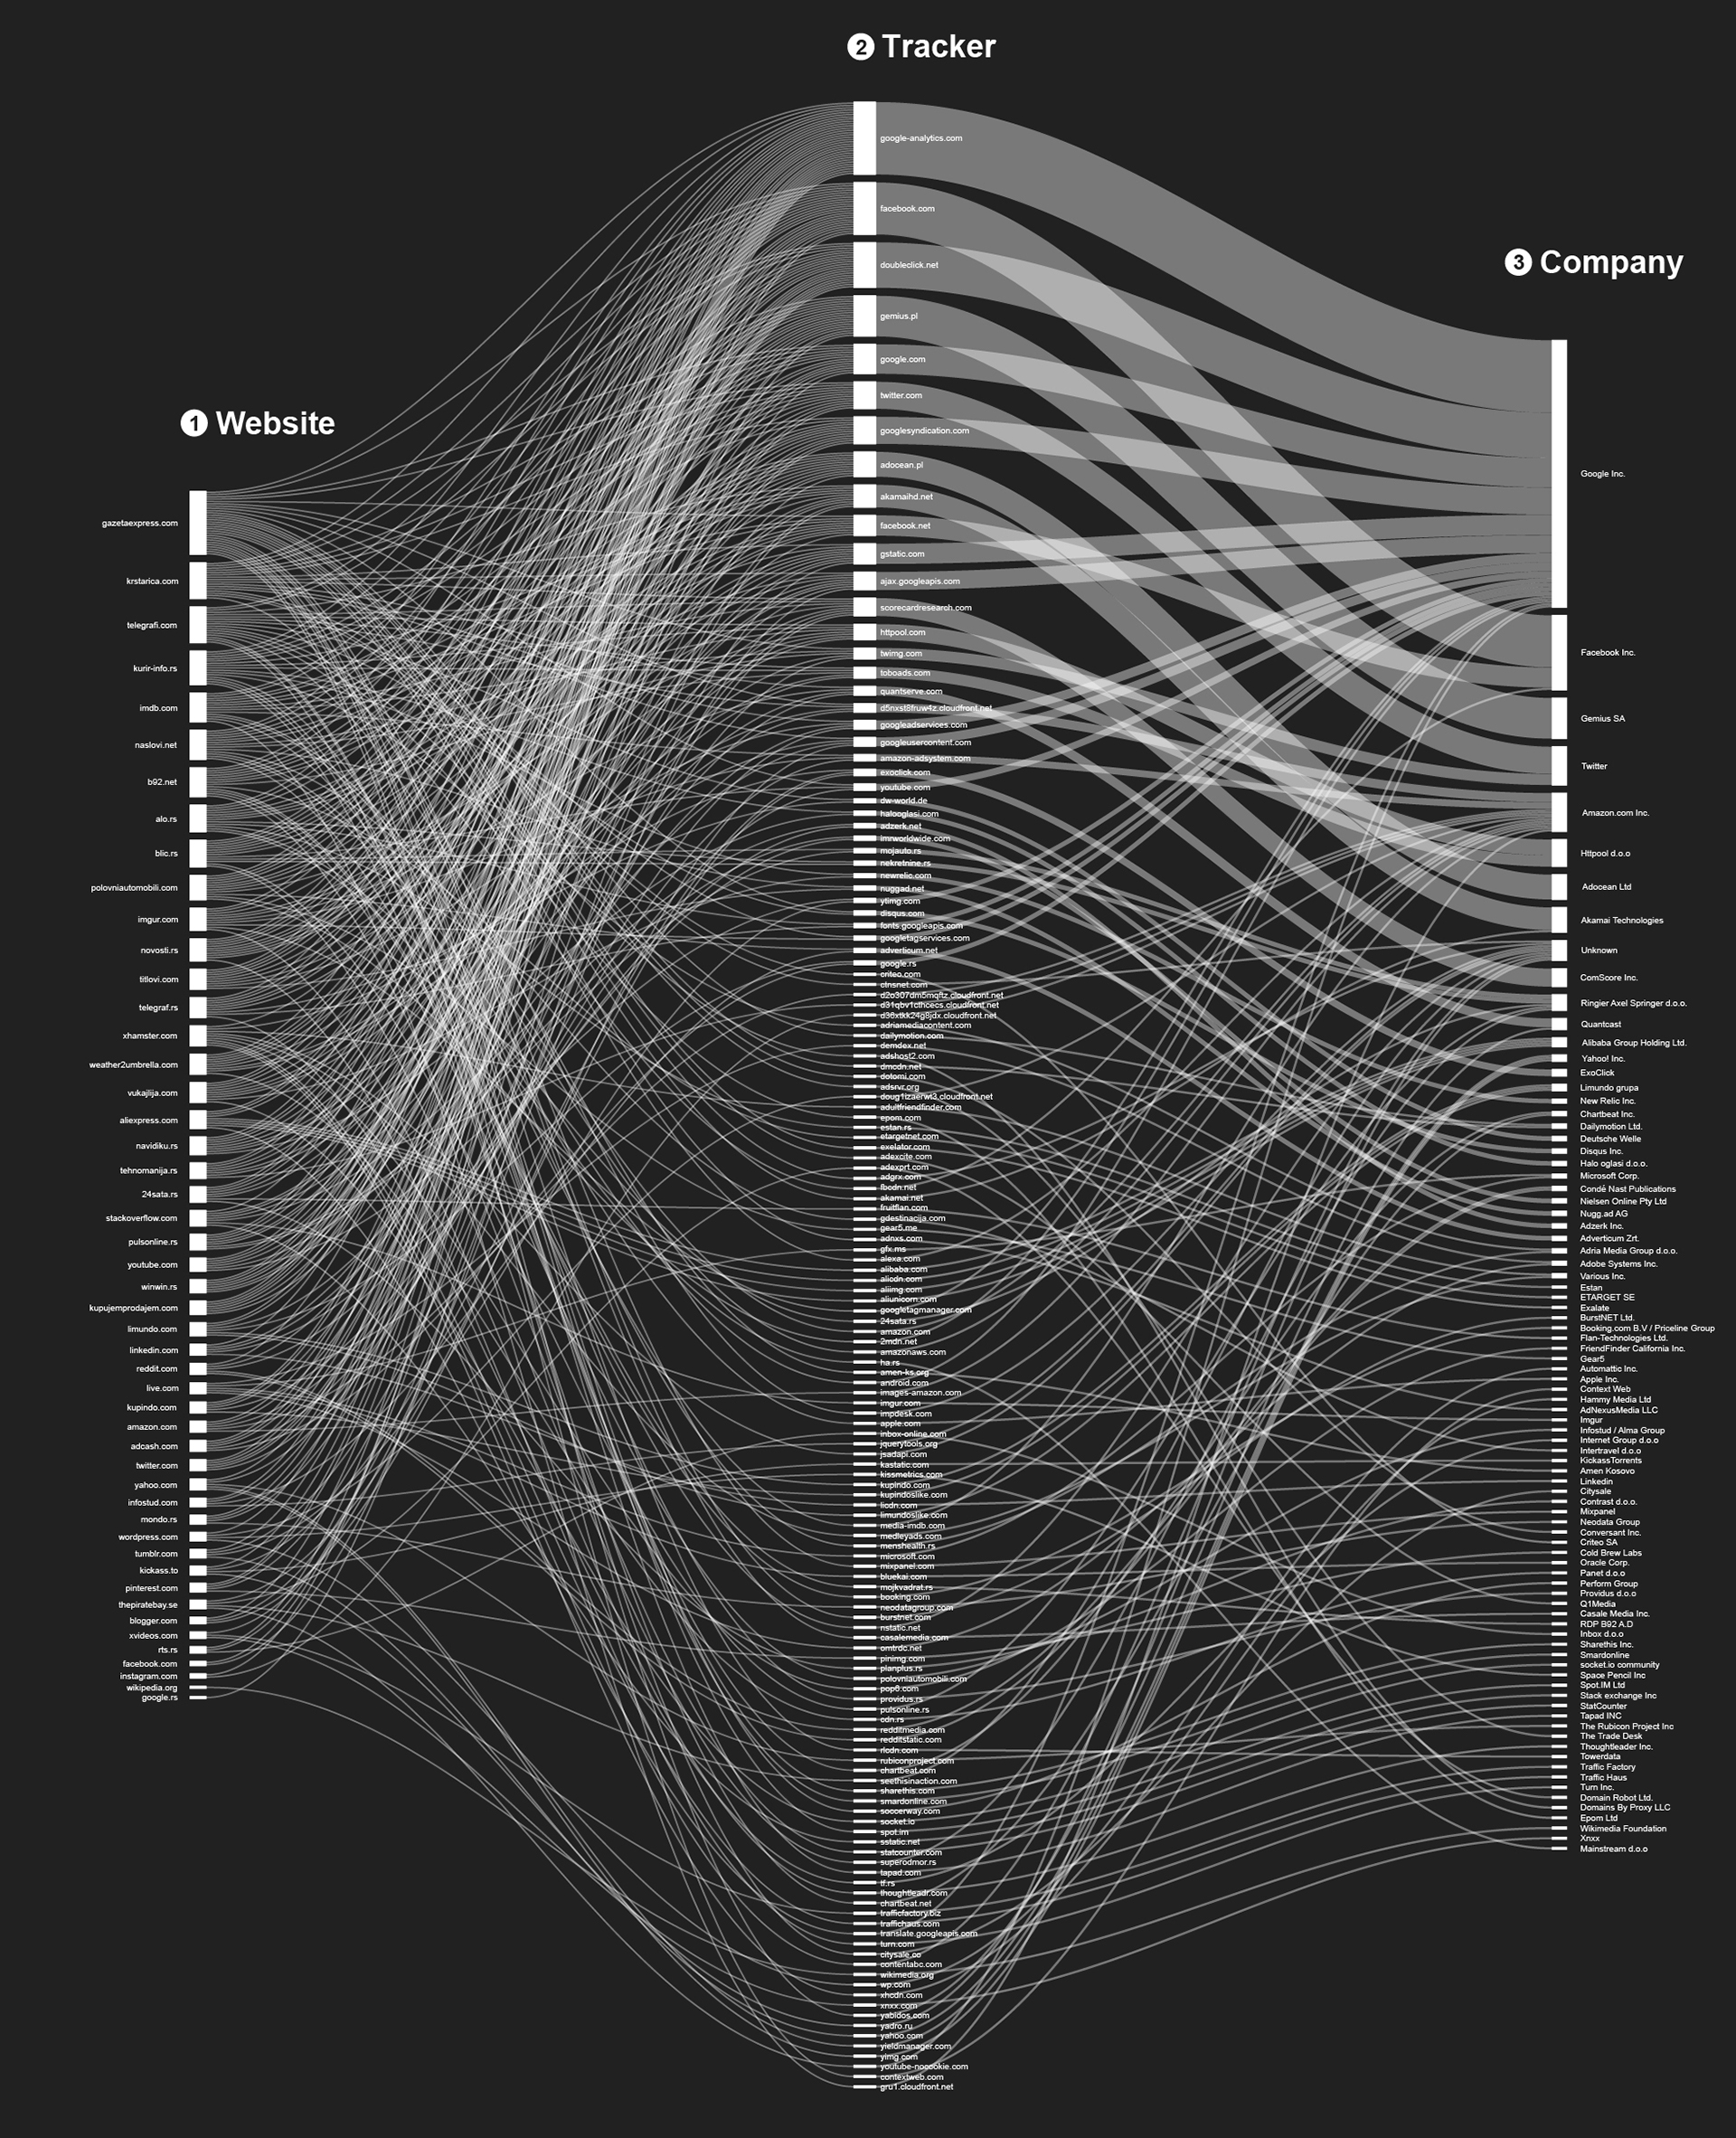
But let’s go a few steps back, into the architecture of collecting all those data. A HTTP cookie (also called web cookie, Internet cookie, browser cookie or simply cookie), is a small piece of data sent from a website and stored in a user’s web browser while the user is browsing that website. Every time the user loads the website, the browser sends the cookie back to the server to notify the website of the user’s previous activity61. This 20 years old concept developed in 1994. became a valuable tool for commercialization and monetization of the network enabling development of user targeting business models that are now the main resource of income for most of the biggest Internet companies.
“Before cookies, the Web was essentially private. After cookies, the Web becomes a space capable of extraordinary monitoring”.
Lawrence Lessig
Even the existence of the html cookies was not widely known to the public until 1996, when they received a lot of media attention, especially because of potential privacy implications. Developed by Netscape in 1994, cookes were secretly introduced in Netscape’s first version of web browser, without notifying or asking the consent of users, without notification mechanism to alert people when cookies were being placed on their computer, without any transparency about informations stored in the cookie62. In the following 20 years of cookie existence, numerous advocacy groups, online consumer privacy groups, privacy commissioners, commissions and national and international regulatory bodies tried different approaches in educating general public, advocacy and legal regulation of cookies impact on users privacy.
Digital Footprint exploitation
There are 3 main types of targeting methods in the advertising industry: property63, user segment64, and behavioral targeting65. Behavioral targeting, most relevant for our research, is based on a exploitation of our digital footprint, the data that is left behind by users on digital services. This data is collected without the owner’s knowledge66 in most cases. Our digital footprint can contain different types of information: your IP address, websites that you visit, time and length of your visit, type of your equipment, your search queries, your location, your sex and age, sexual preferences, books that you are buying and many other information depends on a service that you are using. All of those information brought together enable user profiling, process of construction and application of profiles generated by computerized data analysis and allow the discovery of patterns or correlations in large quantities of data about users. As our interaction with the Web becomes more natural and even mediates our interaction with others67, Web browsing behavior can be rich enough to uniquely characterize who we are through unconscious behavioral patterns and authenticate ourselves with a cognitive fingerprint68 .
Advanced targeting methods such as Predictive Targeting, performed by the algorithms, combining behavioral targeting, your history of response, location based data, socio-economic data, weather data or any other relevant data available is able to predict your response to the content in real time and serve you an advertisement most likely to provoke your reaction that will result with the conversion.
According to The Pew Internet & American Life survey69 from February 2012, 65% of the search engine users say “I’m NOT OKAY with targeted advertising because I don’t like having my online behavior tracked and analyzed”. But, even before the general public is even able to address opinion about this issue, it is important that they are aware of the scale and mechanisms of this phenomenon.
Data Hoarders
So, if you asked yourself a question: How come Google or Facebook are worth hundreds of billions of dollars even though they are providing a free service? – the answer is they are selling the service of profiling and targeting users, allowing others to serve their advertizing to a selected group of users. For example, the scale and quality of personal data that Google is able to collect today can be far more complex than the government secret services could have collected in the past. The ever growing hunger for data doesn’t stop on our screens, but extends to the physical space with mobile phone applications and platforms, biometric data through fitness wearable devices, constant flow of real time data through your Google glasses, Internet of Things devices, navigation data from your Google car, smart houses, smart cities and finally conquering the Earth orbit with a system of satellites providing free Internet.
Unfortunately this invisible ecosystem based on exploitation of user data is the same one that supports free online services and content70.
Mapping the Trackers
![]()
According to our research conducted on 50 most frequently used websites by the citizens in Serbia there are in average 7 different 3rd party cookies embedded in every website we examined. In total, we detected 174 different types of cookies detected 365 times. Those 174 unique cookies belongs to 87 different companies. There is massive dominance of 4 big US companies: Google (90%), Facebook (46%), Twitter (24%) and Amazon (10%) as well as the Infomediaries Gemius SA (36%), Httpool (7%).
![]()
Tracking Giants
So, even if you are avoiding using Google services, your surfing behavior in 90% of the cases is followed by them. In our sample this is done through 17 different cookies. Google analytics as a most frequent one is installed on 65% of the websites. The second one, owned by the same company, is the DoubleClick, embedded on the 40% of the websites. DoubleClick is a subsidiary of Google, acquired in 2008, for US $ 3.1 billion, responsible for products and services for advertising agencies and media companies to allow clients to traffic, target, deliver, and report on their advertising campaigns. There was numerous controversy, related to their products, over tracking user behaviour, misleading users by offering an opt-out option that is insufficiently effective and serving malware via drive-by download exploits. One of the documents71 provided by former NSA contractor Edward Snowden shows that the NSA uses Google cookies to pinpoint targets.
![]()
The second company whose presence is most frequent in our research results is Facebook, covering almost half (46%) of the examined websites. Facebook trackers are mostly present through the like, buttons, logging functionalities and other widgets embedded on the 1st party websites. Whenever you visit a website that have some of those trackers embeded, your browser is sending your IP address (showing your geographic area), browser type and version, the page you’re at and other Facebook cookies from your machine, including your unique Facebook user ID, linked to your Facebook profile in case you are registered there. This allows Facebook to record your behavior even outside of their domain and relate to huge amounts of data that they have already collected on their social network.
![]()
Based on our sample of the 50 most visited websites by users from Serbia, more than ¾ of online tracking cookies are owned by companies from US (75.4%). Google is mostly responsible for such high results, taking half of the cookies pie for the US, and leaving the rest to be shared mostly among Facebook, Amazon and Twitter. Beneath the main layer of big US companies presented on the list there is a web of hundreds of smaller mostly advertising and data analytics companies tracking your online behaviour. We can notice presence of a few bigger regional players such as Gemius SA and Adocean Ltd from Poland, as well as the Serbian based HTTPool d.o.o. Overall, a really small percent of those cookies collect data for locally based companies. We can say that Serbia is a great exporter of informations about online behaviour of the citizens. the US is by far the most dominant user-tracking economy, extracting the highest financial value from our online behaviour.
![]()
Data is the oil of the 21st century and online tracking is one of the main technologies to extract this oil made of our behaviour, movements and preferences.
Cookies are dead, long live Cookies!
]]>The reasons for making the ToS and the PP long, complex and hard to understand for the average user can be multiple. First of all, it is logical that the companies that produce or distribute applications want to protect themselves from almost any potential claim by the users and prevent legal consequences that can be costly harm their reputation. The second possible reason is access to personal information on the user’s device. However, not all applications have the same ToS and PP, and the goal of this research is to determine who is privacy friendly, and who is not.
Users actively access about 27 apps on their smartphones every month. Even though the number of used apps per month doesn’t increase very fast (from 23,2 apps in 2011 to 26,8 apps in 2013) the problem of not reading the Terms of Service and Privacy Policies persists as a common problem in the apps usage72. However, the average number of installed apps for android users is about 9573. Analysis have shown that a Privacy Policy has an average length of 2.518 words and takes about 10 minutes to read, which means that a user needs to spend roughly 950 minutes (15,83 hours or 2 work days) in order to read the PP of the apps they have installed.
It is important to understand what is the story behind the confusing, complex and time consuming PP and ToS. Personal data of many formats (mostly content and metadata) has become a new type of currency. It is estimated that the accumulated financial value of personal data stored online could reach €1tn annually by 202074. Many global companies have developed strategies and tailored their business models to the concept of providing content for a certain amount of personal data they can sell or use.

The output of this part of the research is a logical map of permissions that applications for smartphones require the users to grant in the process of installation. The purpose thereof is to show, in a clear way, what users agree to. It is recommended that this map is read from the centre outwards. Starting with the categories of application, through choosing the actual application, reading the list of permissions it requires and finally understanding what do the permissions implicate in plain words. The categorisation of the apps means that the reader of this map will be able to compare different apps who give the same service and afterwards choose the less intrusive one. For instance consider comparing two search engines such as Google and DuckDuckGo. Google search requires permission to be able to execute over forty different operations on the device, while providing the same service as DuckDuckGo which requires permissions for execution of only three different operations without further prompting.
A further issue are the permissions required by the applications that come preinstalled on the device. In the case of Serbia, one carrier sold smartphones that came with several apps (including one media app) already installed on the device (without the possibility to uninstall it). In spite being in collision with the principles of net neutrality this issue takes away from the user the right to chose what kind of data will be given to whom.
Follow the money
There are several so-called monetisation models for smartphone apps. Essentially, it’s no longer enough to develop a really cool application, that is either useful, educational, practical or pure fun; the developers should find a way to make money out of it since the majority is used to getting free content or some sort of service. Monetisation mostly includes revenue from advertisements or surveys, but there are certain scenarios in which users can opt-out from the advertising system for a certain fee.
Mobile advertising is the most common source of revenue from smartphone apps. There are variations thereof, but generally they are characterised with compromised user experience, intrusiveness and users drop-off. Methods for ads delivery to the users include banner ads, interstitials, offer walls and notification ads.
An emerging financial source are surveys which are much easier to integrate in applications due to the fact that they are mostly rendered as an overlay within the application. They are generally more practical than ads and deliver up to 20 times the revenue of standard ads.
Other monetisation concepts include caller ads, widget ads, video ads, audio ads etc. However, there are ways to produce revenue without explicitly or implicitly tracking users. Some of them are, paid applications, applications with premium features and applications with subscriptions75.
Third Party Content vs. Mobile apps
This comparison might seem a bit strange at first sight, but let’s take a step back and look into the data that can be collected by TPC and by mobile apps. As much as it is annoying to have some company collect your data without your explicit permission, which makes TPC one of the most intrusive concept on the Internet, it is much worse to be obliged to give permission to some company that you might or might not know or like, to access certain type of data on your device.
Now, it is important to note that TPC can only access metadata, which by default is a somewhat public category of data. Furthermore, there are techniques and procedures (such as using TOR, AdBlocker etc,) that help users preserve a high level of privacy. The deal with the smartphone apps is that the user seals the deal and “willingly” gives away quite a slab of privacy; whilst not accepting the ToS and PP as presented, signifies not being able to use the application at all.
Just to be frank, metadata (even though it’s been defined several times throughout this paper) is device/software generated data that is necessary for every activity on the internet. This includes IP address, time of access, duration of session, type of software used, location (which is based on the IP address) and the likes, and that is basically all that TPC owners have access to (which should not be considered little in any way).
What do these permissions mean?
Although most of the permissions are straightforward, users often don’t really perceive their intrusiveness, not because they don’t understand the words, but rather because they neglect to understand the meaning thereof. This is a good point to introduce the most common permissions users come across in most of the apps they install.
Intrusiveness
Finally, it is important to categorise the permissions because the users have a right to choose which application they will install on their own devices, and sometimes it is really hard to determine which application is privacy friendly and which one is not. That is why within this part of the research we conducted evaluation of different sorts of permissions granted to apps. Basically we categorised the permissions in 3+1 category; Permissions with high, medium or low Privacy risk (level of intrusiveness) and App specific permissions.
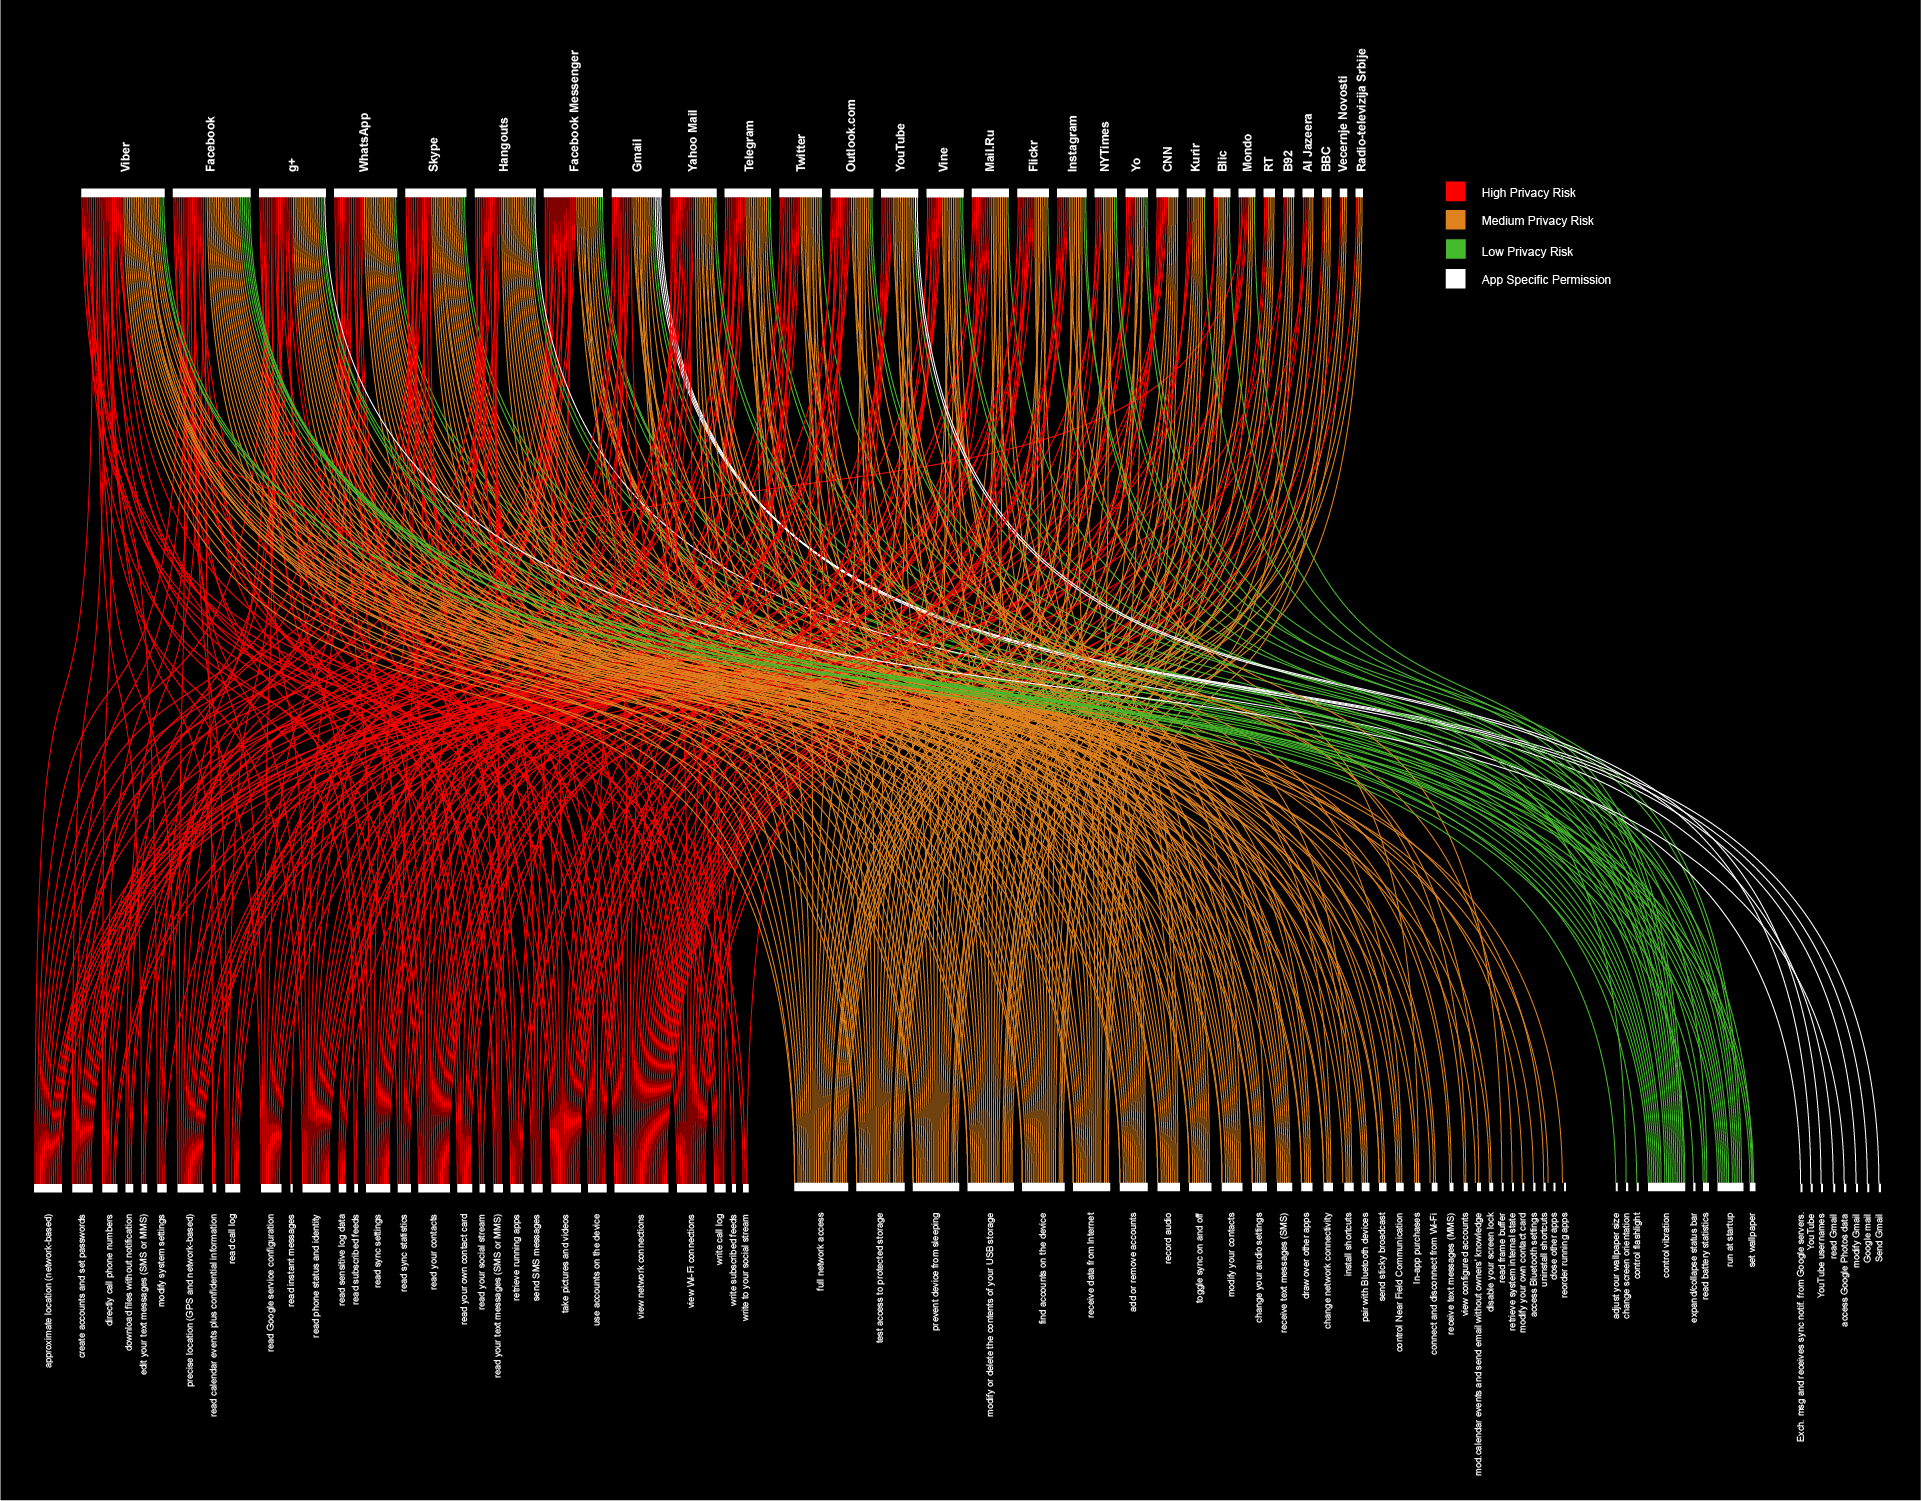
The analysis of this secondary output shows that the apps we analysed require many permissions with high level of intrusiveness. While some of the permissions that are required are legitimate for the operation of the app and is in accordance with the type of service the app provided, the requirement of some permissions should be seriously reconsidered by the application’s developers.
]]>One of the reasons we seldom discuss the issues of this invisible infrastructure is the fact that the speed of the packets traveling through the network is so big and unnoticeable to us, in most cases we don’t feel a significant difference in whether our packets are traveling just around the corner or to around the world and back.
The fact that we are not able to perceive this difference does not change the fact that those packets, during just a little fragment of a second, travel through thousands of kilometers of cables, myriad of routers and switches, different national territories and a number of potential spots where they can be retained, slowed down, stored, copied or examined.
Unlike the telephone network, which for many years was a monopoly run by a single company in most countries, the global Internet consists of tens of thousands of interconnected networks run by telecommunication companies, Internet service providers, individual companies, universities, governments, and others 76 . Those entities have different legal regimes, business and technical relationships, privacy policies and ownership models. Even our most frequent and most sensitive communication relies on those entities. But even so, in most cases, our knowledge of how those networks are interconnected and how they deal with our data is left in the dark.
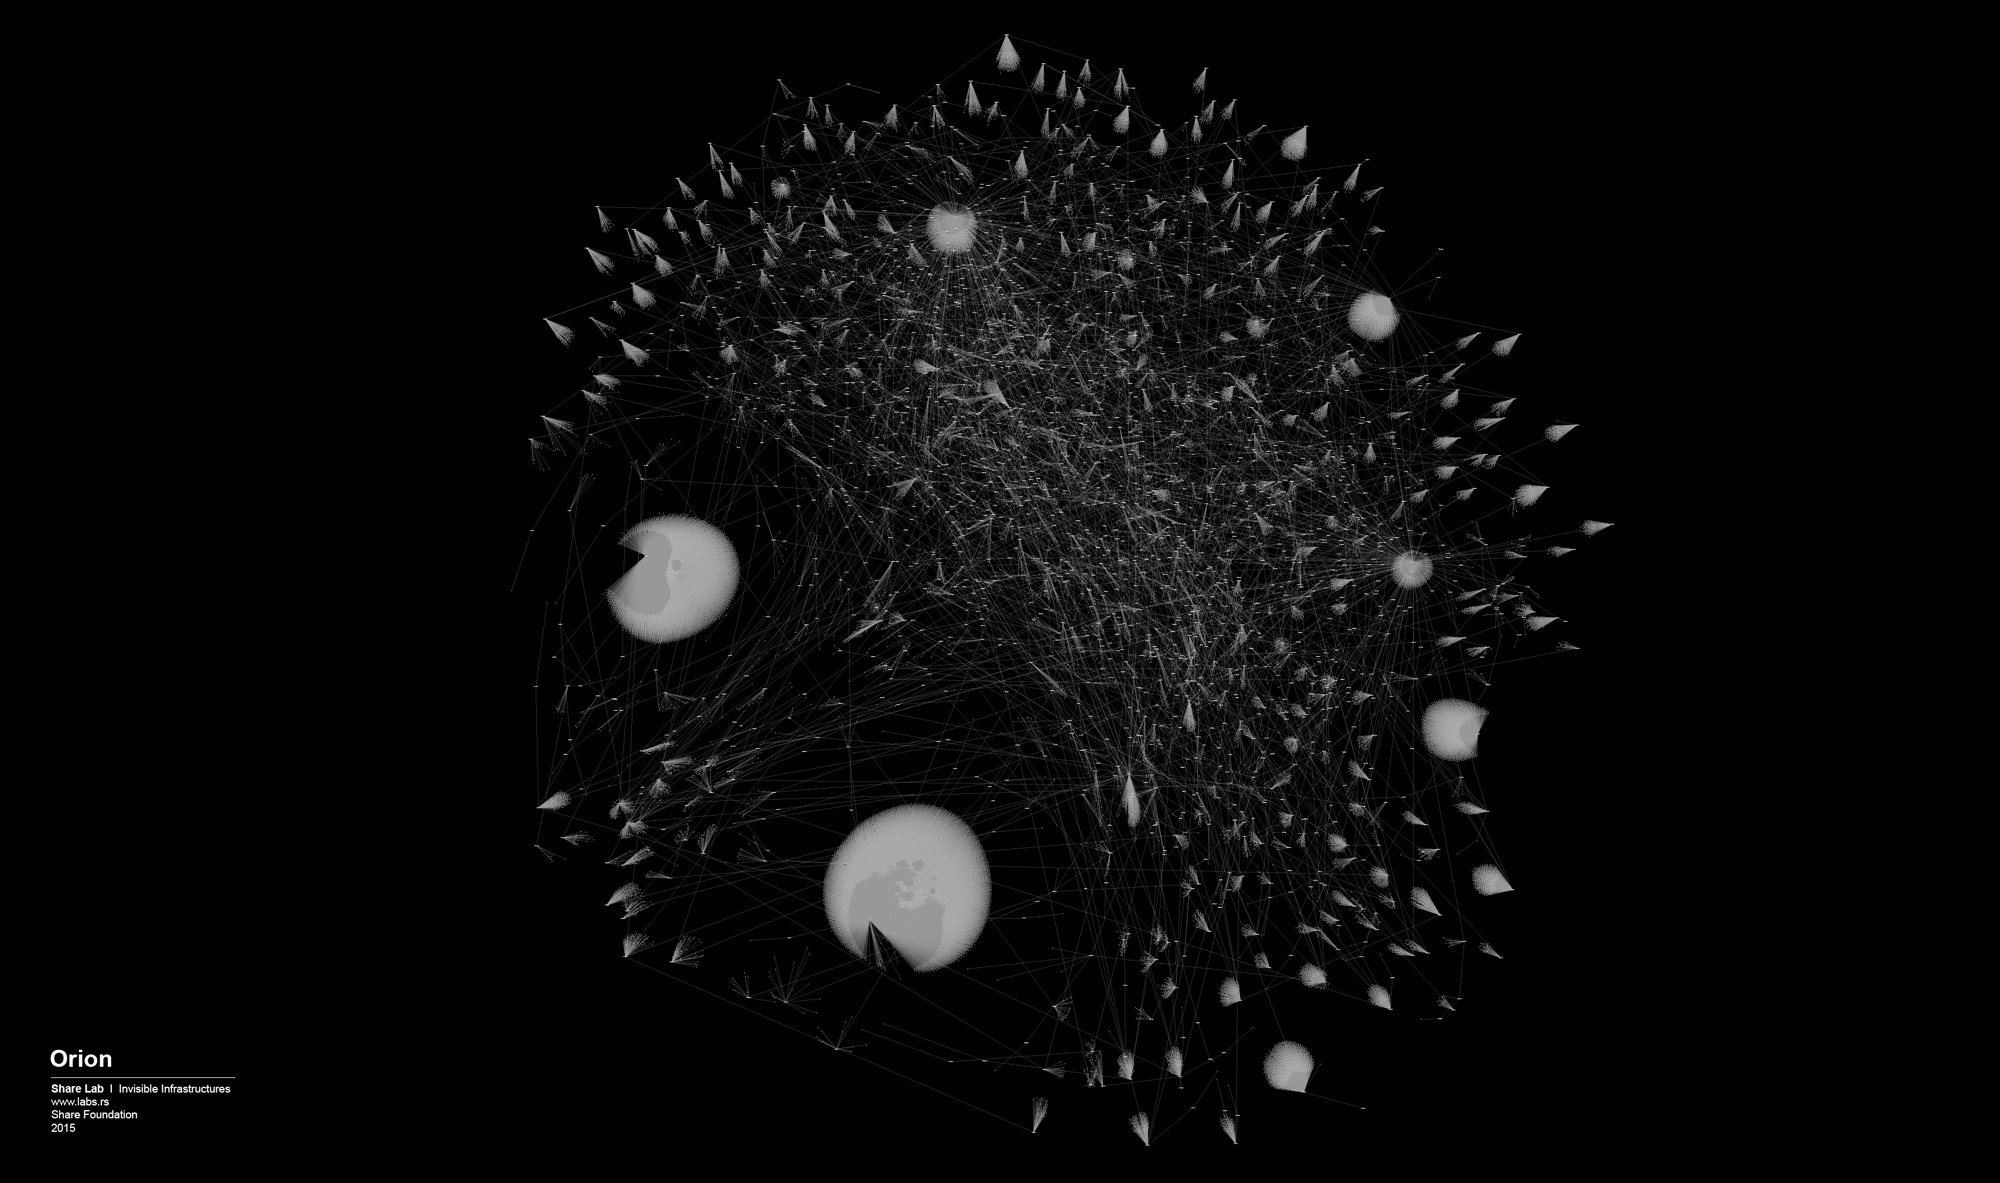
Our first step of understanding this invisible network is to try to understand the structure of our nearest network, network runed and owned by our Internet service provider. Every ISP is a story for itself, they have a different number of users, a different number of interconnected routers organized in different structures.
Every device that is connected to the Internet (your computer, routers, servers) have an IP address. The IP address is a logical Internet Protocol address which allows data to flow over the Internet. IANA (Internet Assigned Numbers Authority) through the RIRs (Regional Internet Registries77) assigns the ranges of IP addresses to entities interested to buy them, and they keep a database of which range belongs to whom and other data, including which range is assigned to which country . So, every ISP has a limited and defined range of IP addresses that they further assign to their users and infrastructure that they own.
This set, range of all IP addresses that one ISP owns, was the starting point of our research.
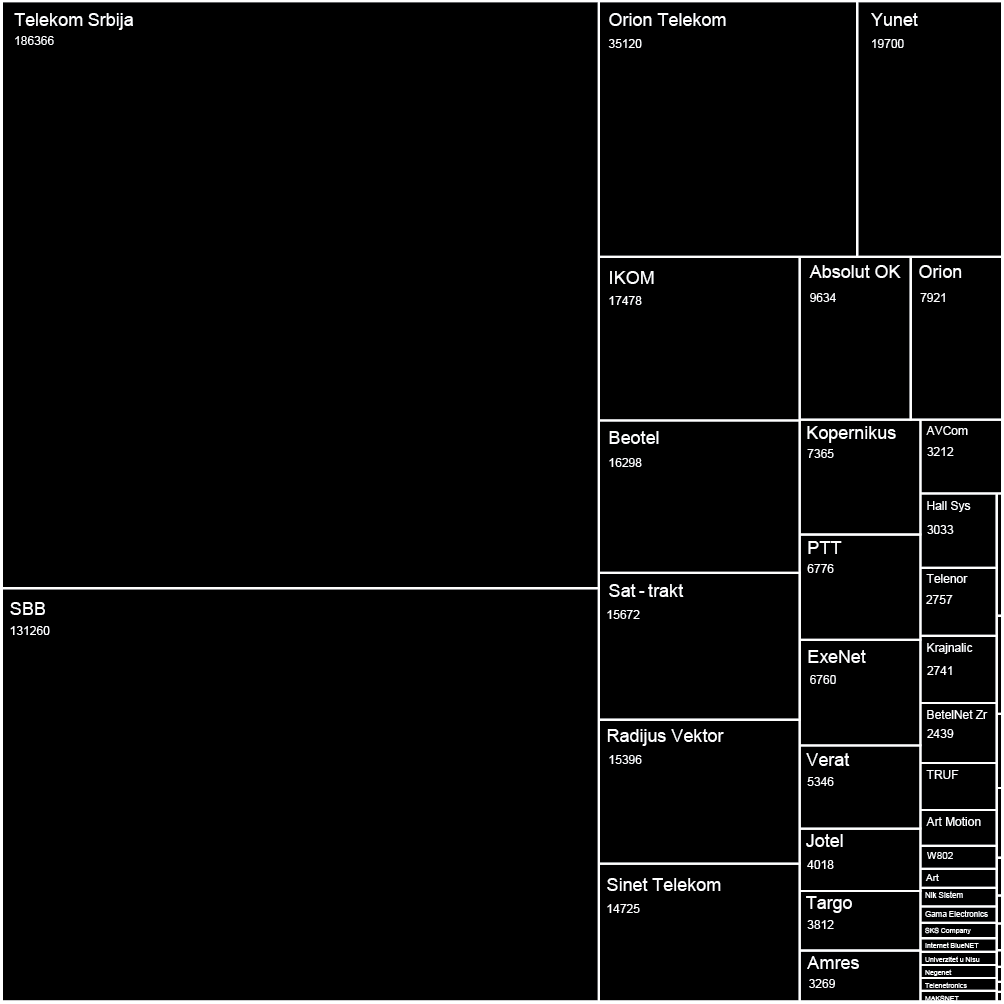
We used IP ranges of every ISP and created a Network Topology map for every one of them. In order to visualize large sets of data, in our case more than 300.000 different IP addresses and links between them, we had to find a tool that is able to display, manipulate and transform the network into a map. We used Gephi 78, an interactive visualization and exploration platform for different kinds of networks and complex systems, dynamic and hierarchical graphs. The obtained results are showed below in form of 30 different maps of ISPs in Serbia.
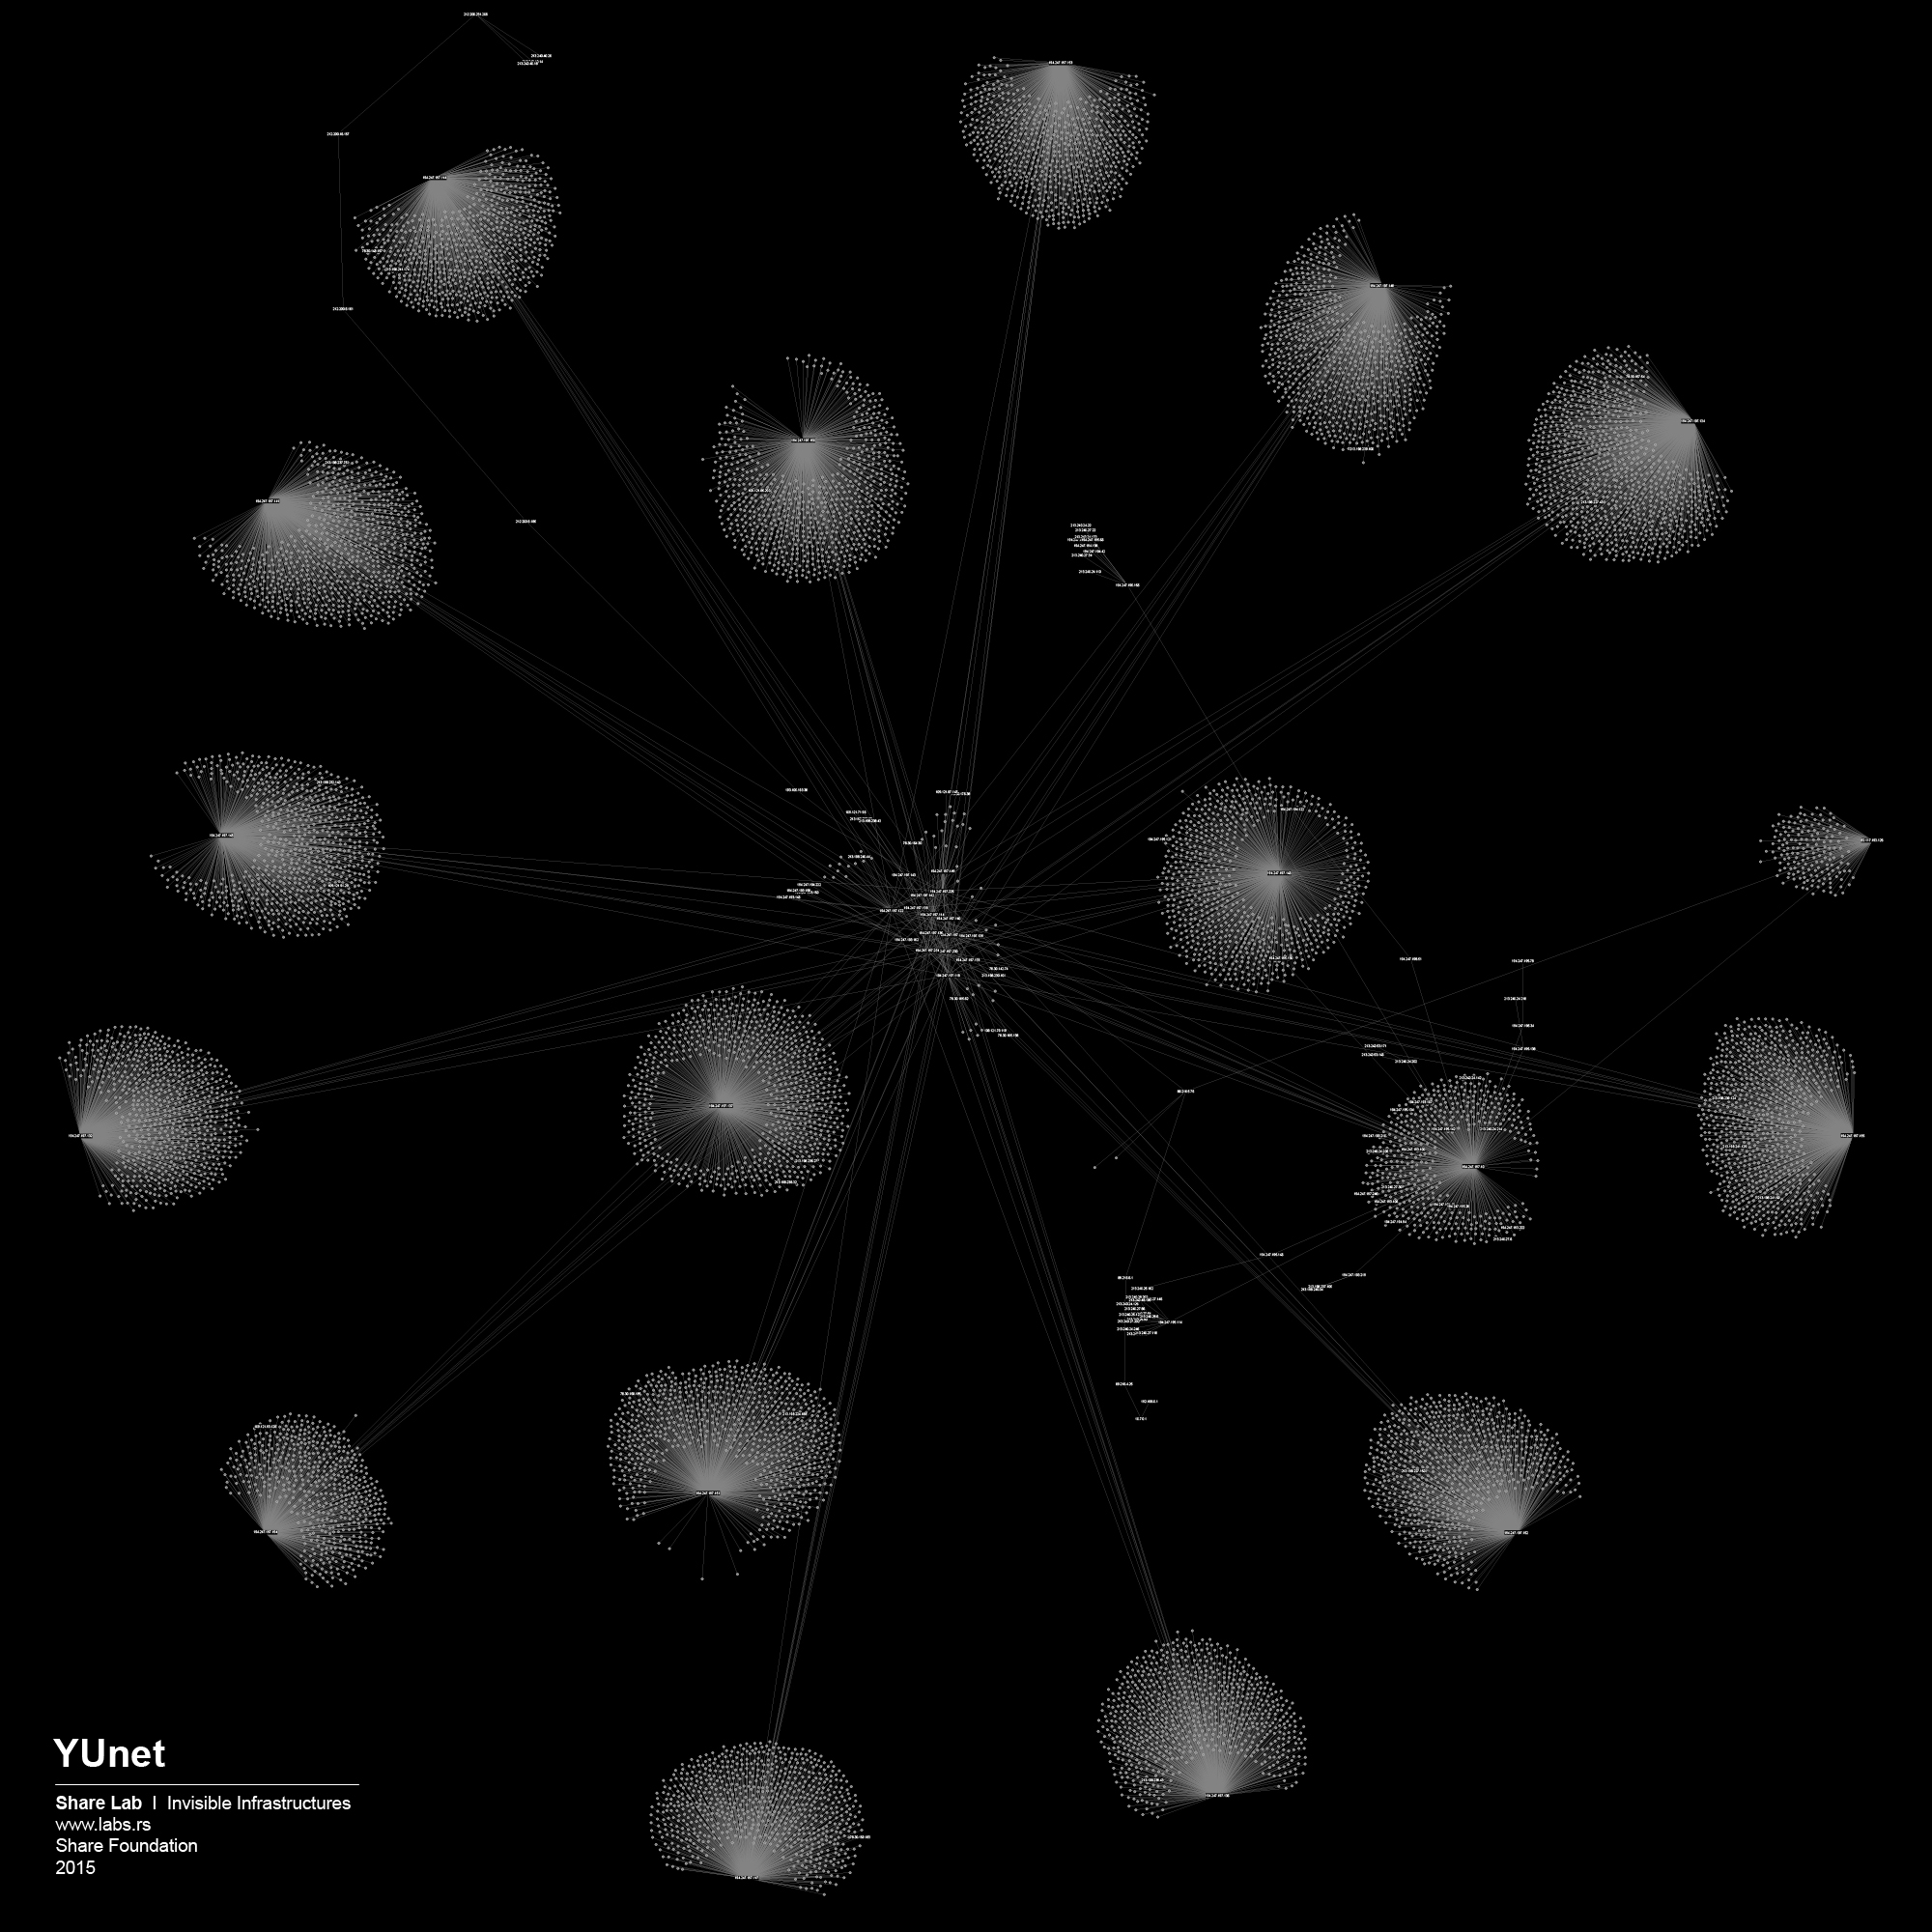
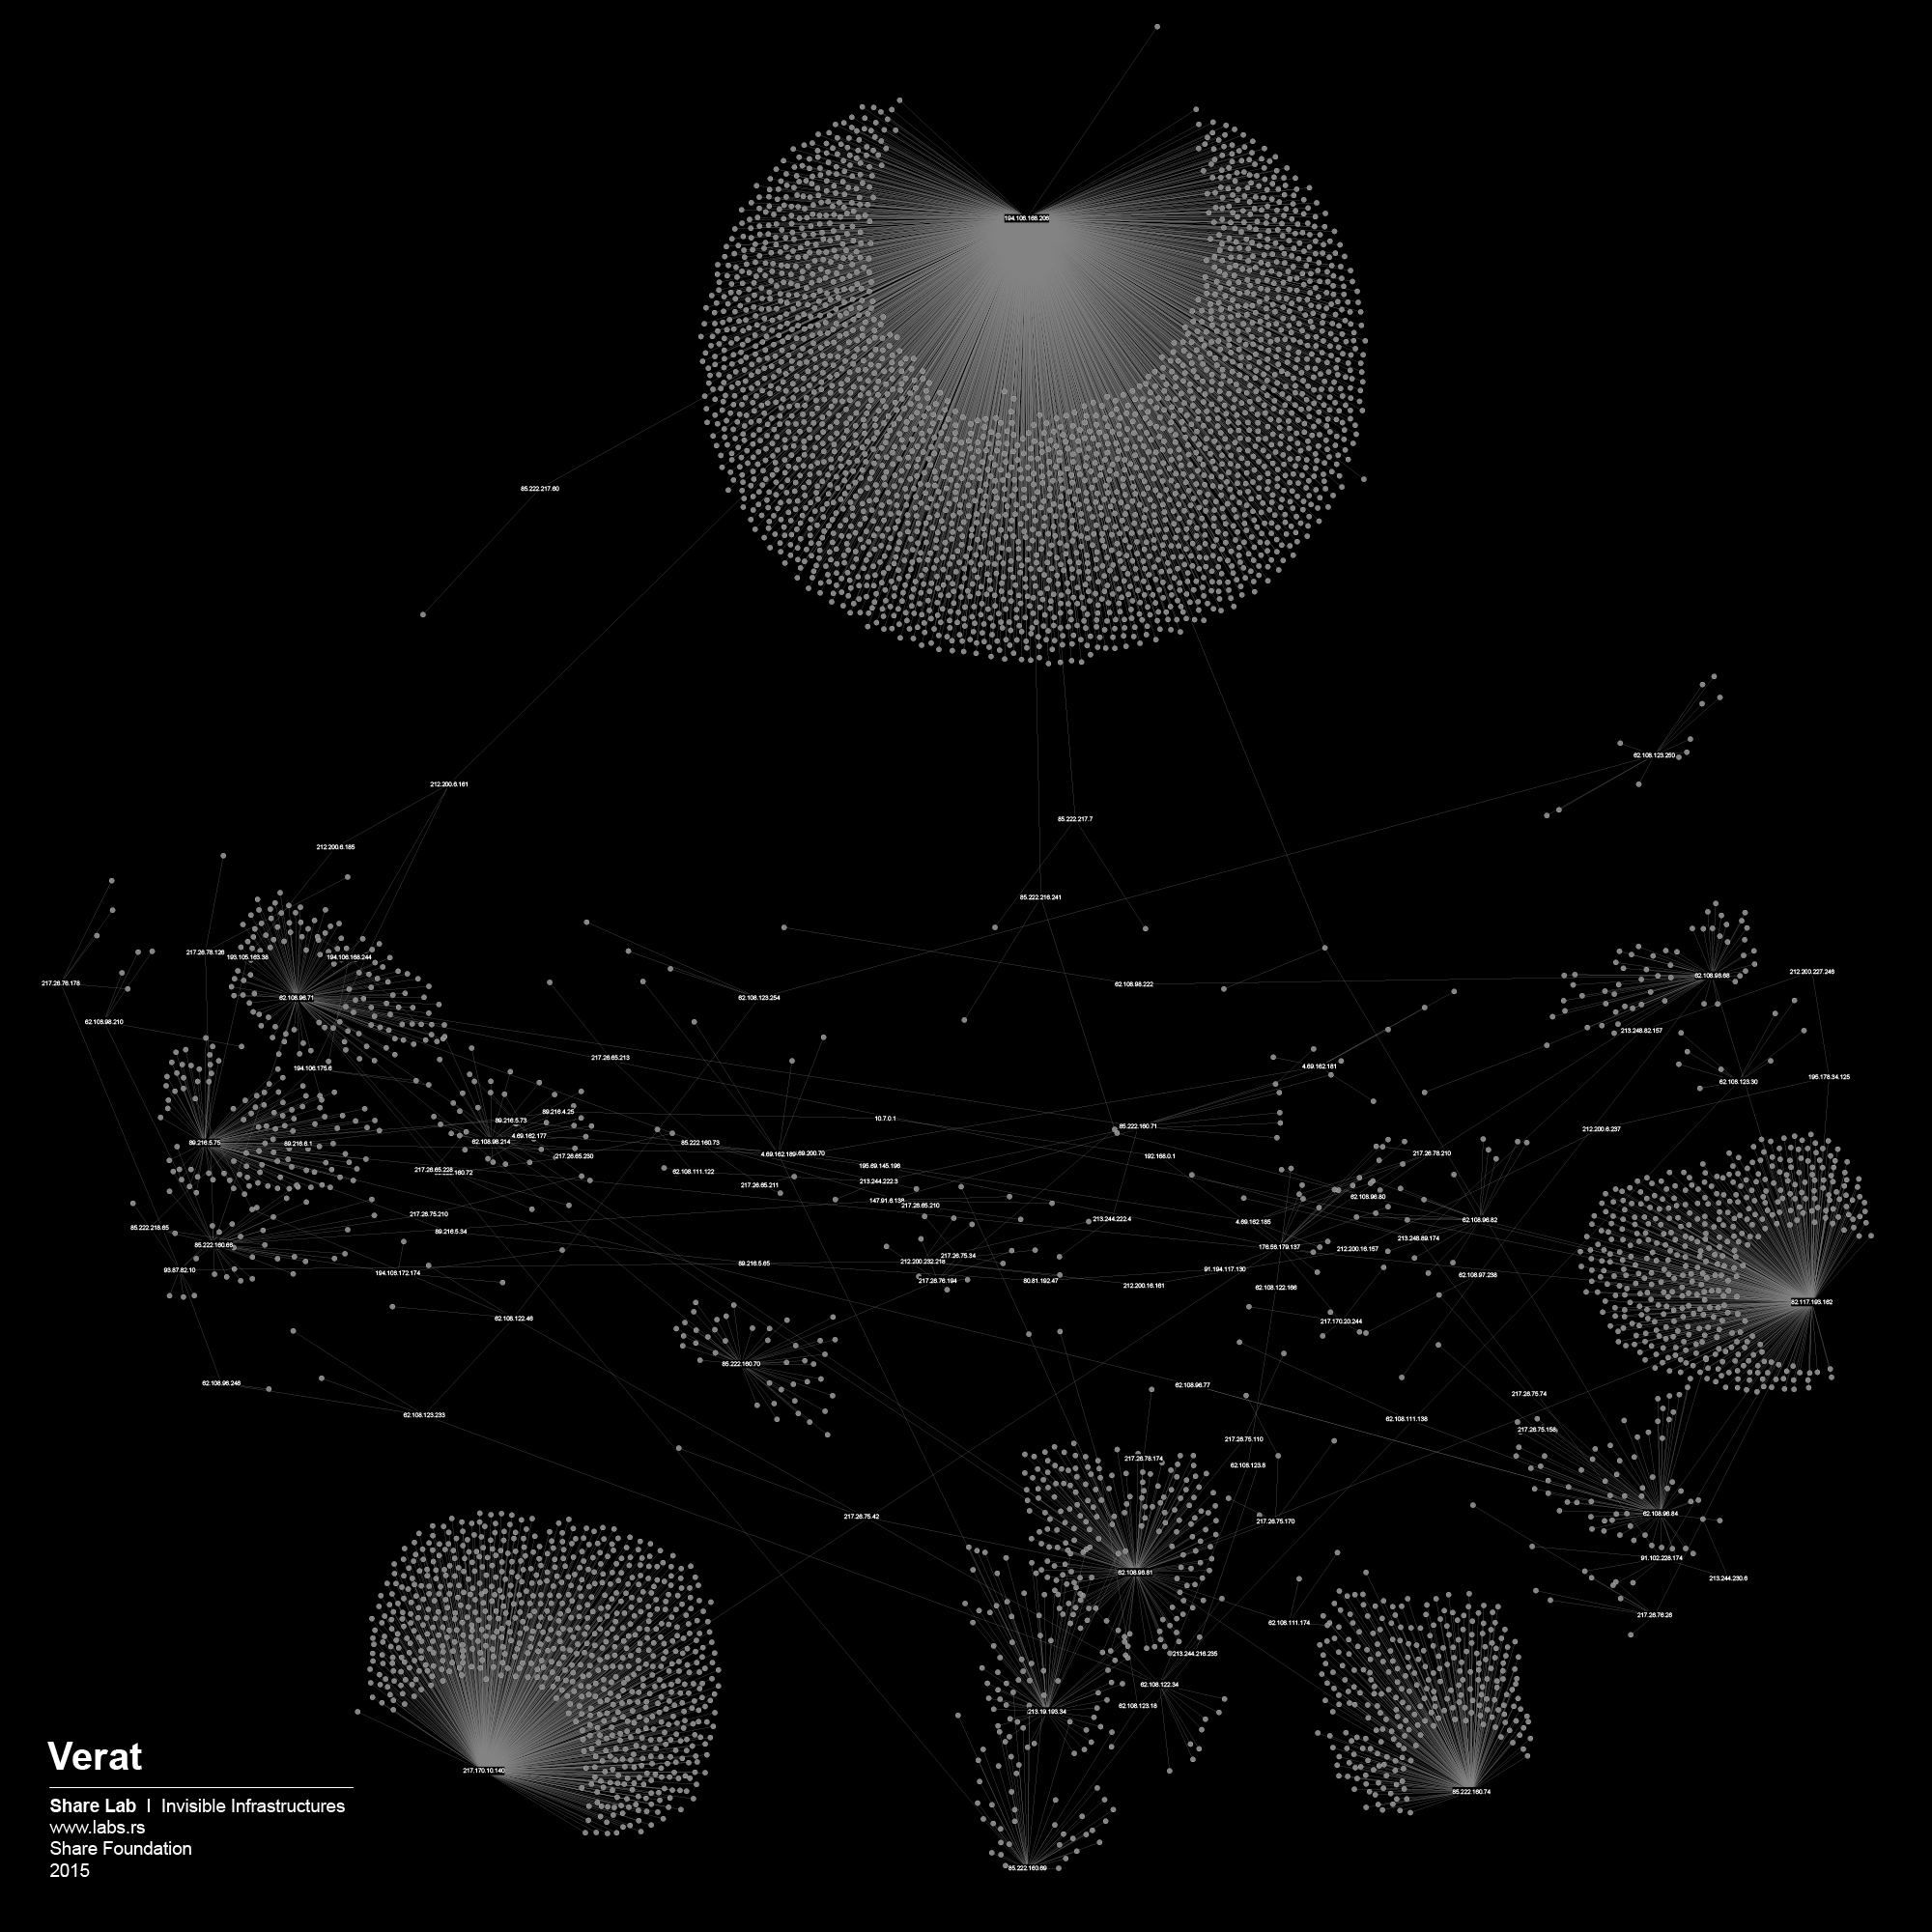
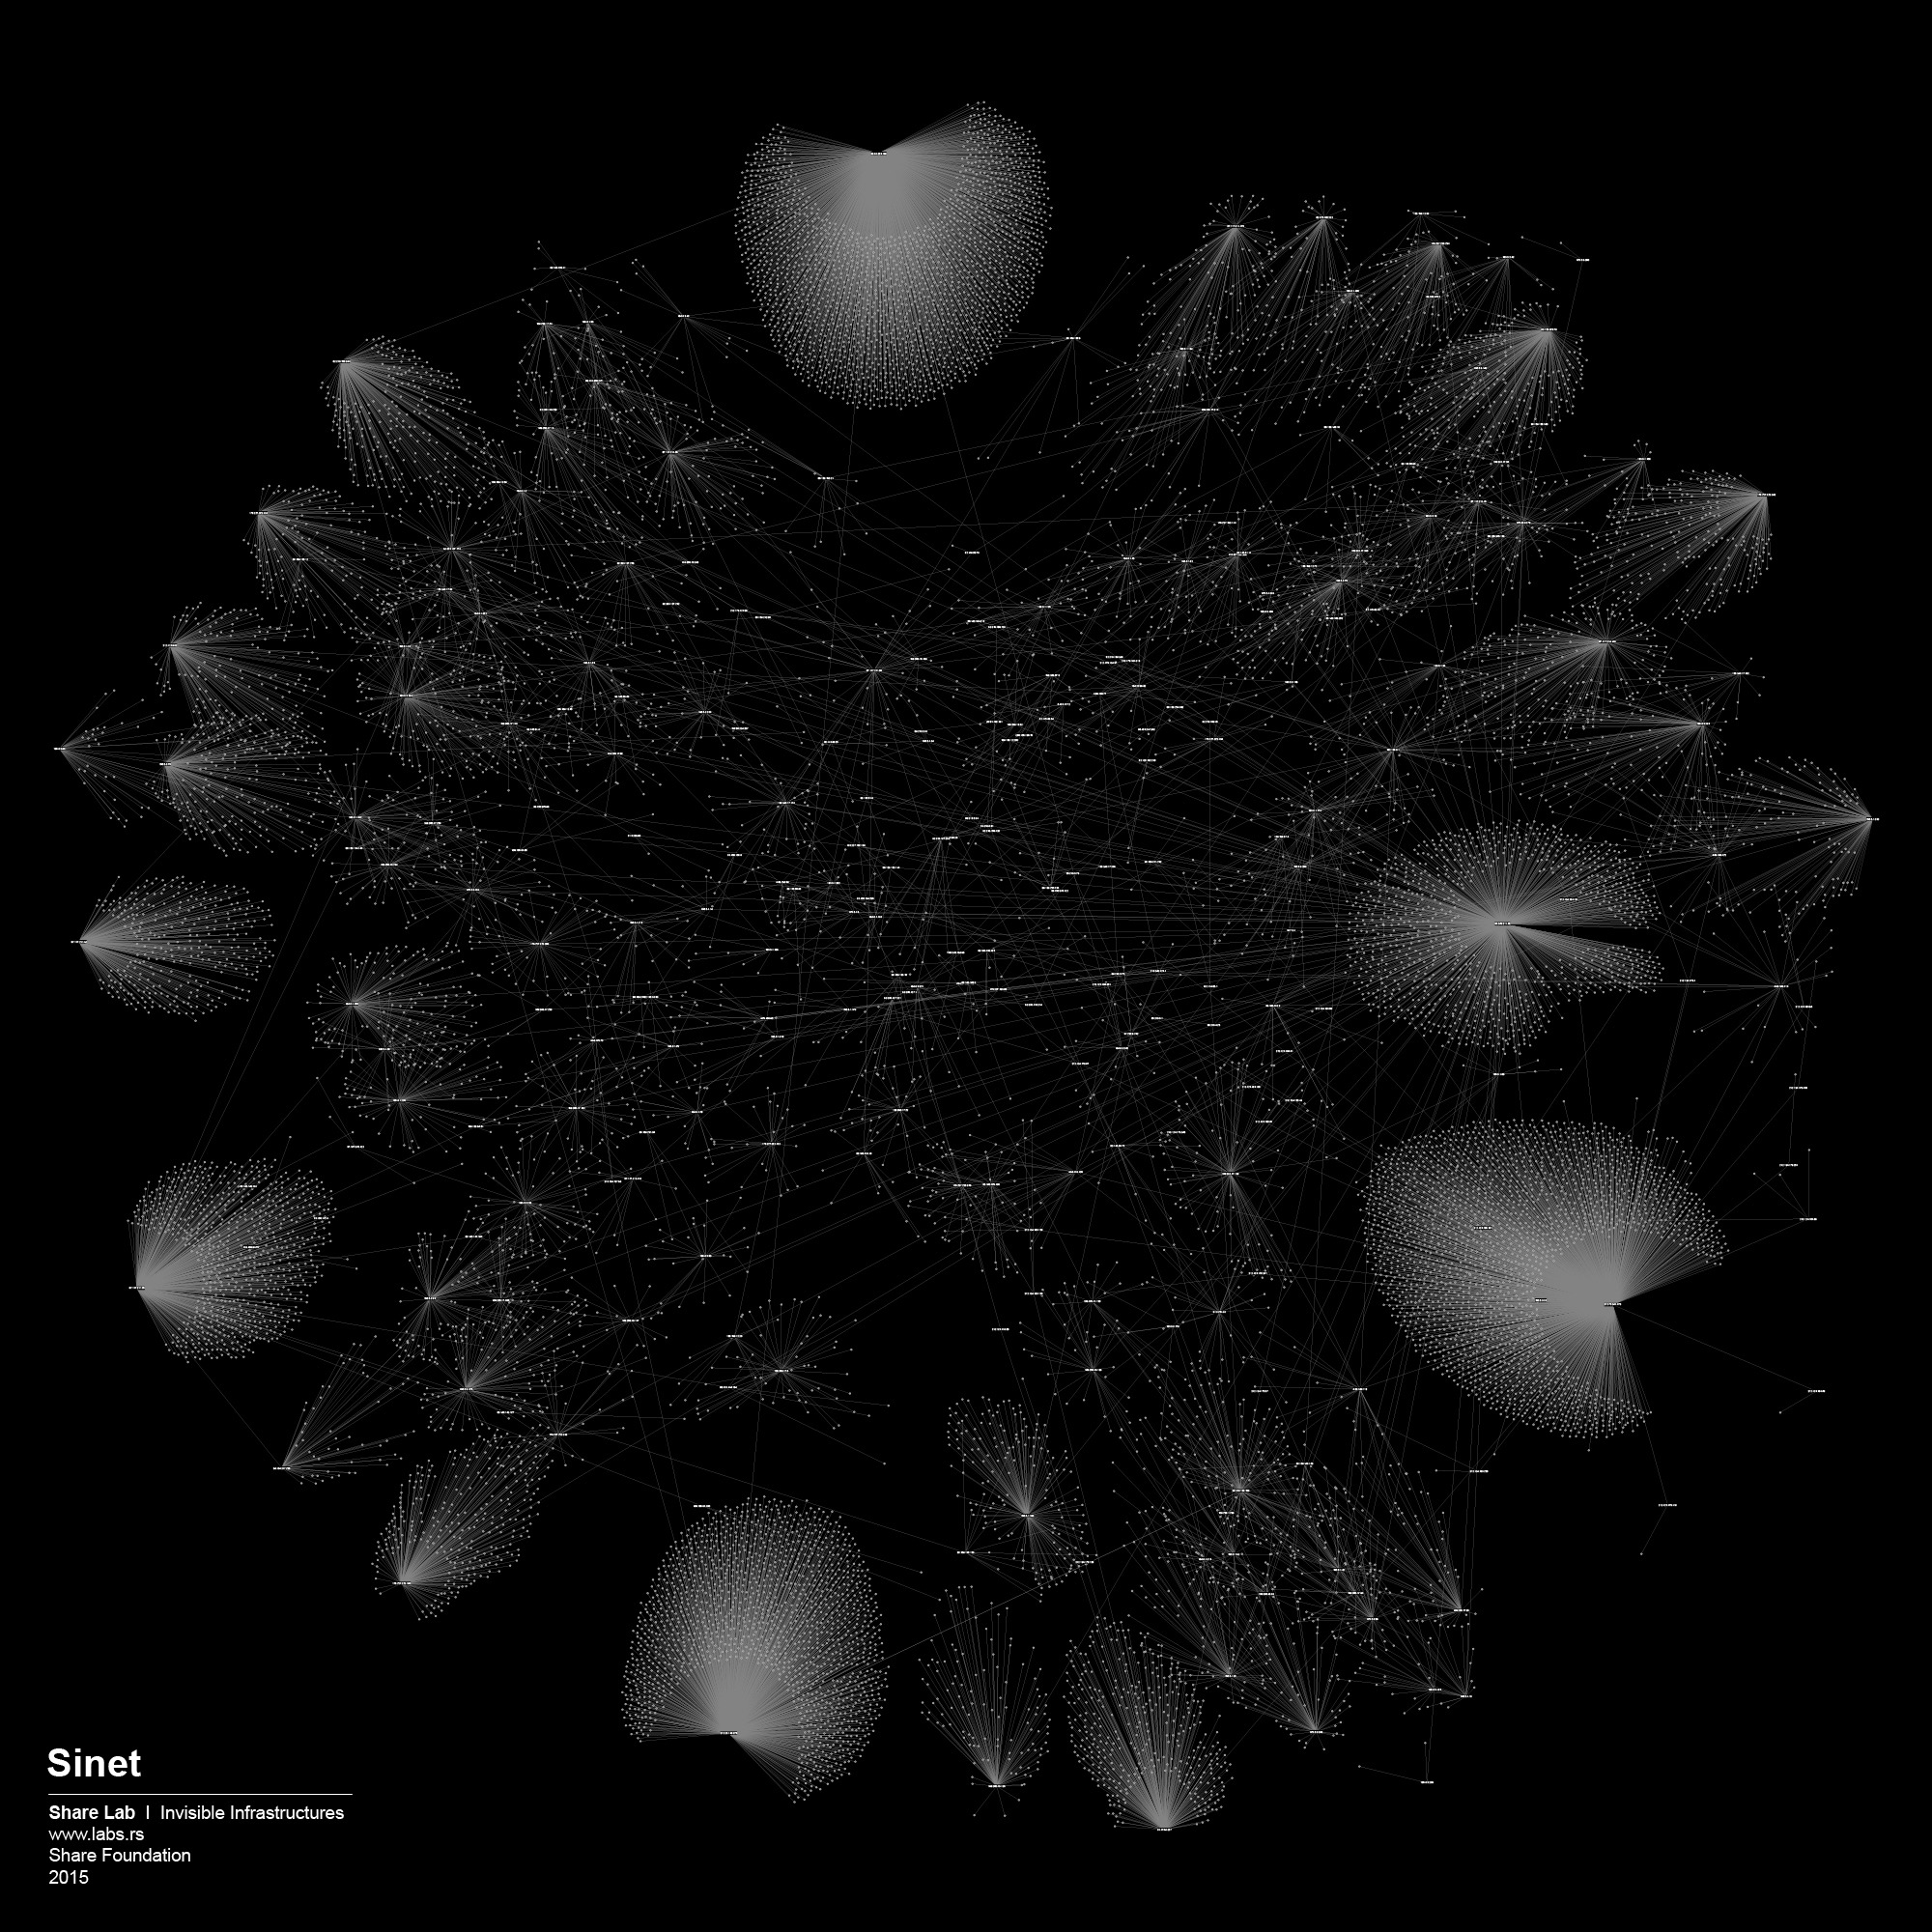
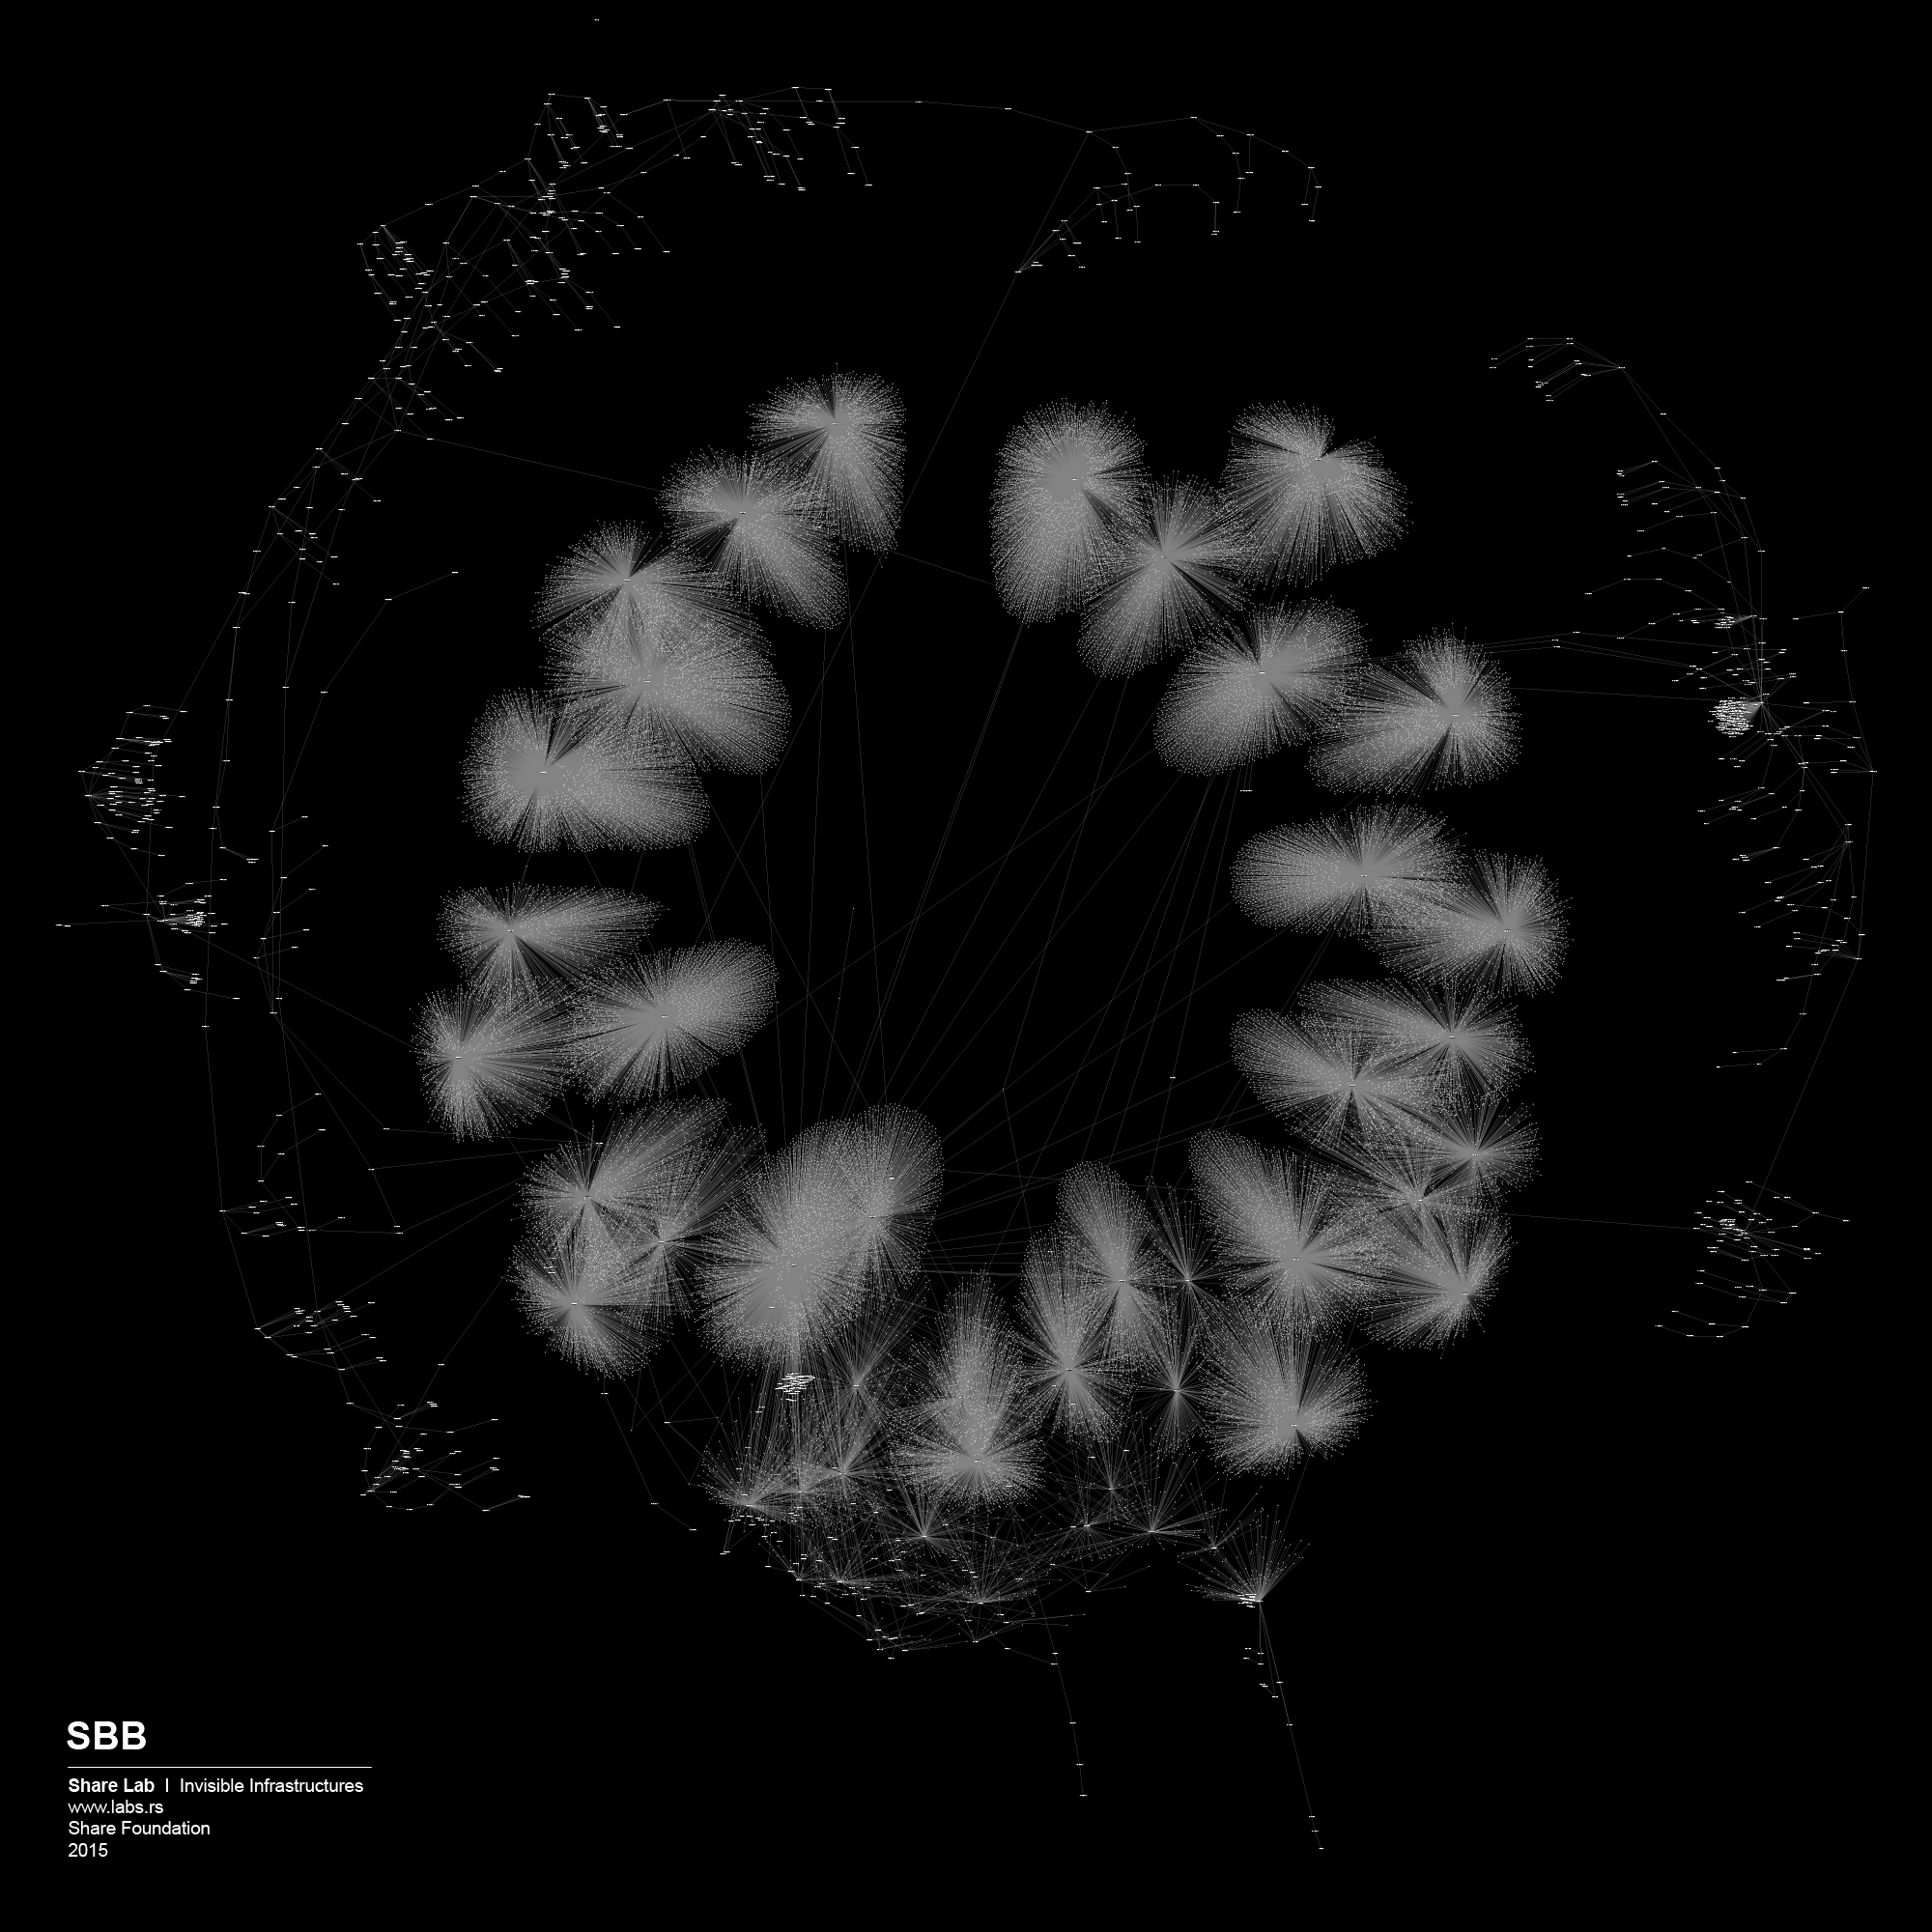
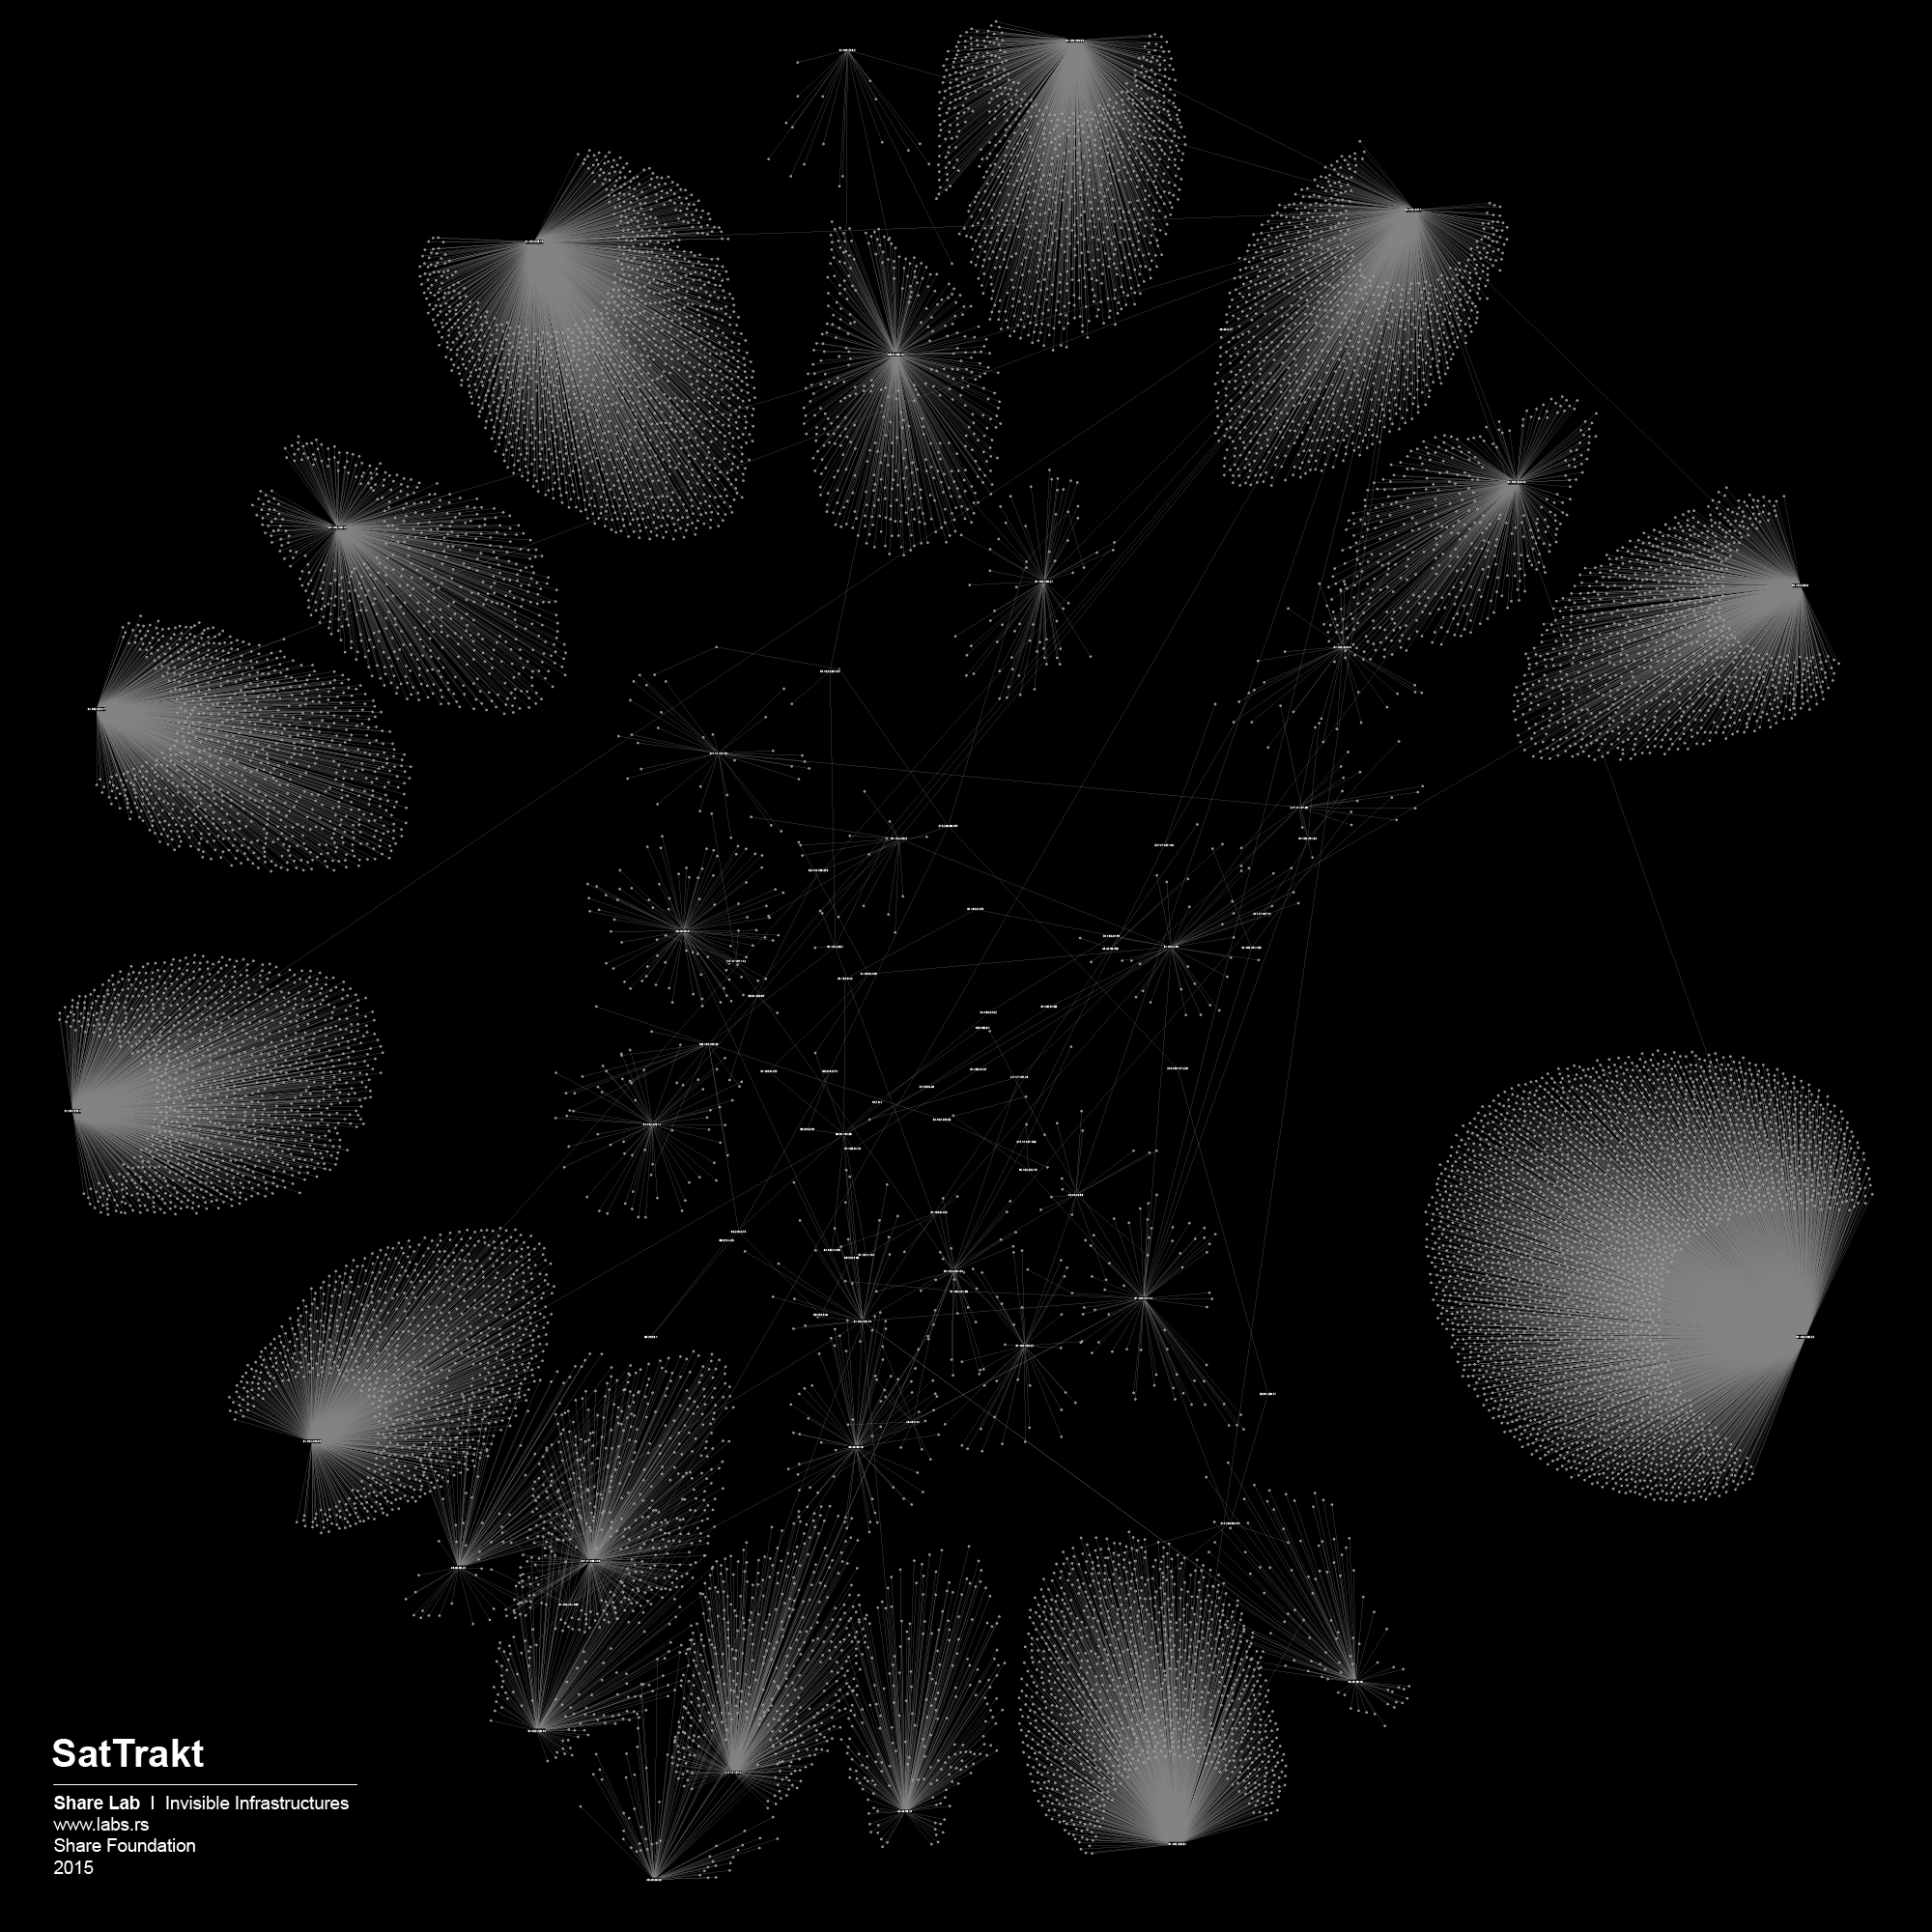
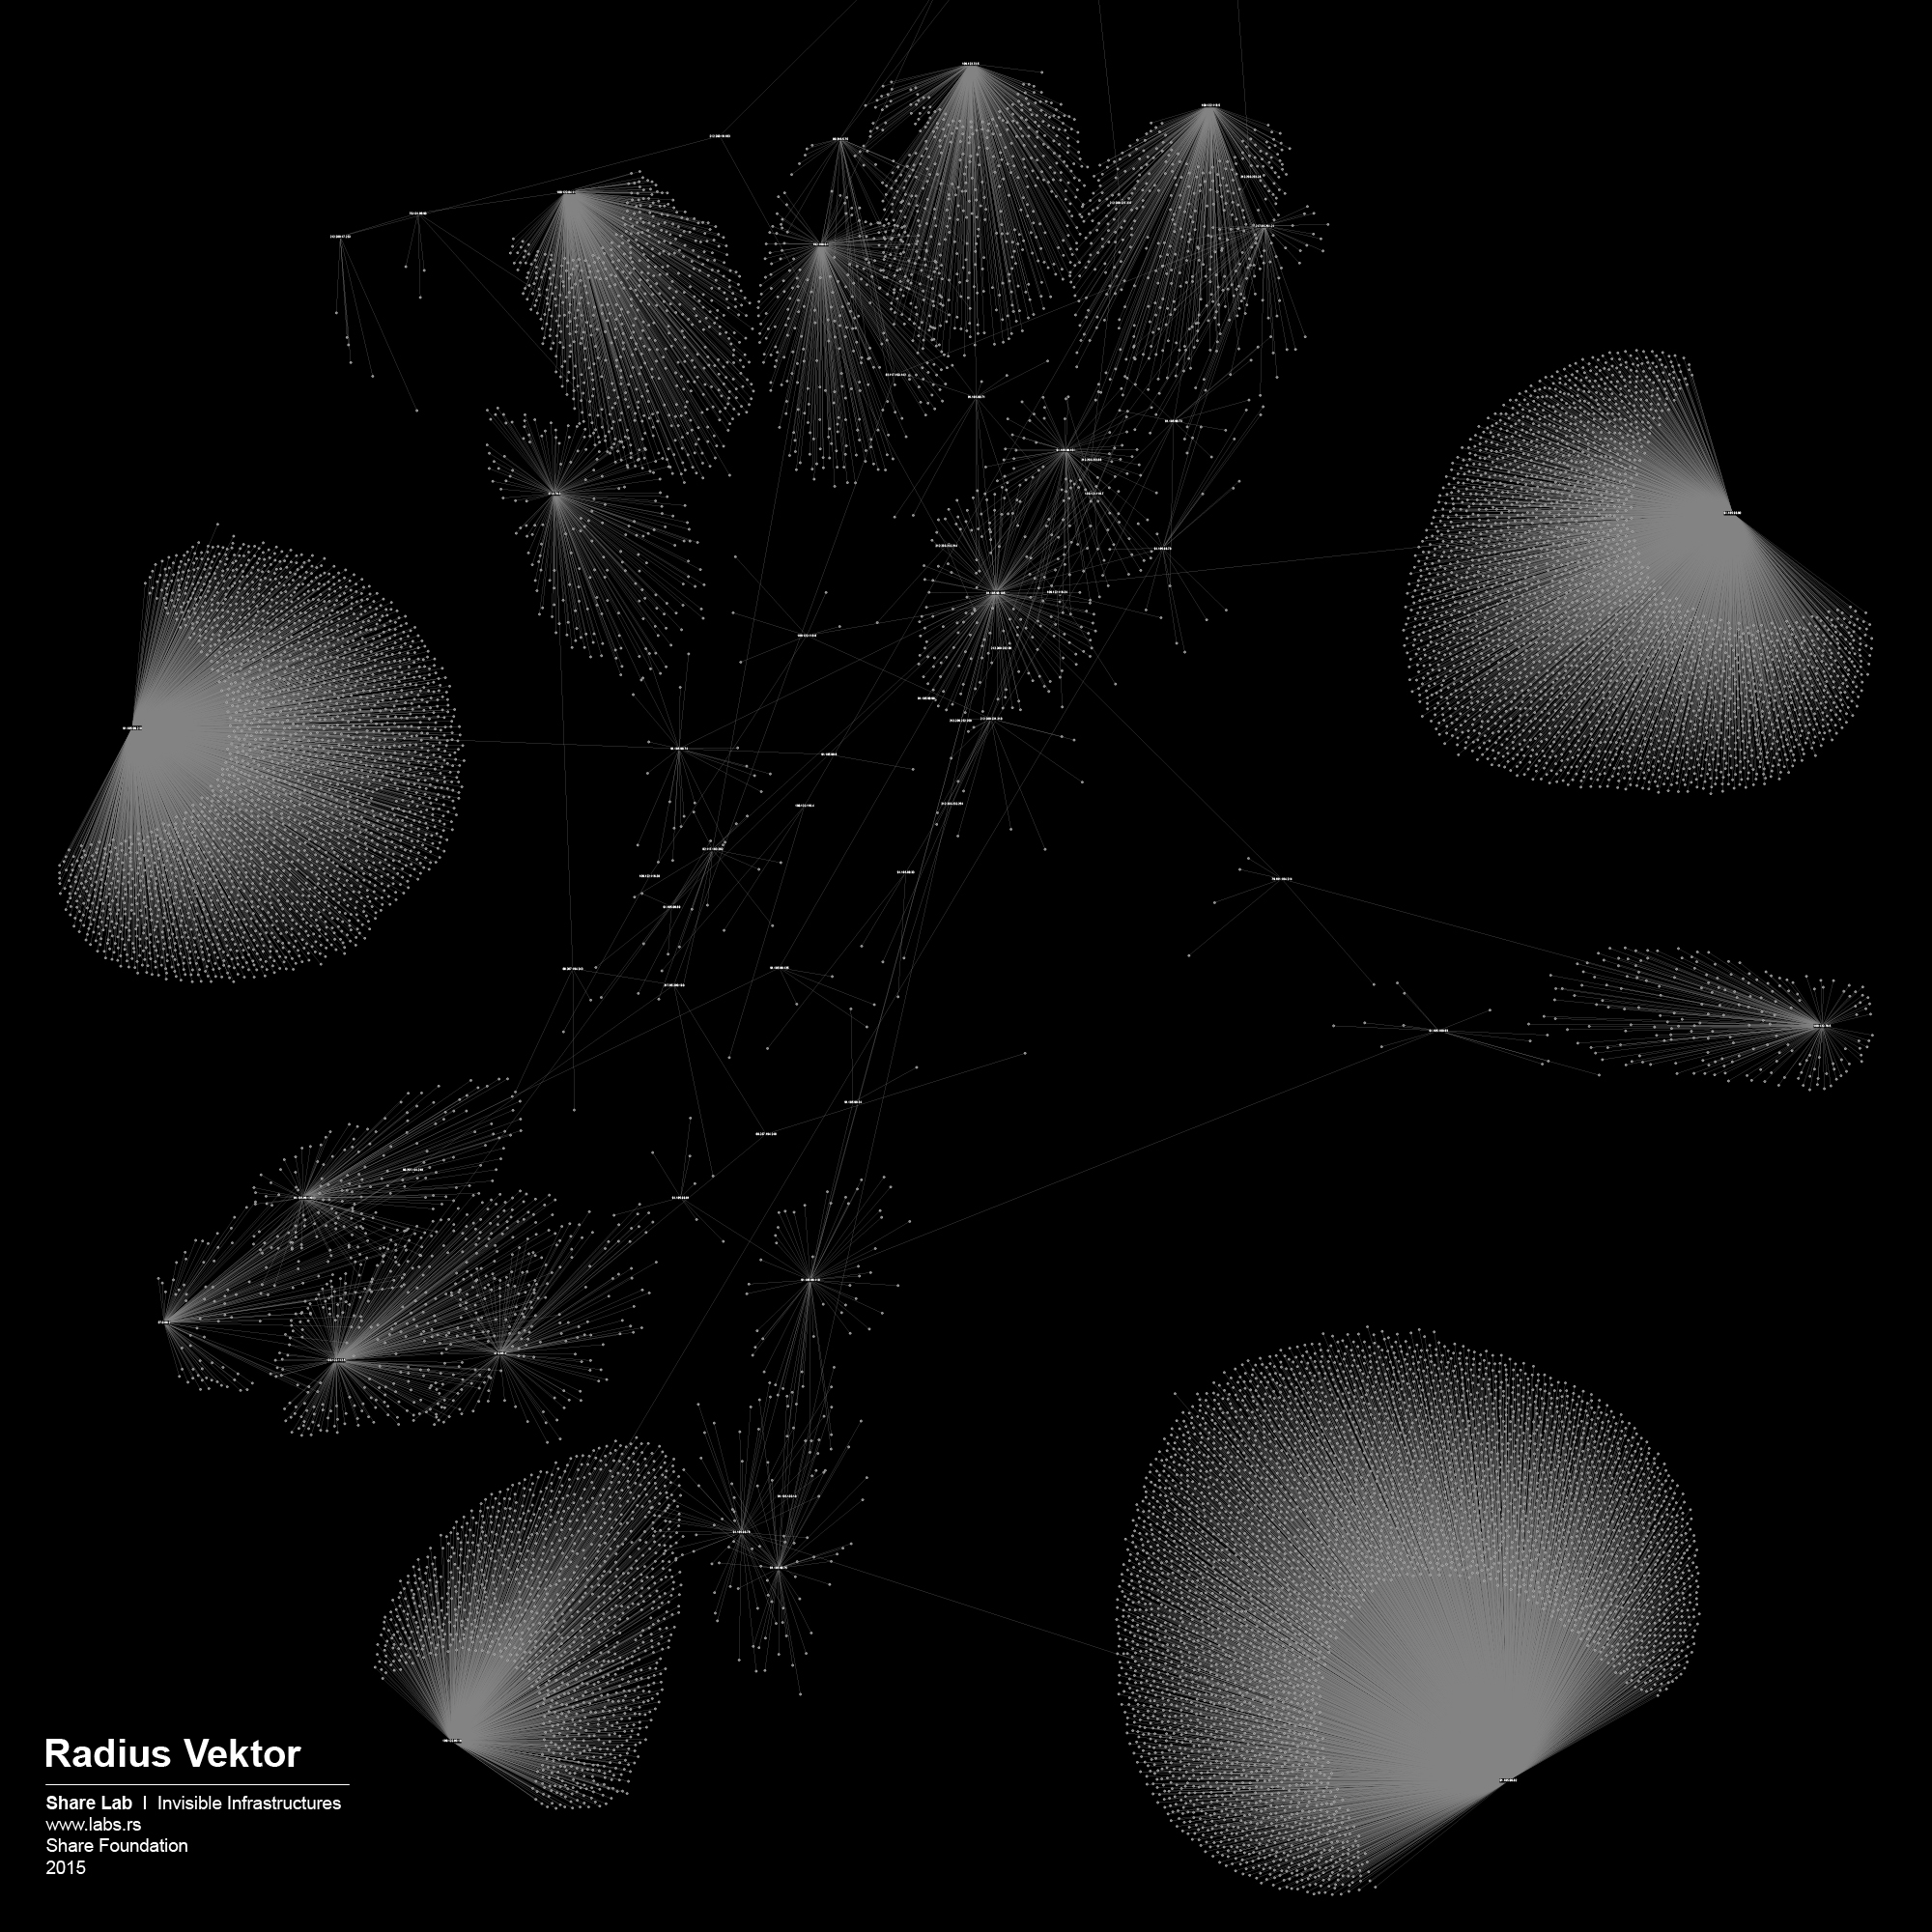
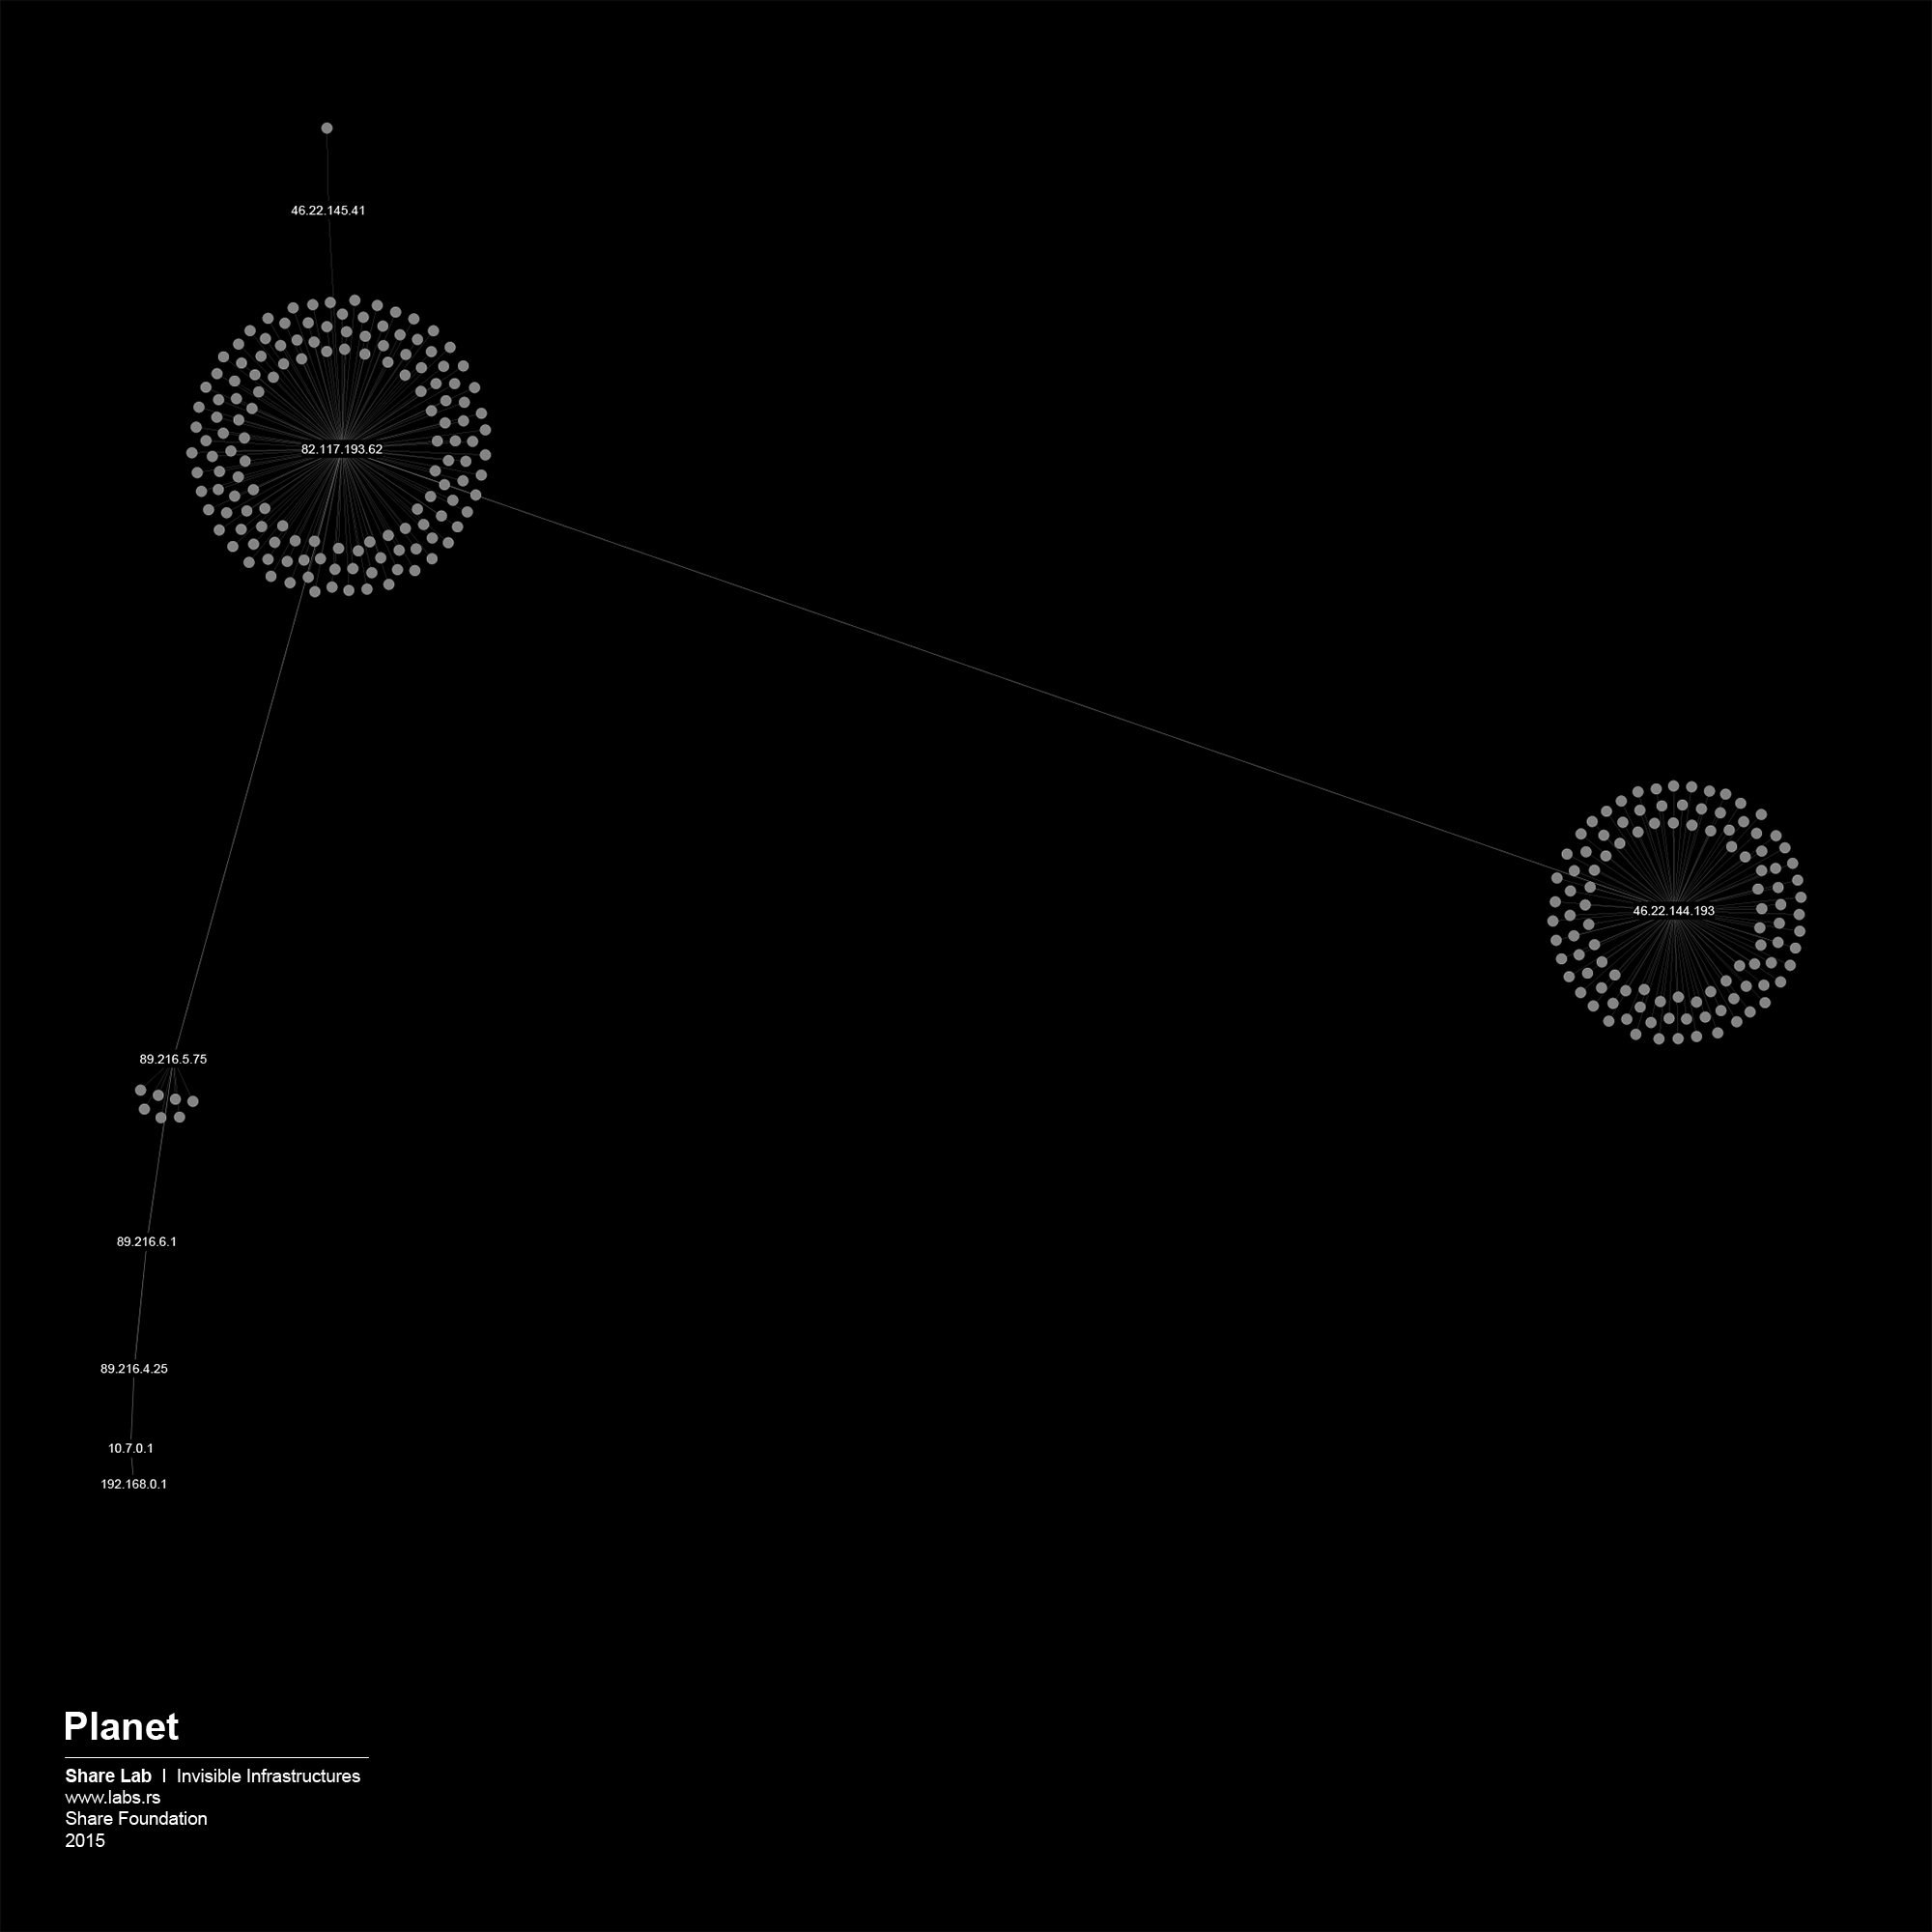
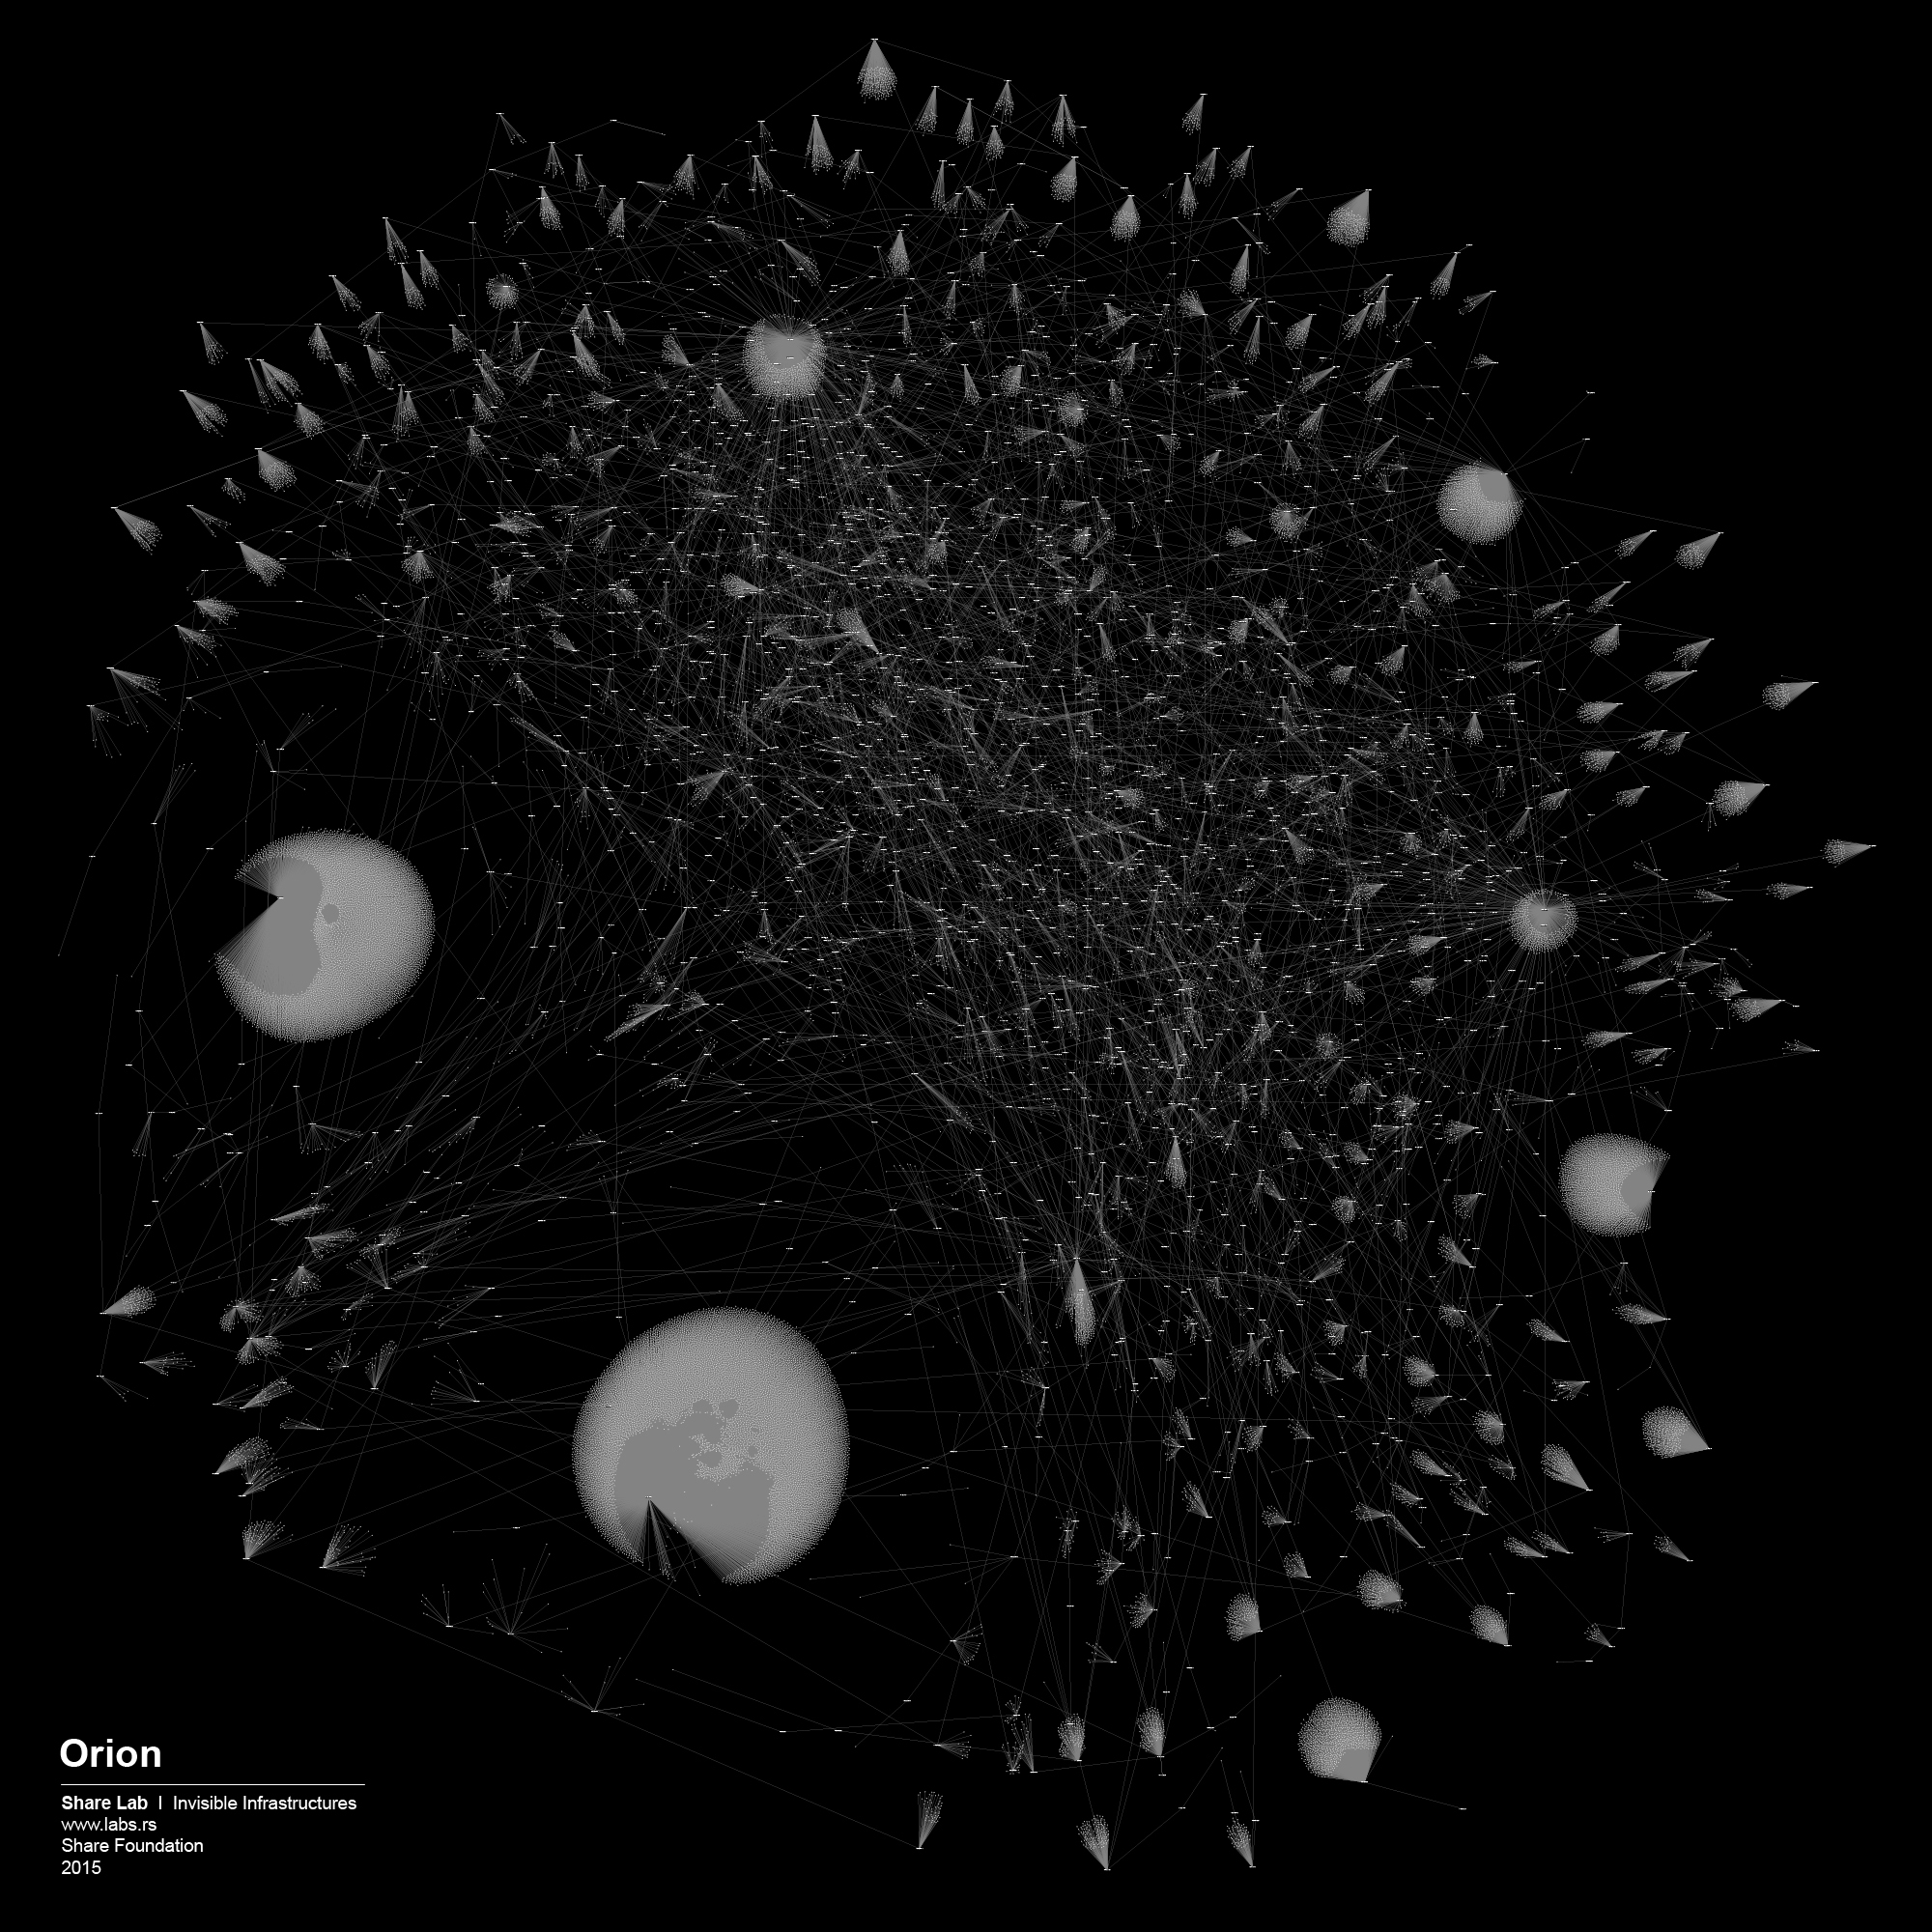
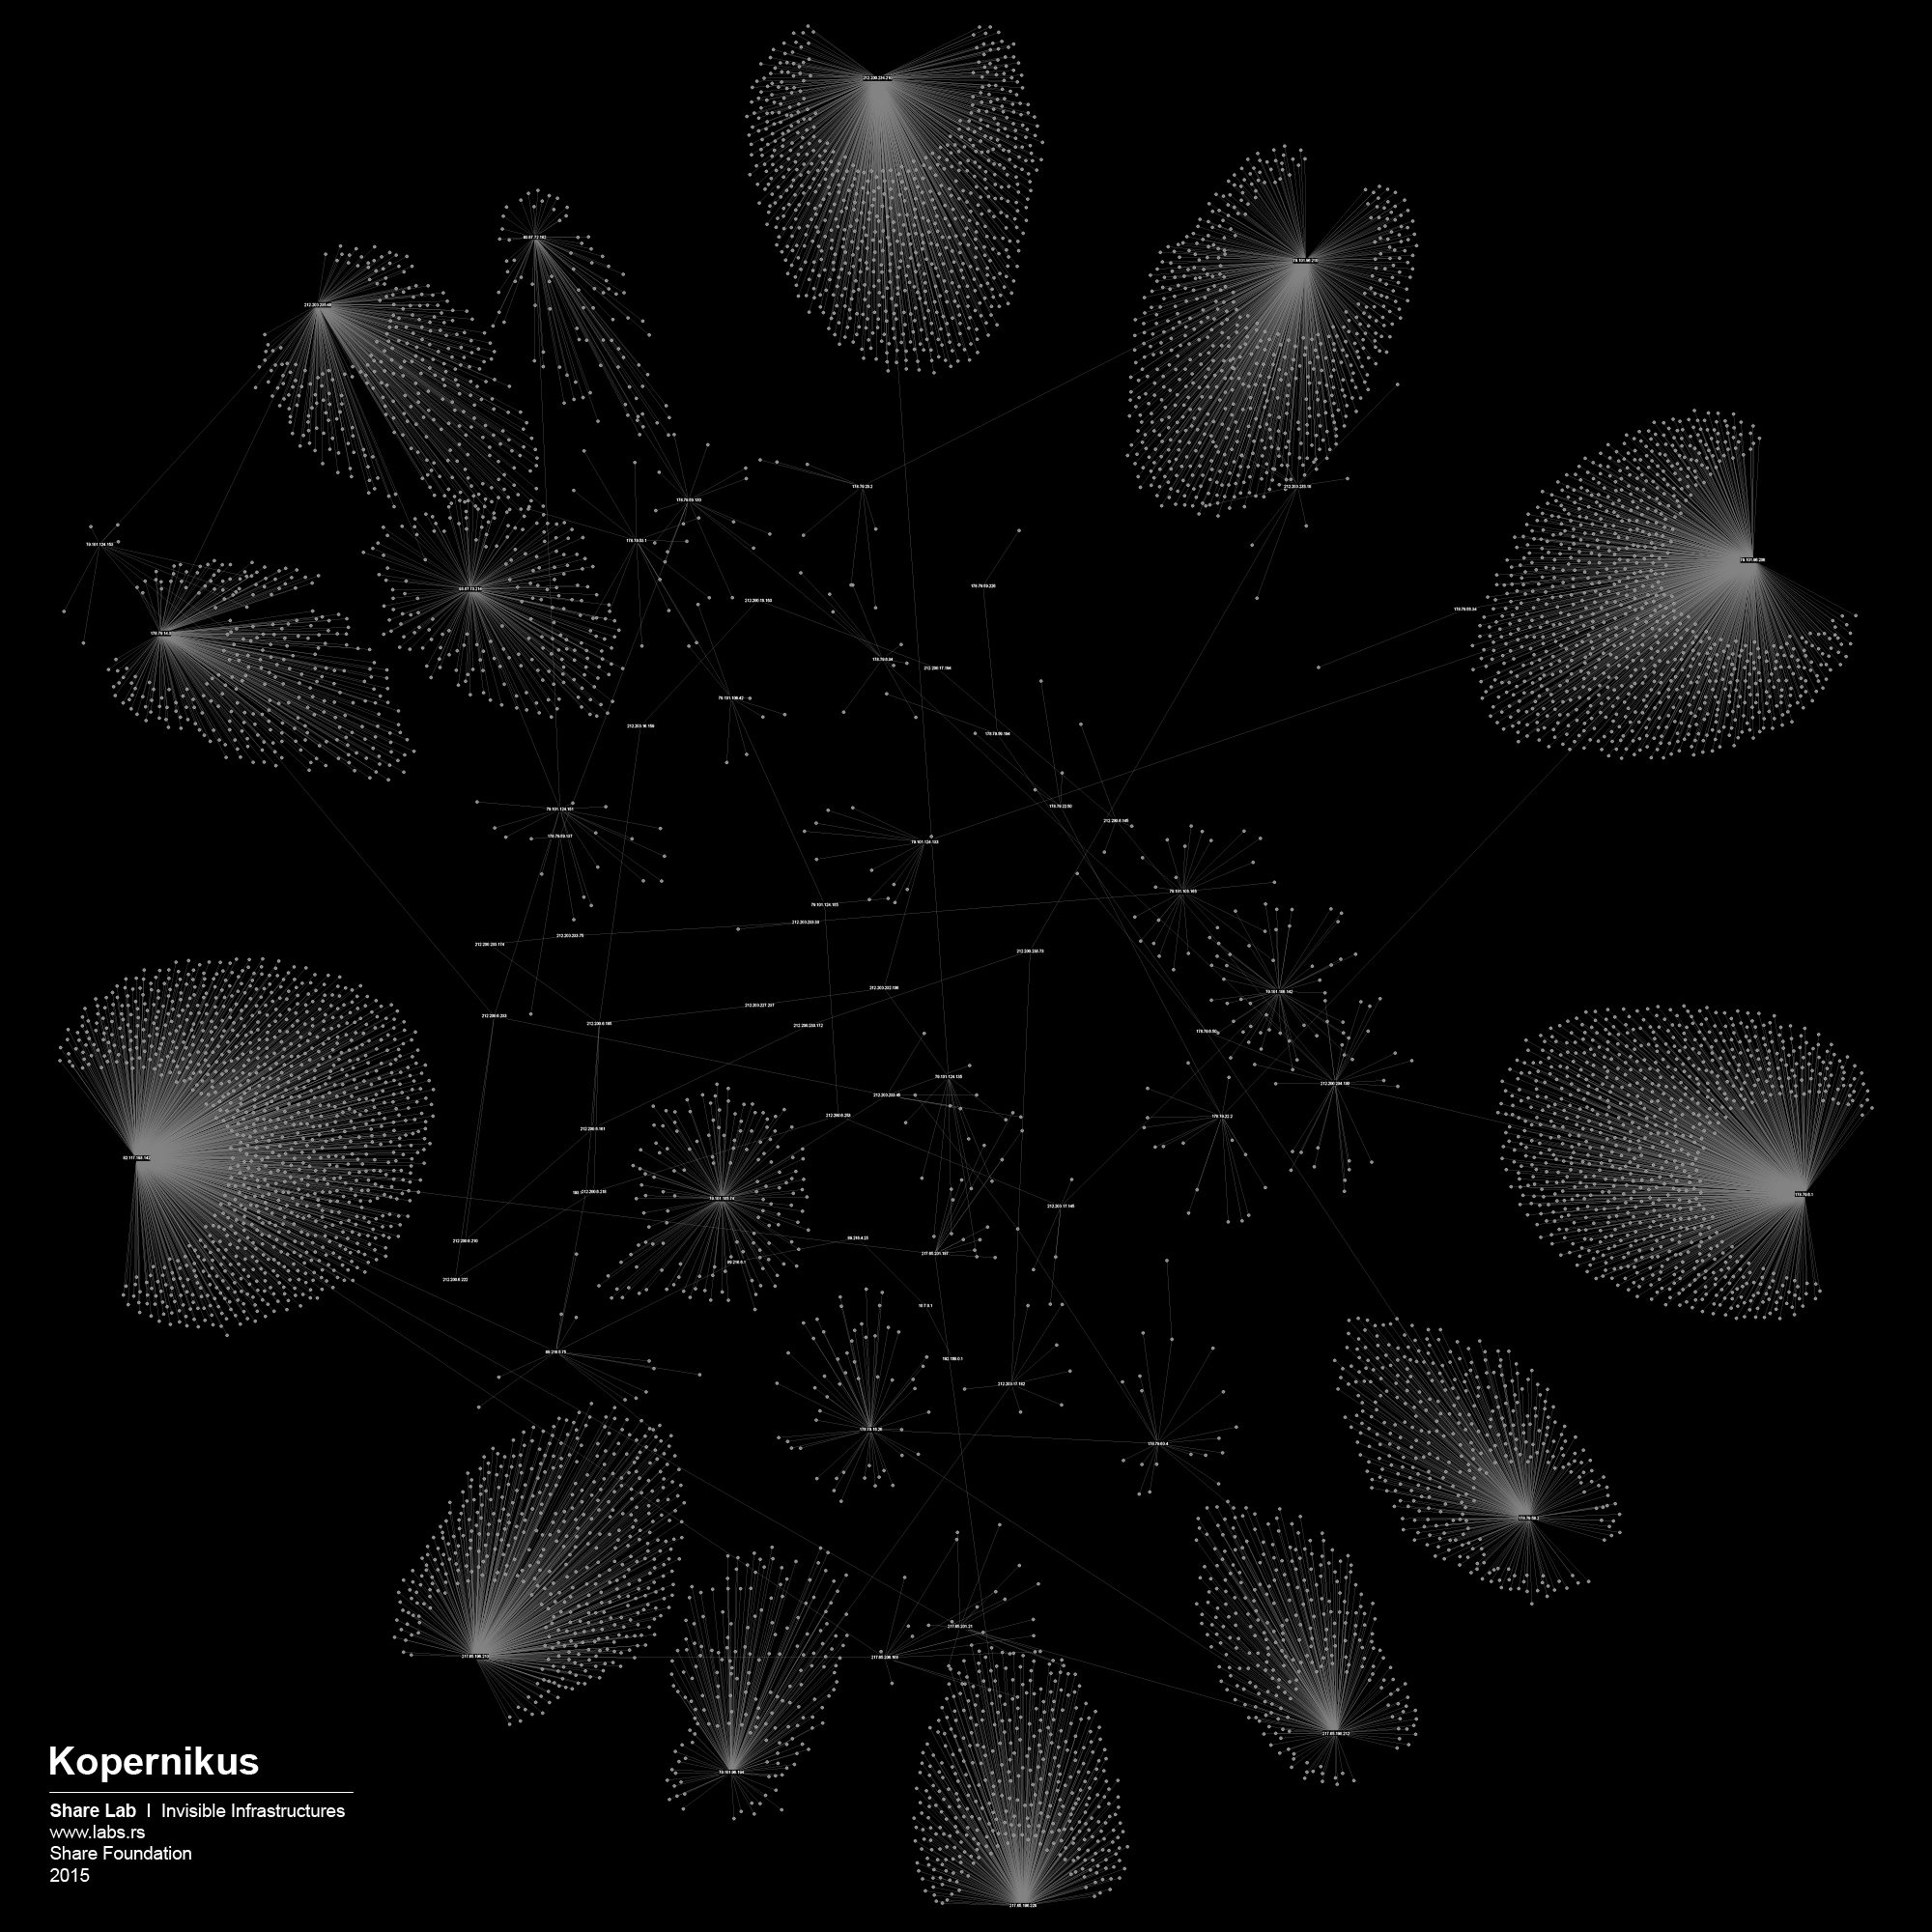
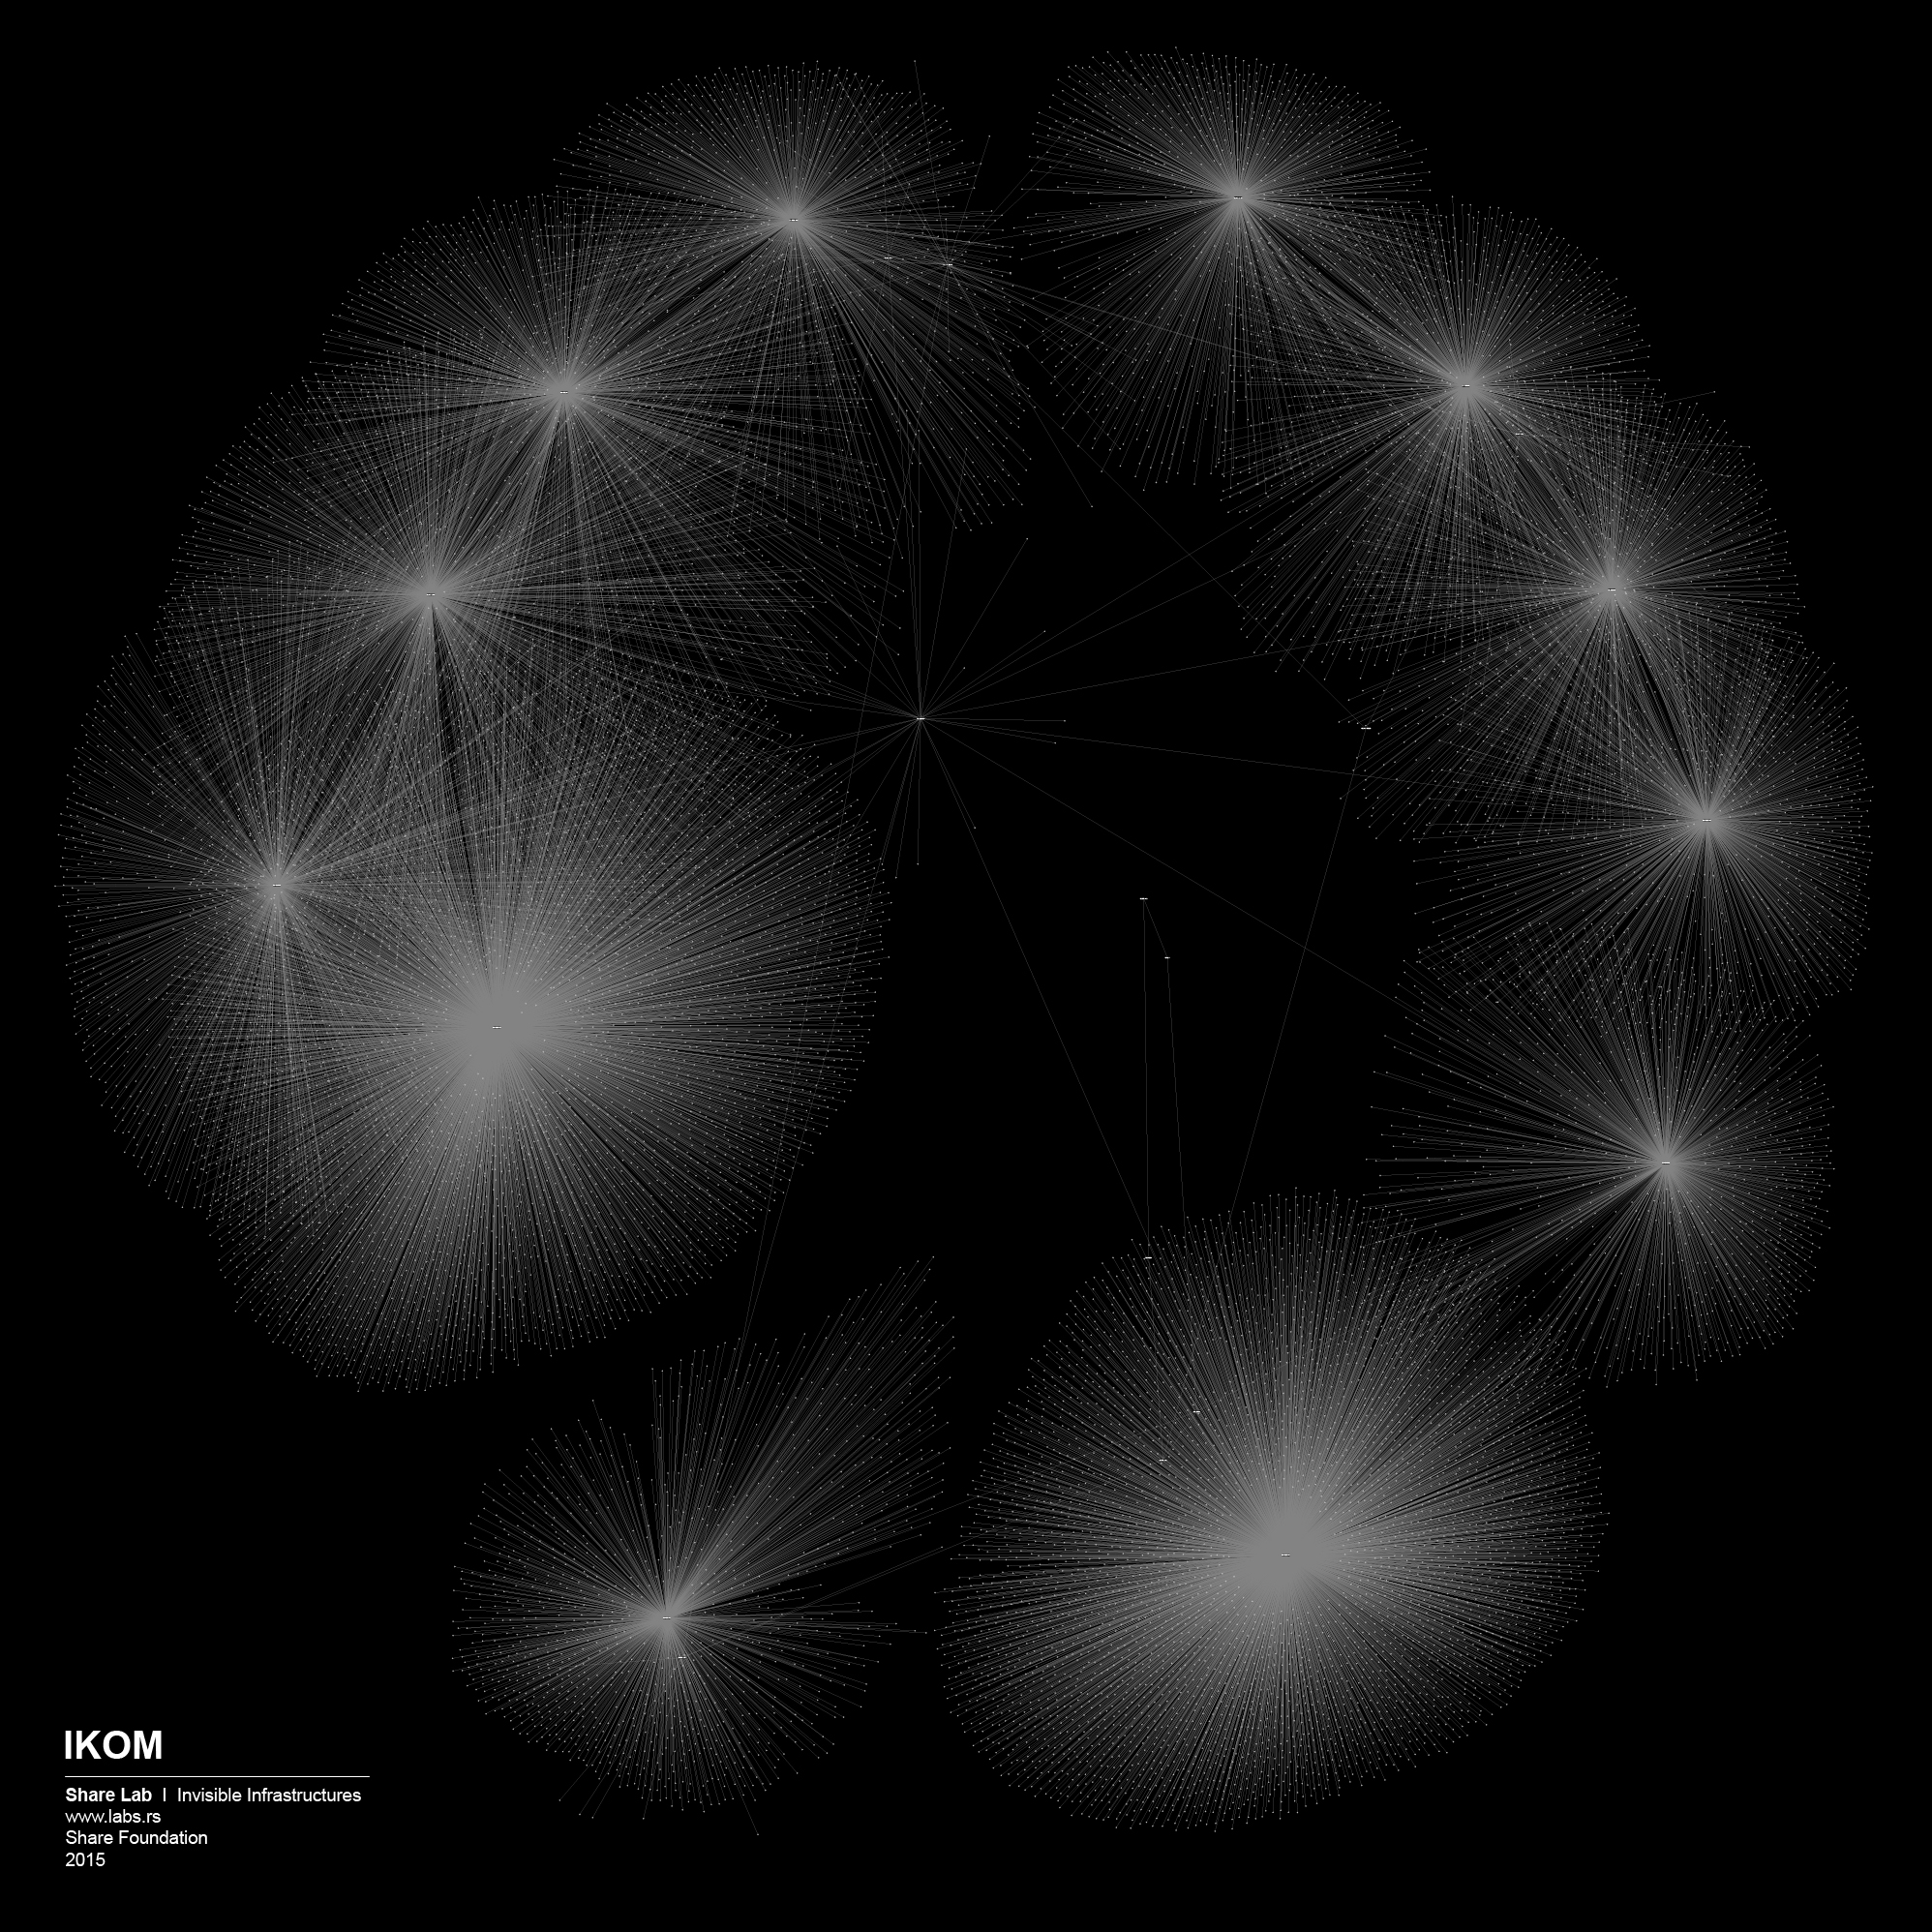
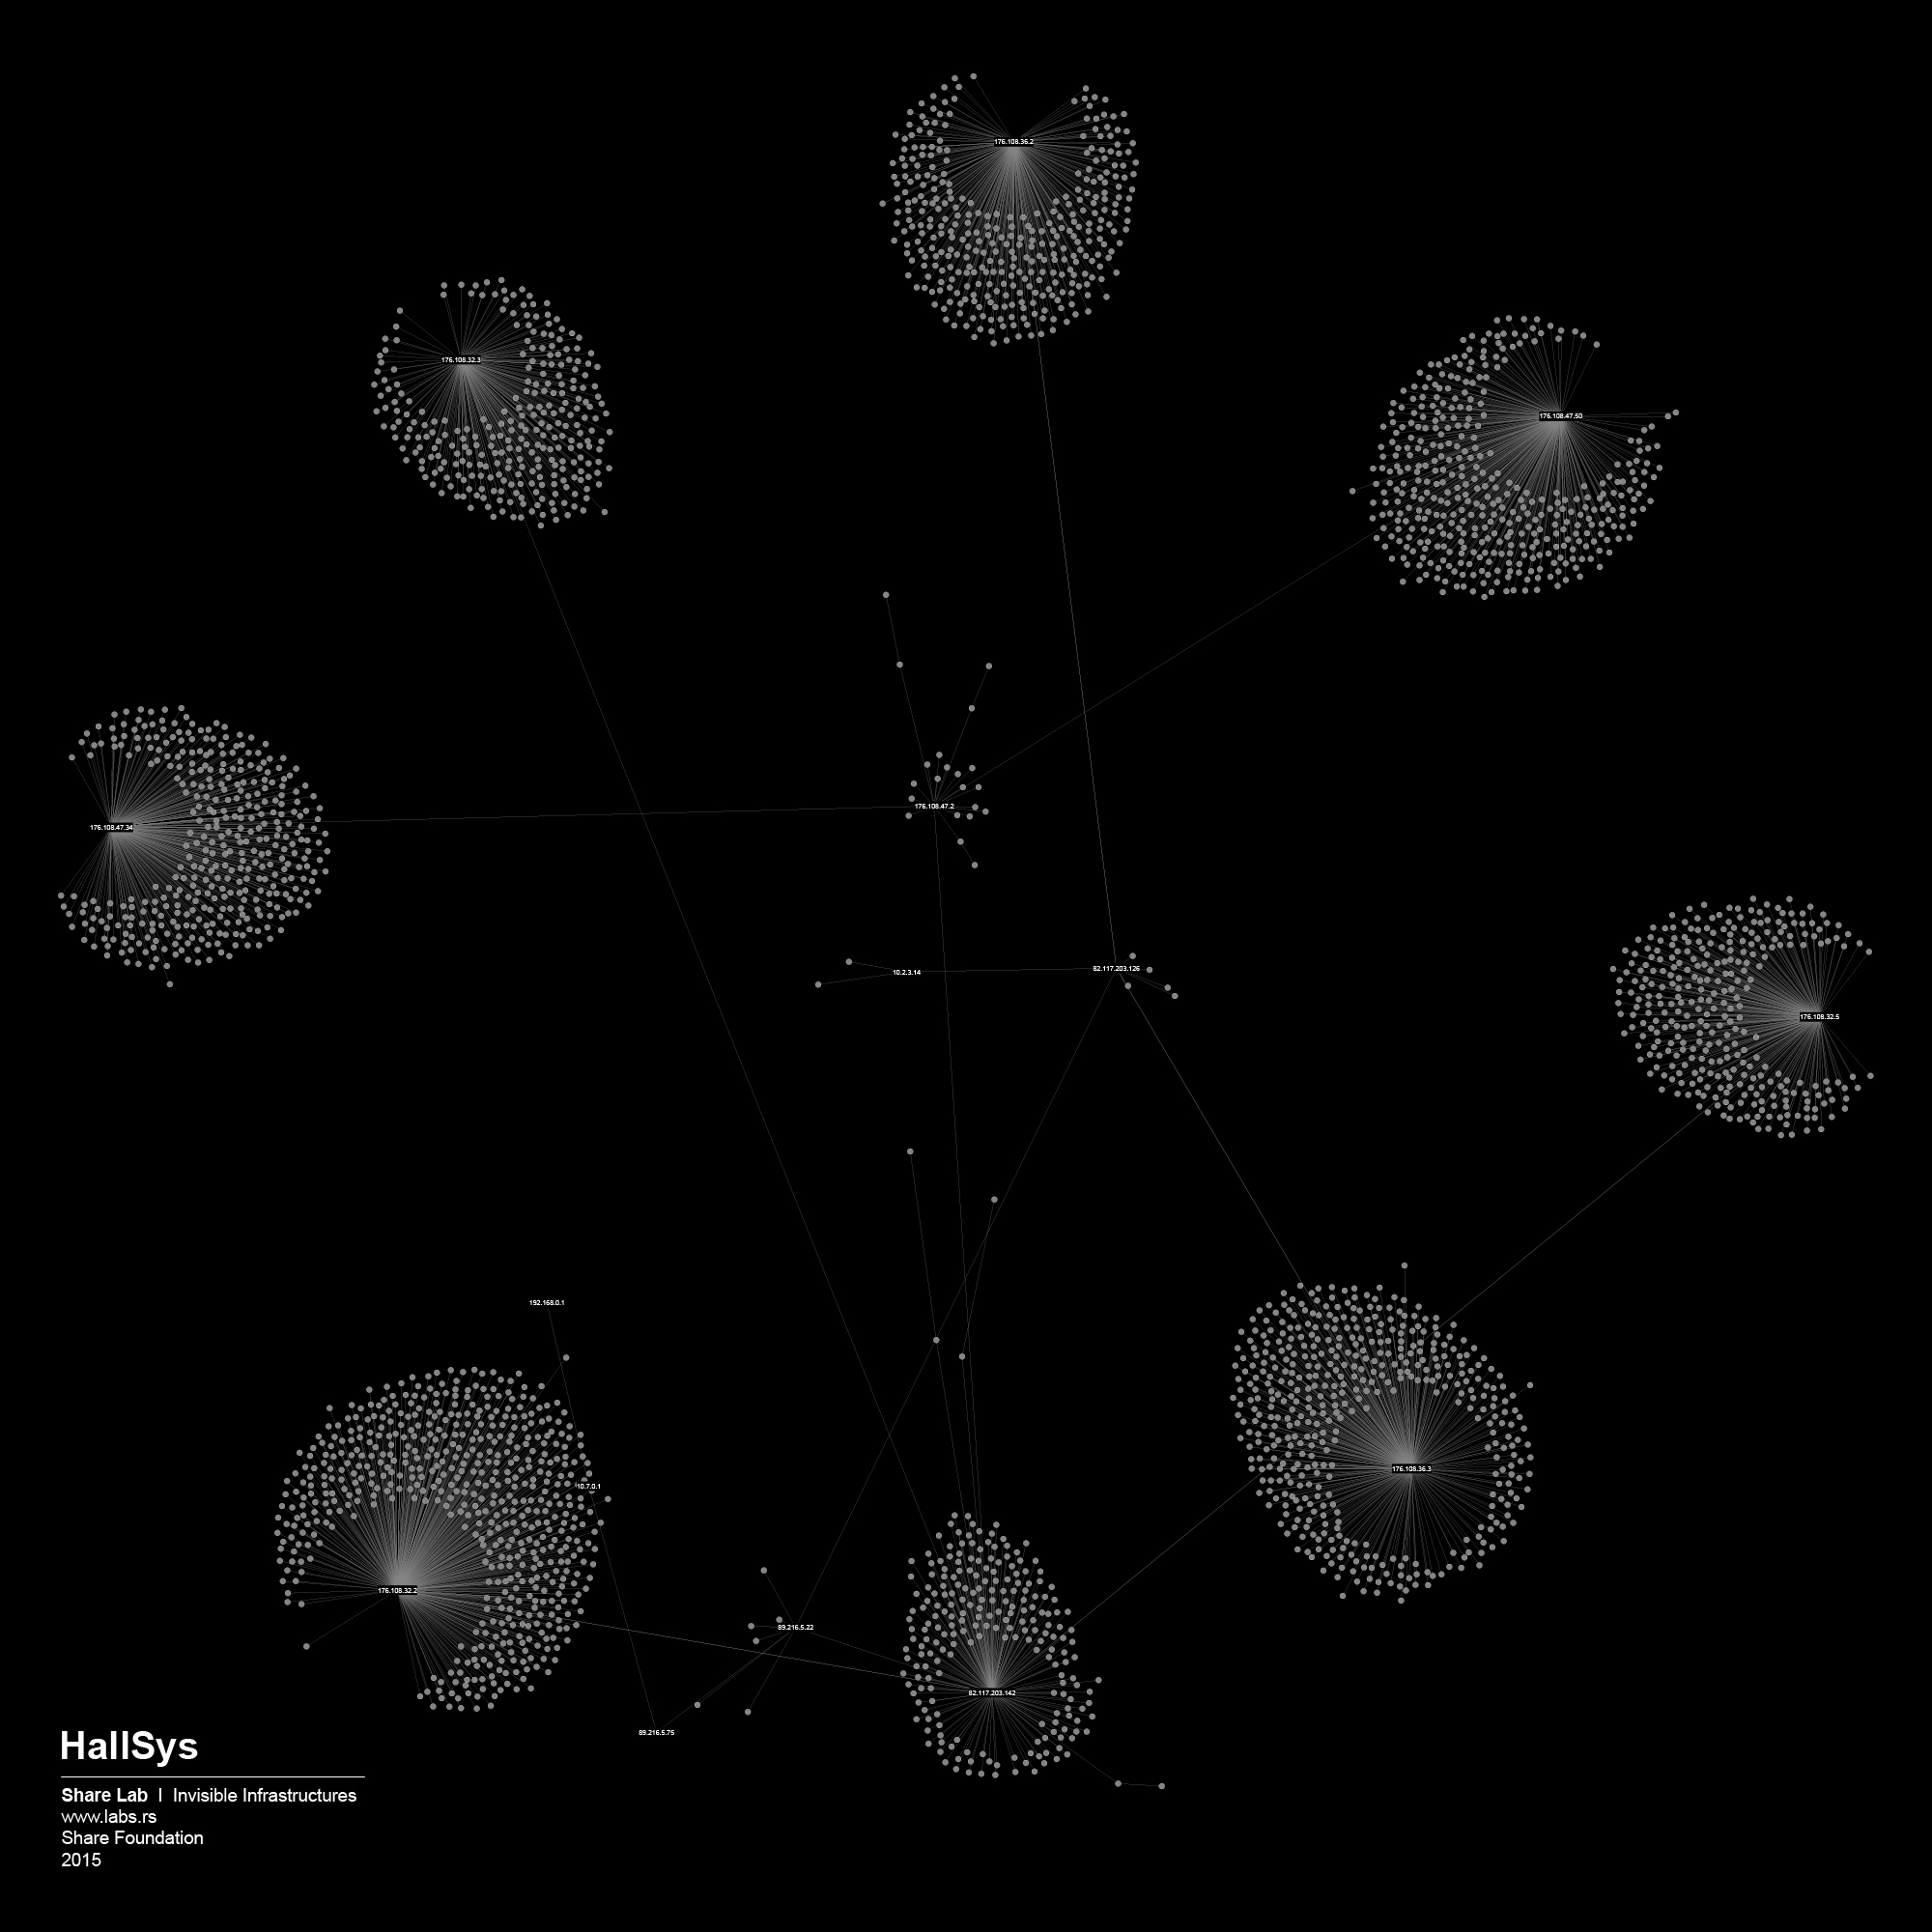
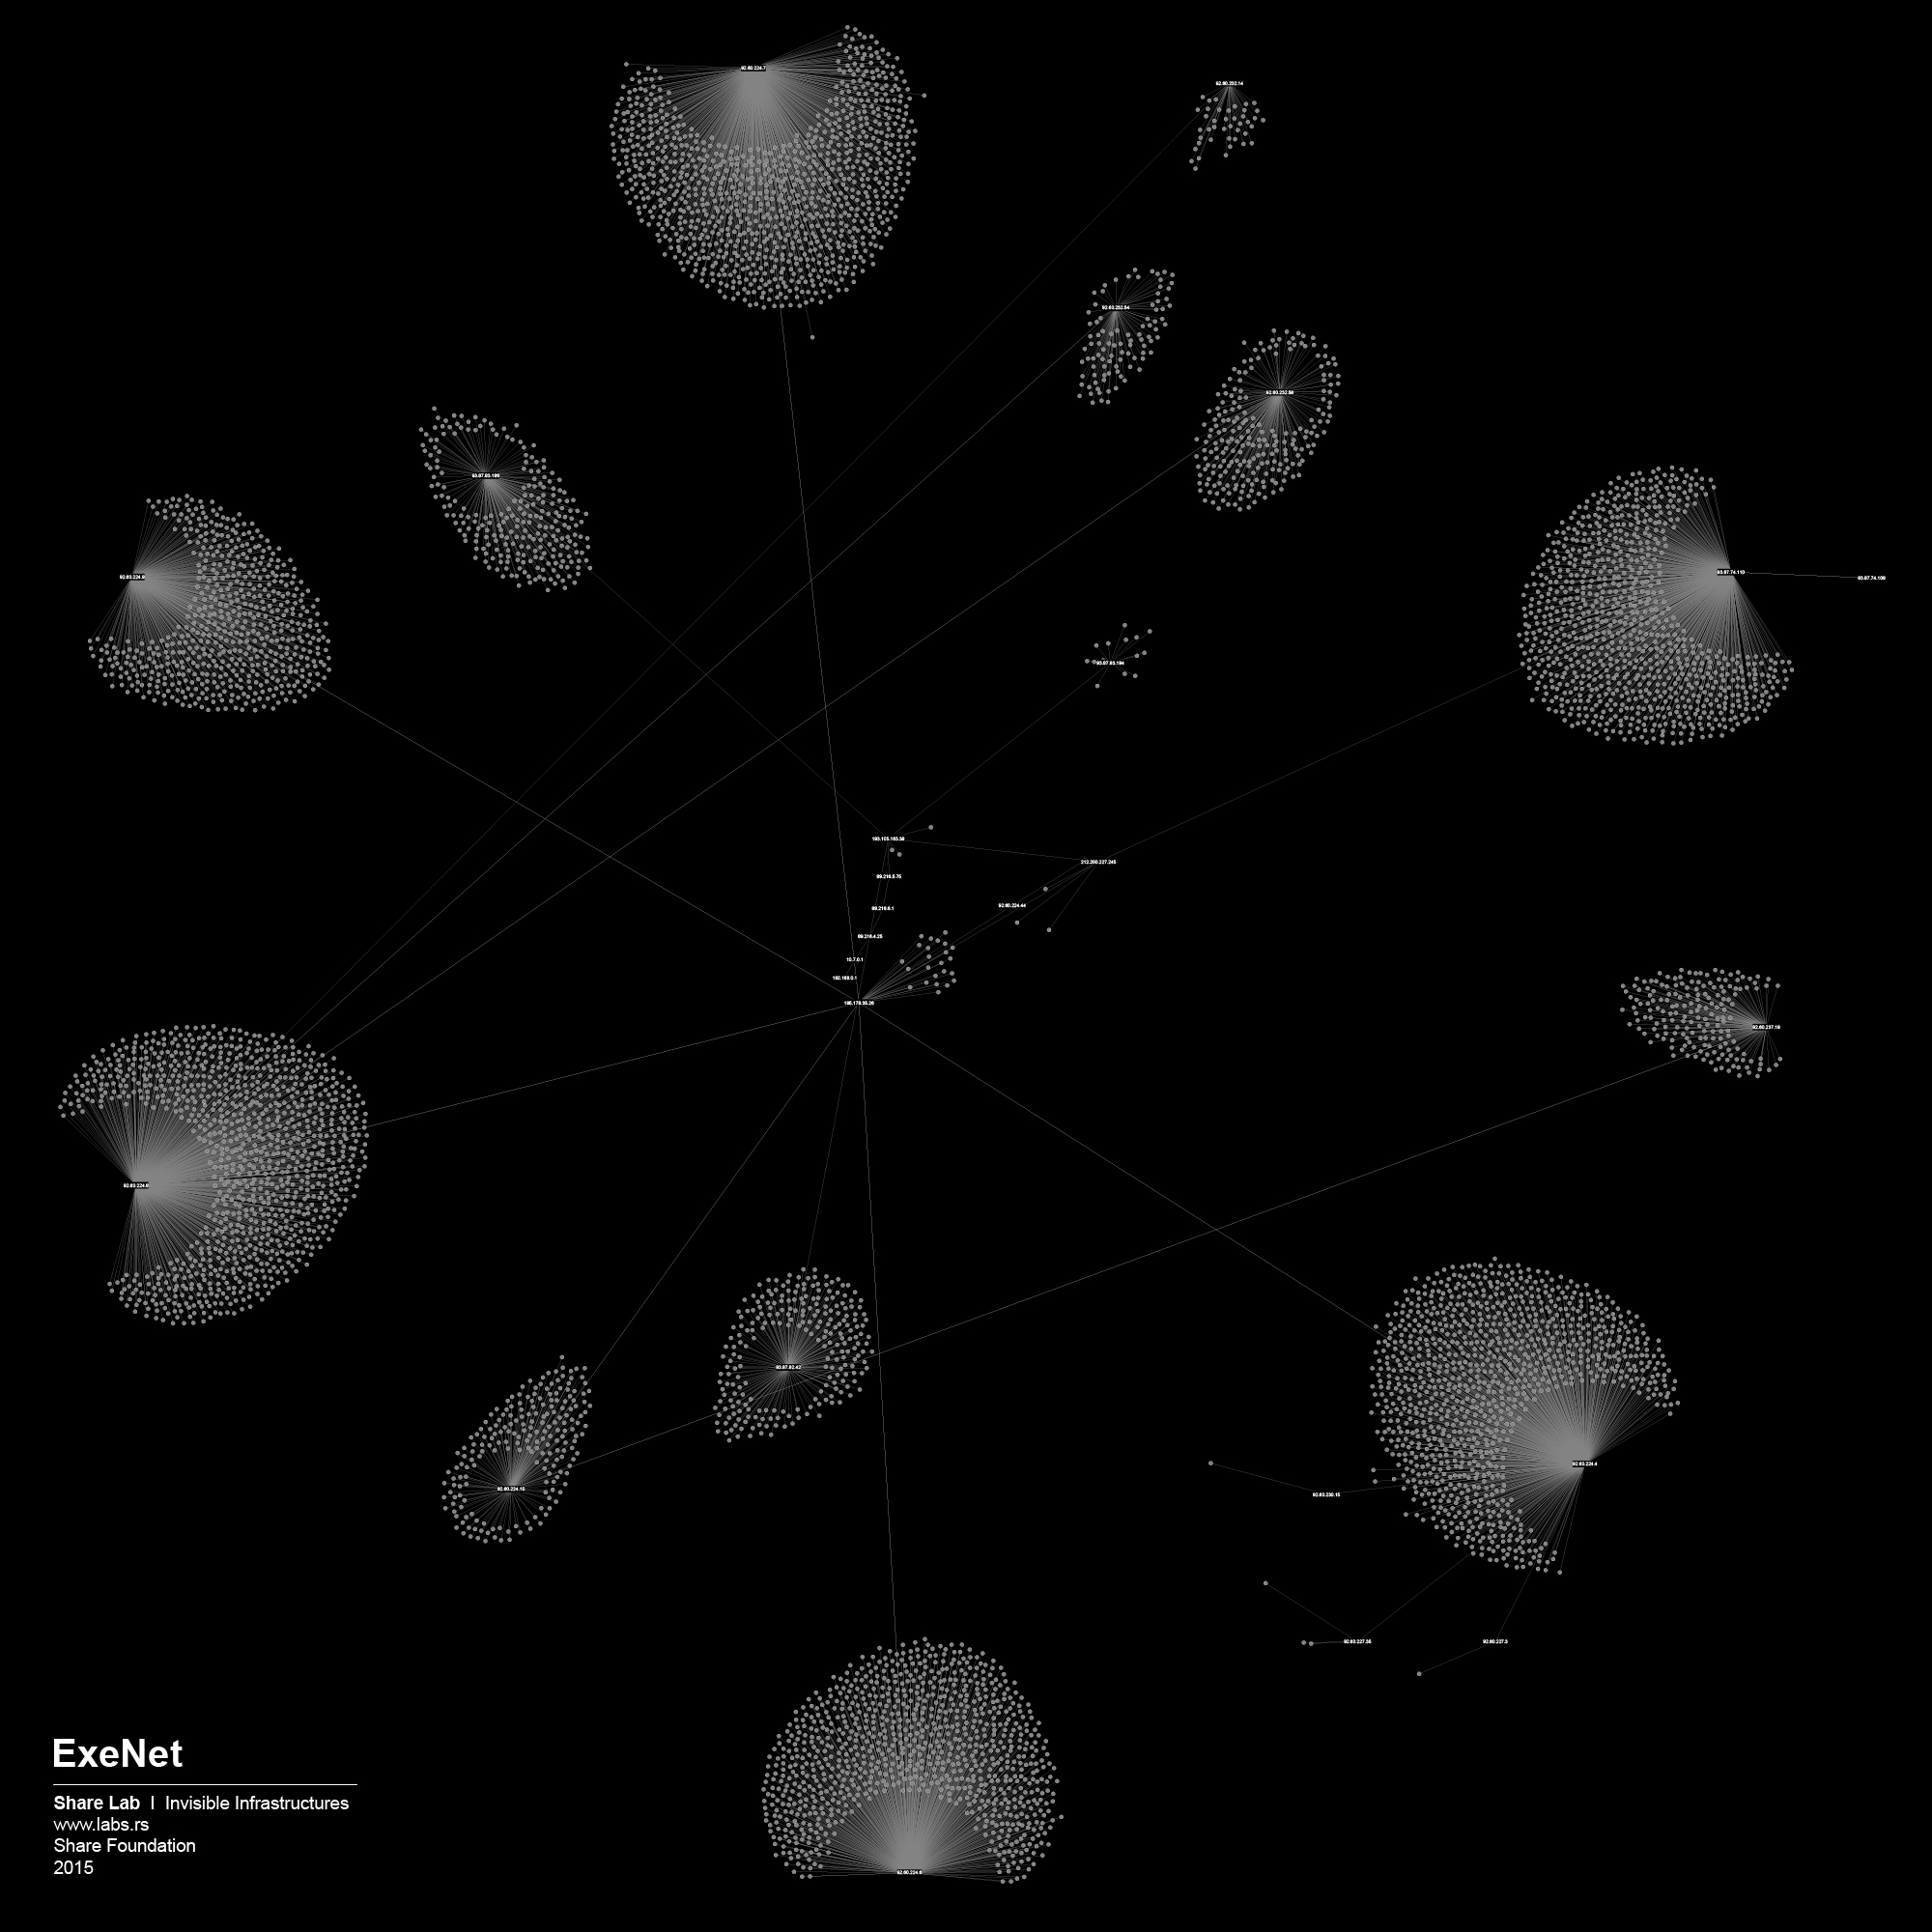
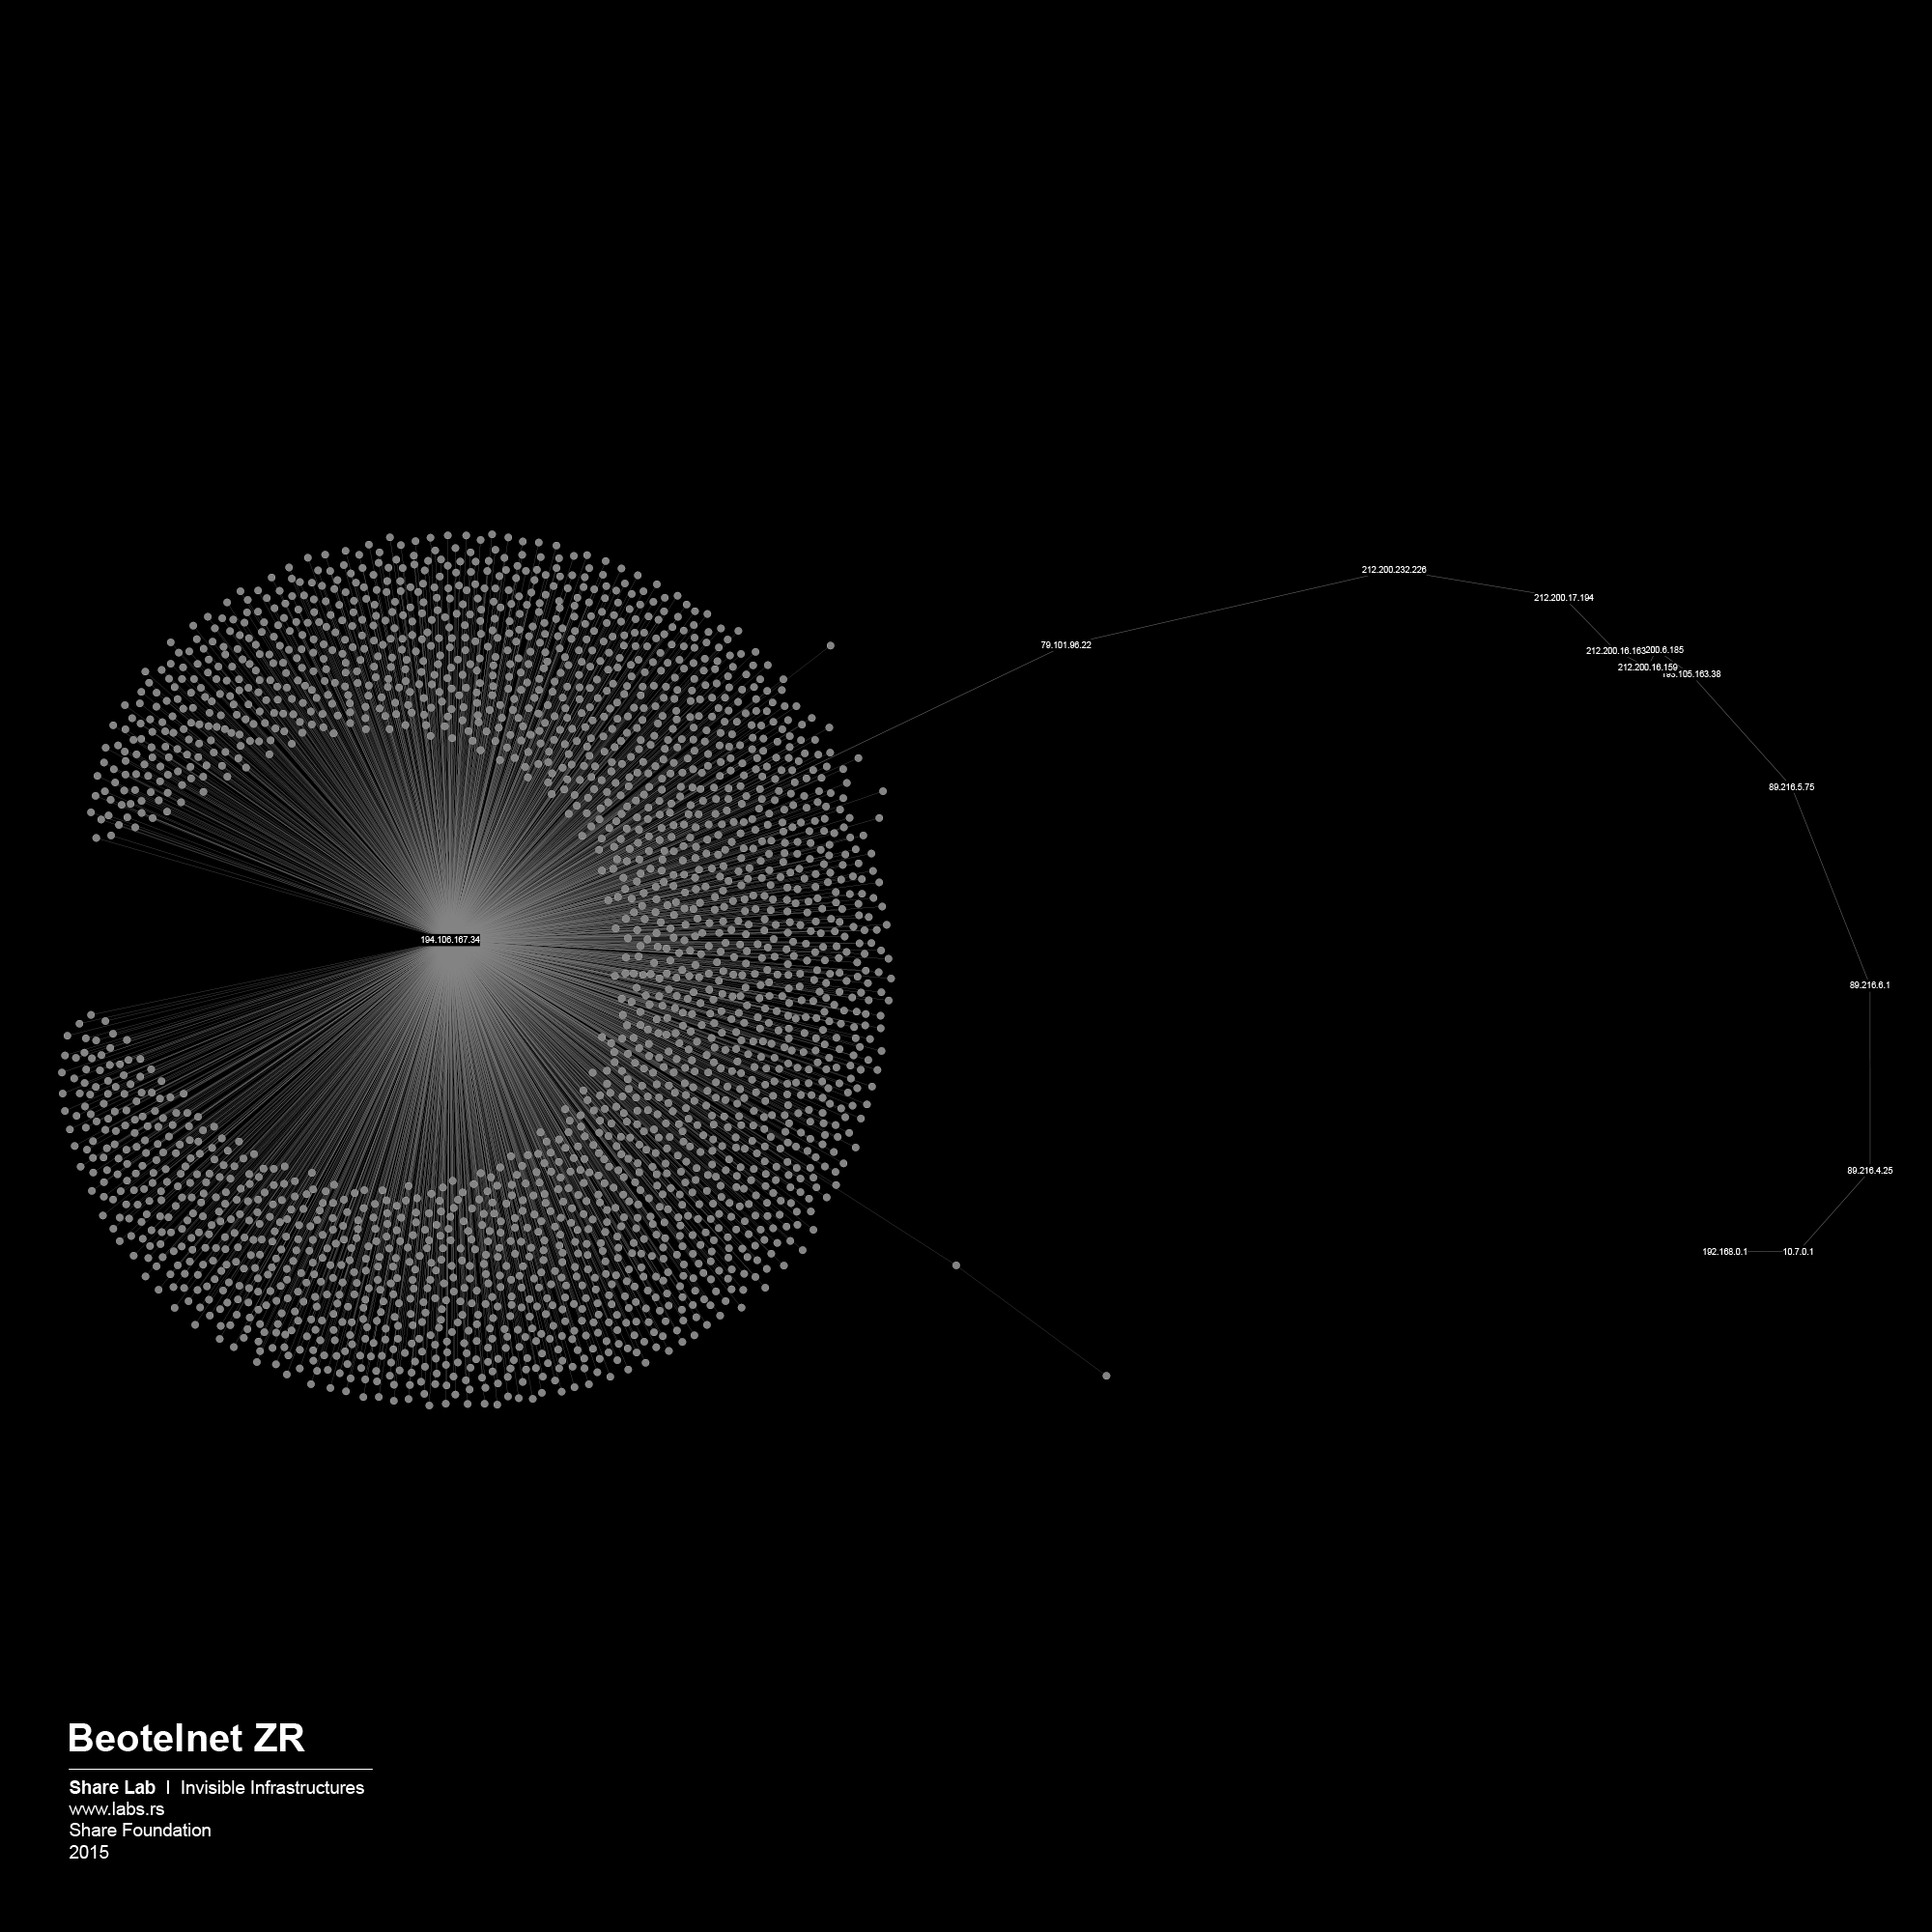
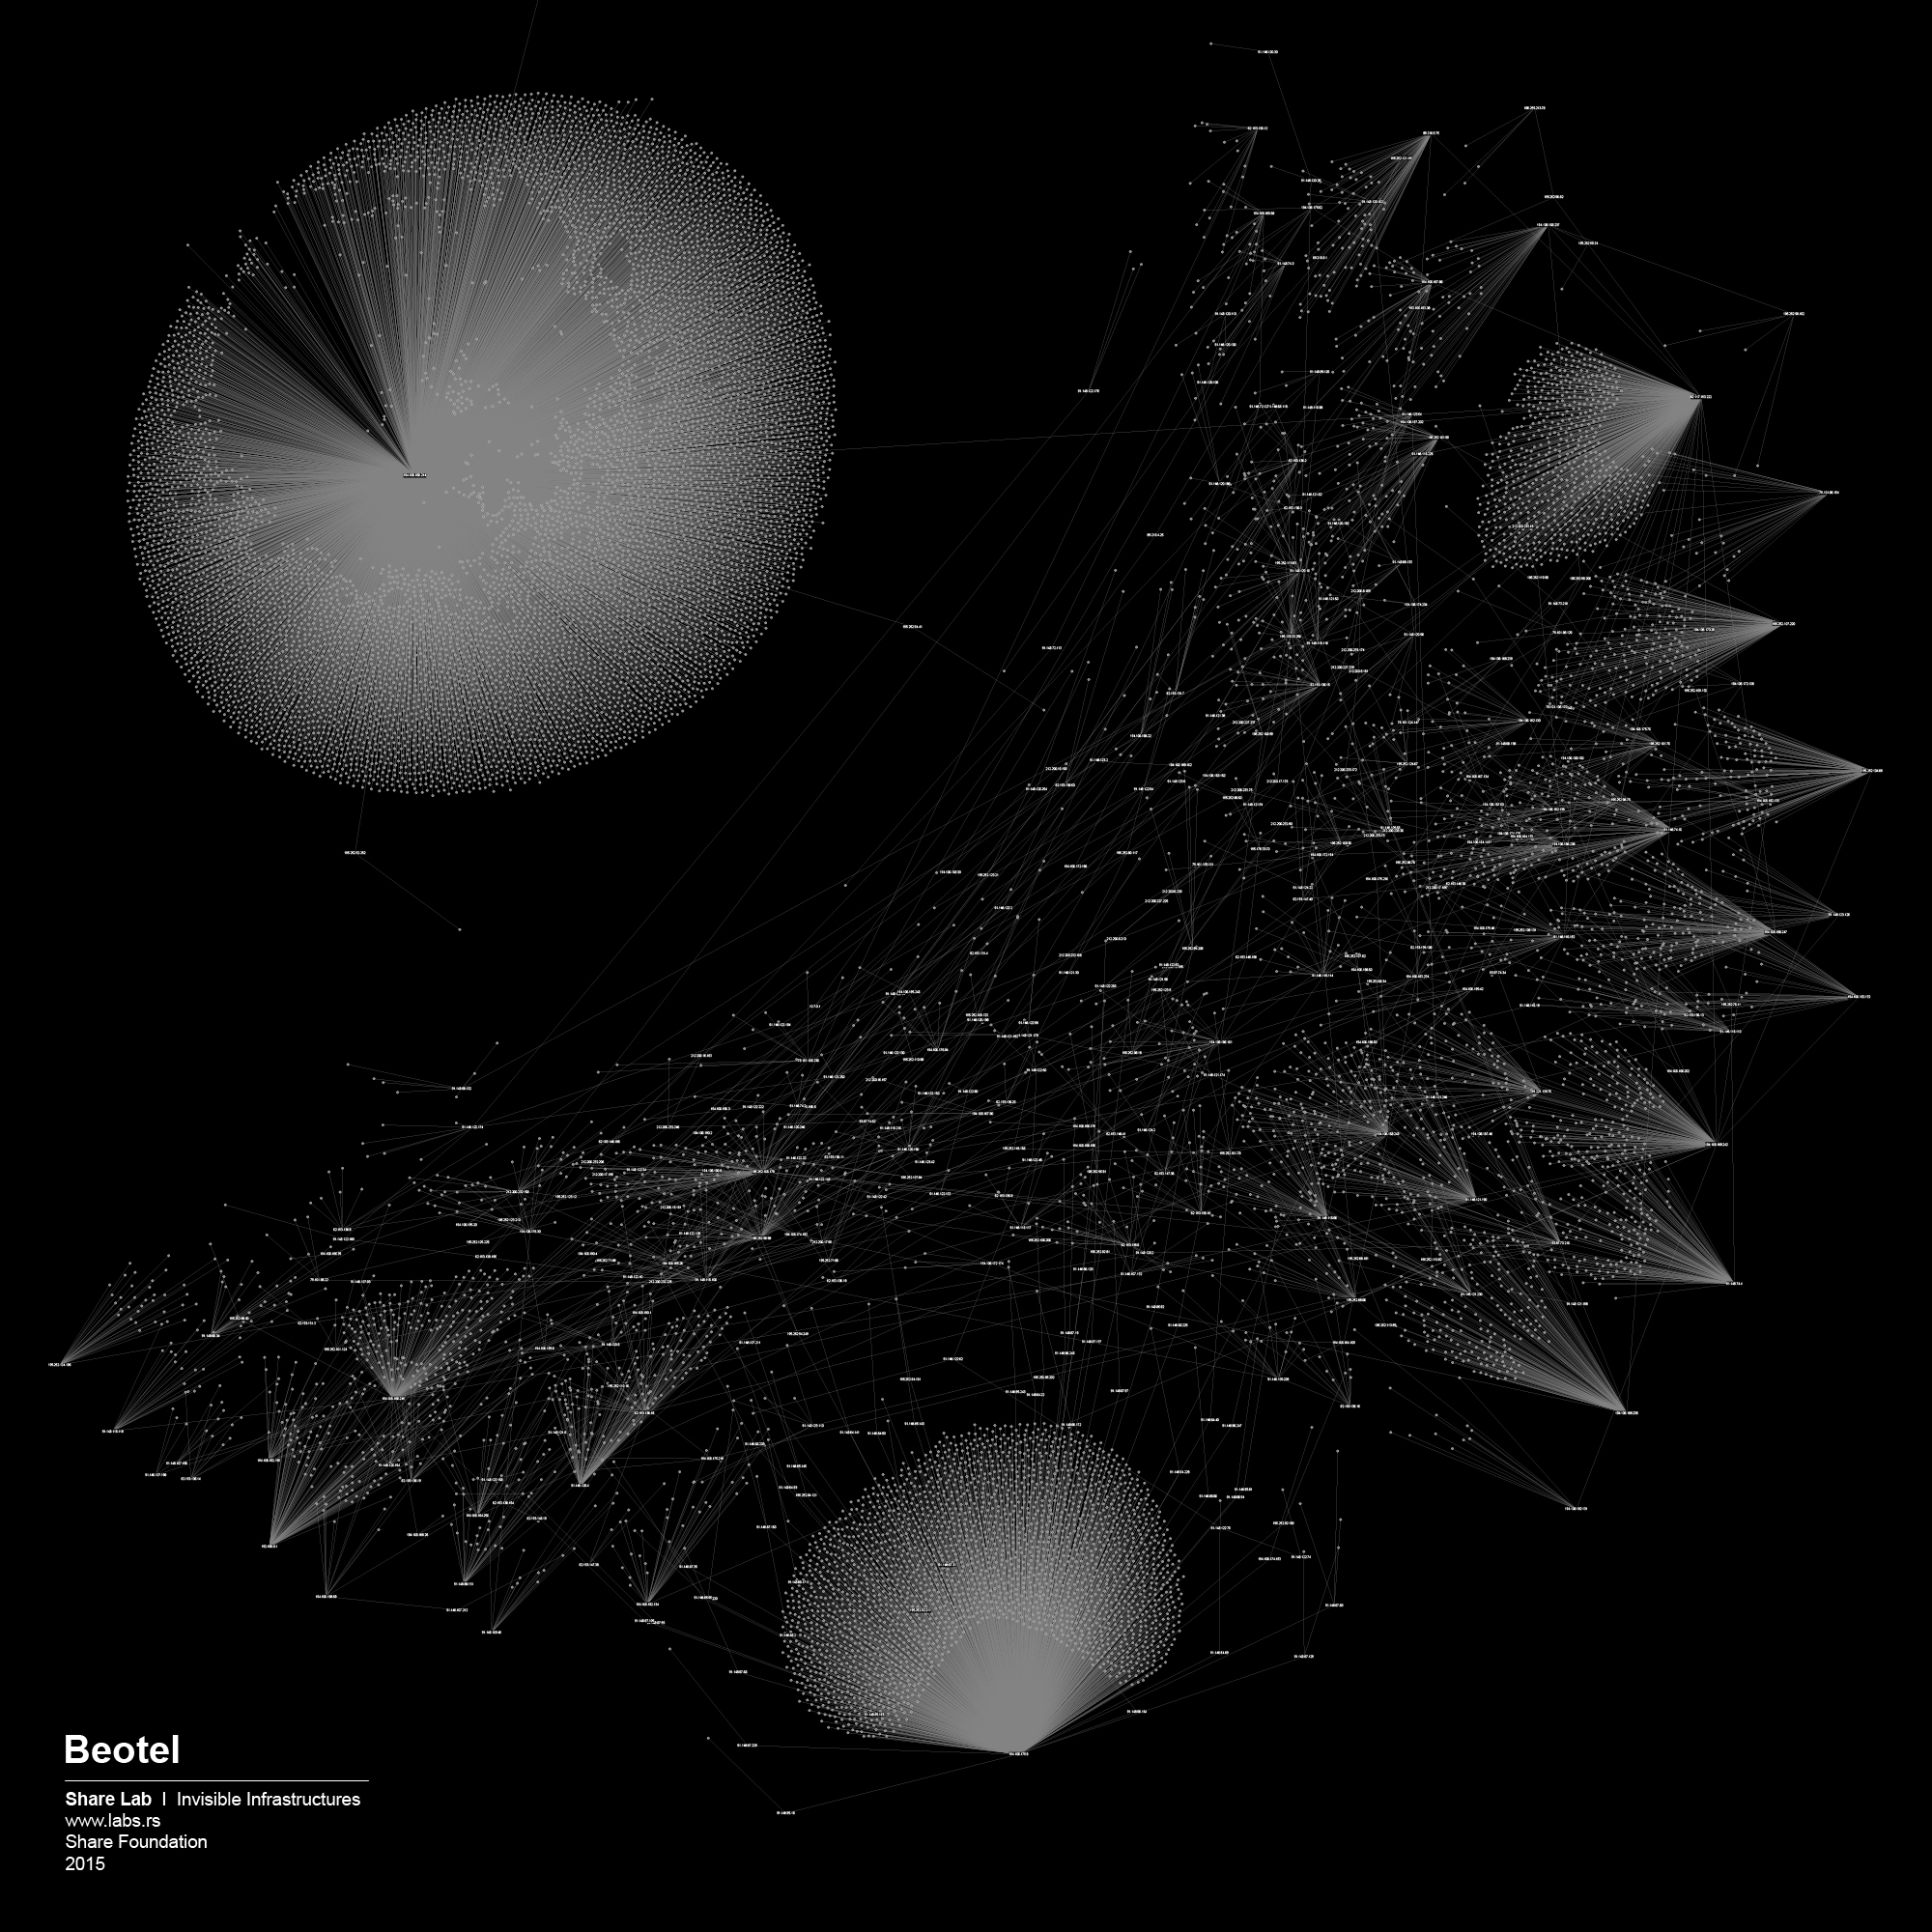
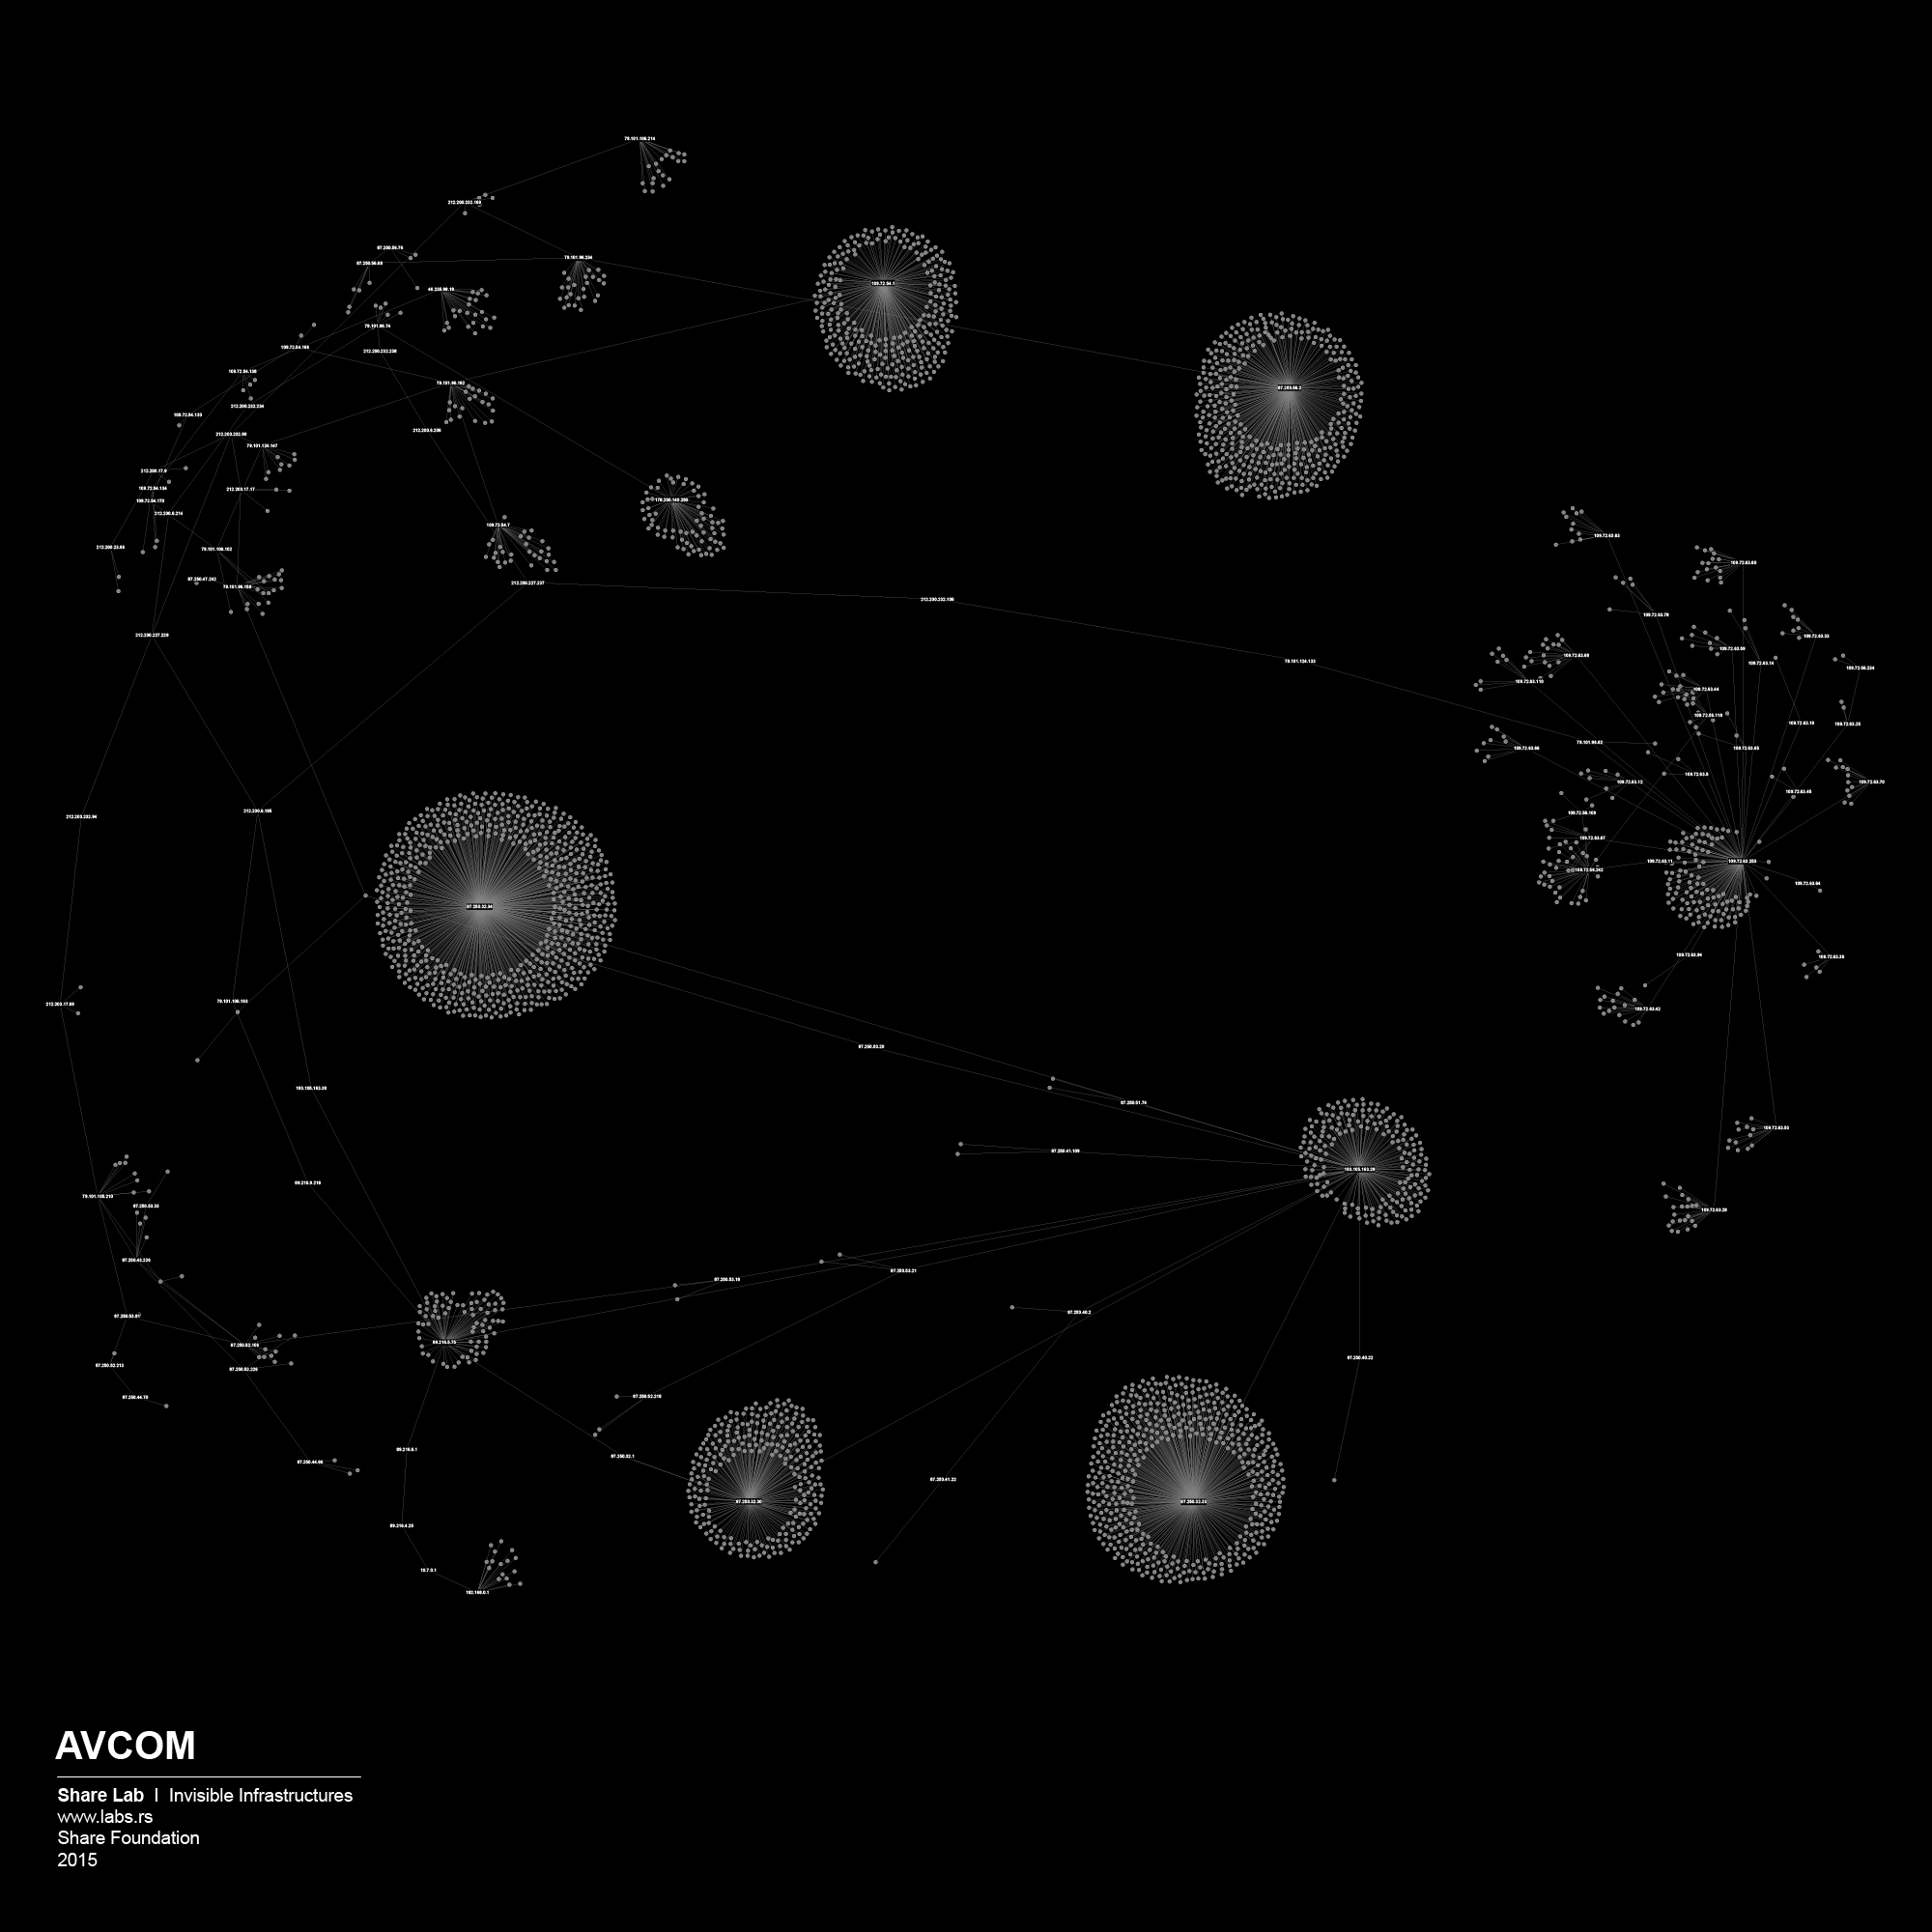
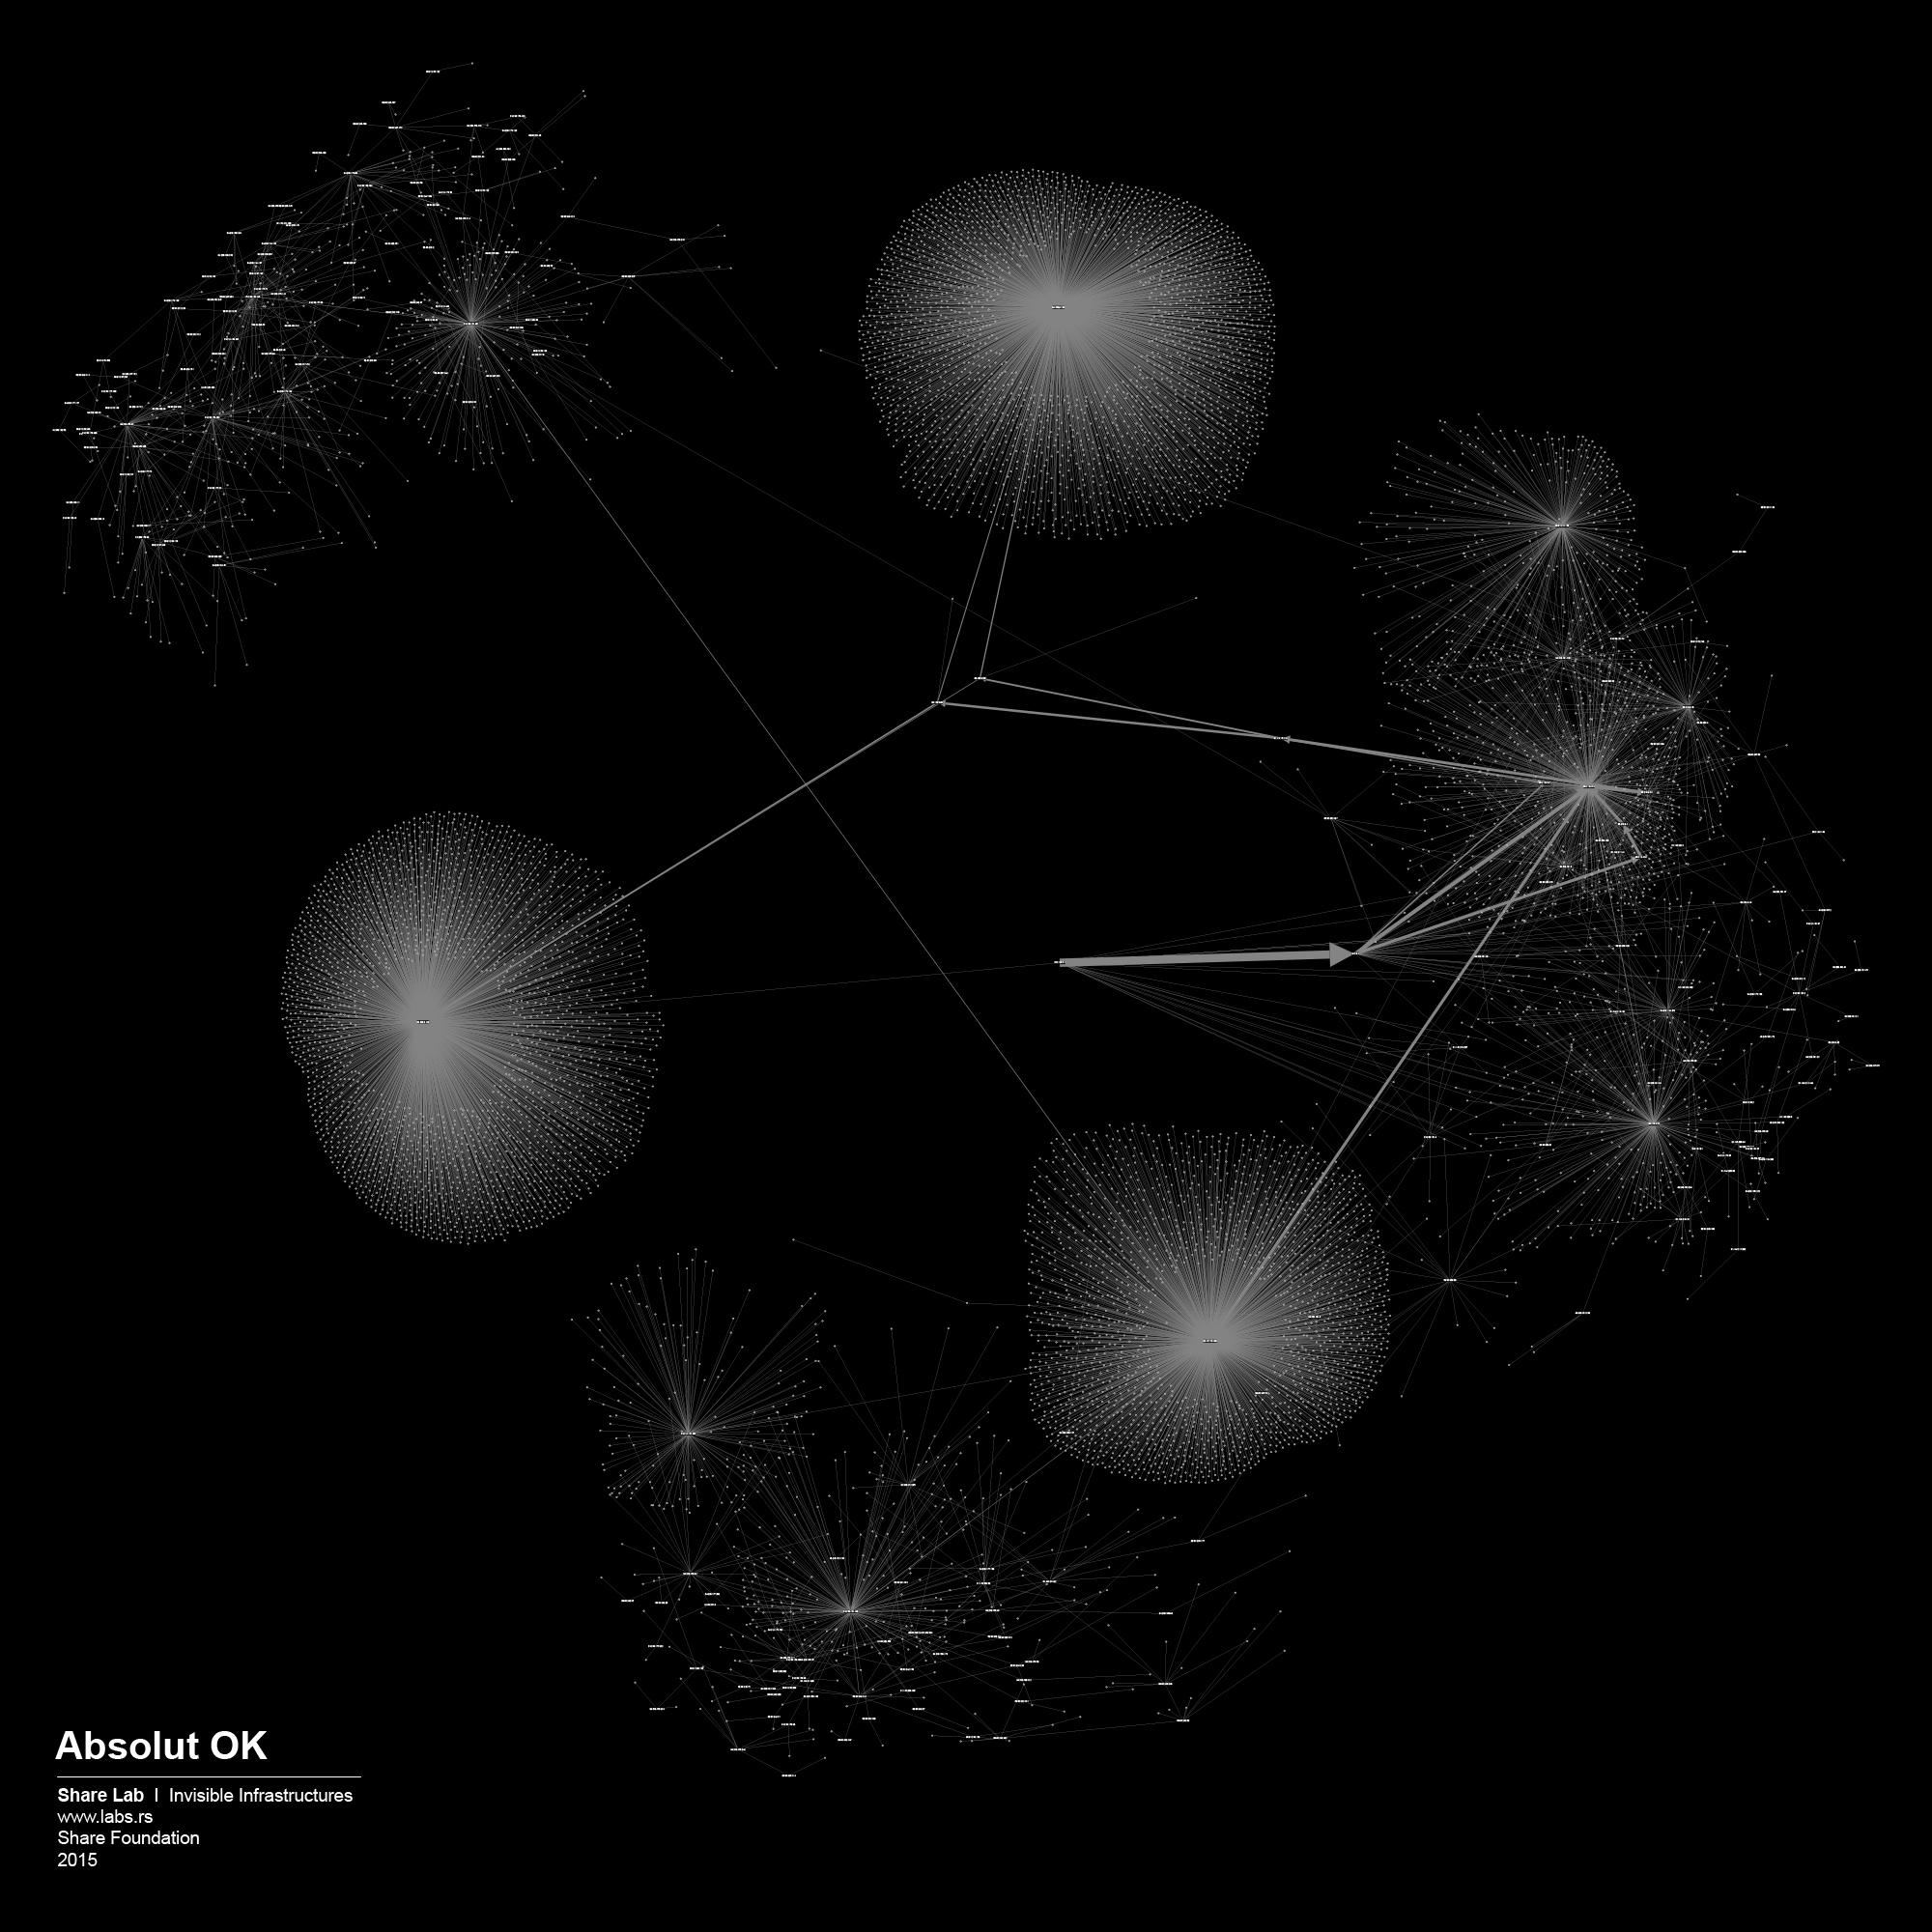
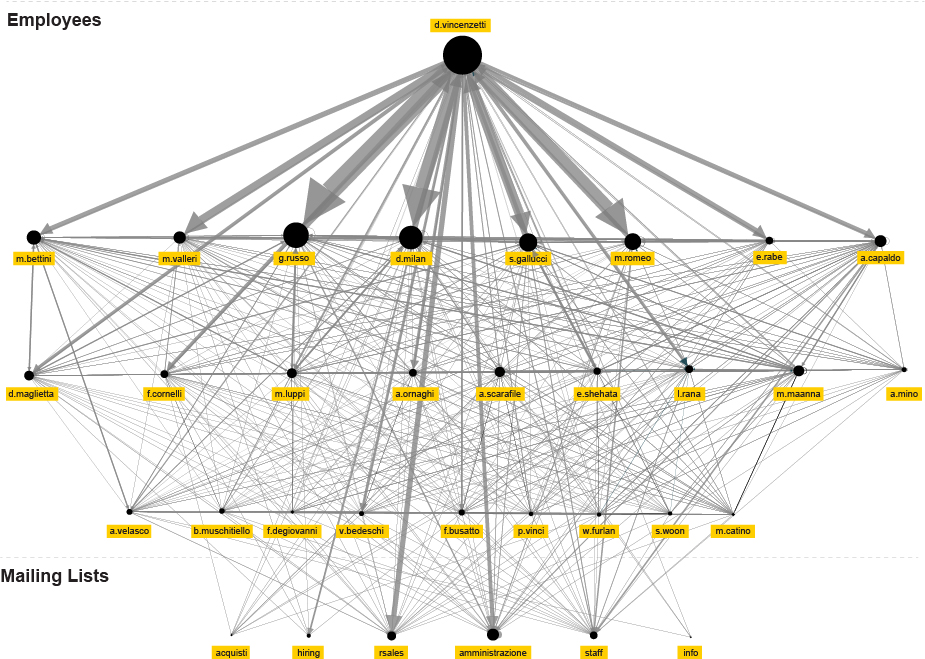
Different structures, and what we can learn from them
Network Structure analysis can be useful for different aspects of network security and efficiency of the network, but our main interests as researchers in this case are related to possible privacy related misuse of the network, digital surveillance and data retention, and different forms of Internet filtering, content control and censorship.
There is three basic network structures:
Centralized. All the devices are connected to one center. This center has privileged accessibility and thus represents the dominant element of the network.
Decentralized. Although the center is still the point of highest accessibility, the network is structured so that sub-centers also have significant levels of accessibility.
Distributed. No center has a level of accessibility that significantly differs to the others.
By analysing our visualizations of ISPs in Serbia we have noted that both centralized and decentralized models are present. The centralized model can be associated with the network of the state owned Telekom Serbia and an example of a decentralized model can be seen in the case of the University network – Amres.
But, except feeding our curiosity for deeper understanding of our technological environment and passion for visualizing big sets of data, can we have a practical use of those maps in the field of internet freedom and user privacy?
The Game of Filtering
Internet filtering (or Internet Censorship) is one of the most widespread forms of government approach to internet control. Internet freedom around the world has declined for the fourth consecutive year, with a growing number of countries introducing online censorship and monitoring practices that are simultaneously more aggressive and more sophisticated in their targeting of individual users 79 .
There are three commonly used techniques to block access to Internet sites: IP blocking, DNS tampering, and URL blocking using a proxy. These techniques are used to block access to specific Web Pages, domains, or IP addresses. When the targeted websites are outside the legal jurisdiction of the government (in a foreign country) this is the most effective way to block access to their citizens. There are more advance techniques, (blocking searches involving blacklisted terms, keywords analysis, dynamic content analyses) but they are more rare and we will discuss them in other parts of our research.
What we find most interesting, related to our ISP mapping efforts is the question: Where will internet filtering take place in our ISP network topology? According to the OpenNet Initiative study, Internet filtration can occur at any or all of the following four nodes in network:
1) INDIVIDUAL COMPUTERS
2) INSTITUTIONS Filtering the network on an institutional level using technical blocking
3) INTERNET SERVICE PROVIDERS Government-mandated filtering is most commonly implemented by Internet Service Providers (ISPs) using any one or combination of the technical filtering techniques mentioned above.
4) INTERNET BACKBONE State-directed implementation of national content filtering schemes and blocking technologies may be carried out at the backbone level, affecting Internet access throughout an entire country. This is often carried out at the international gateway.
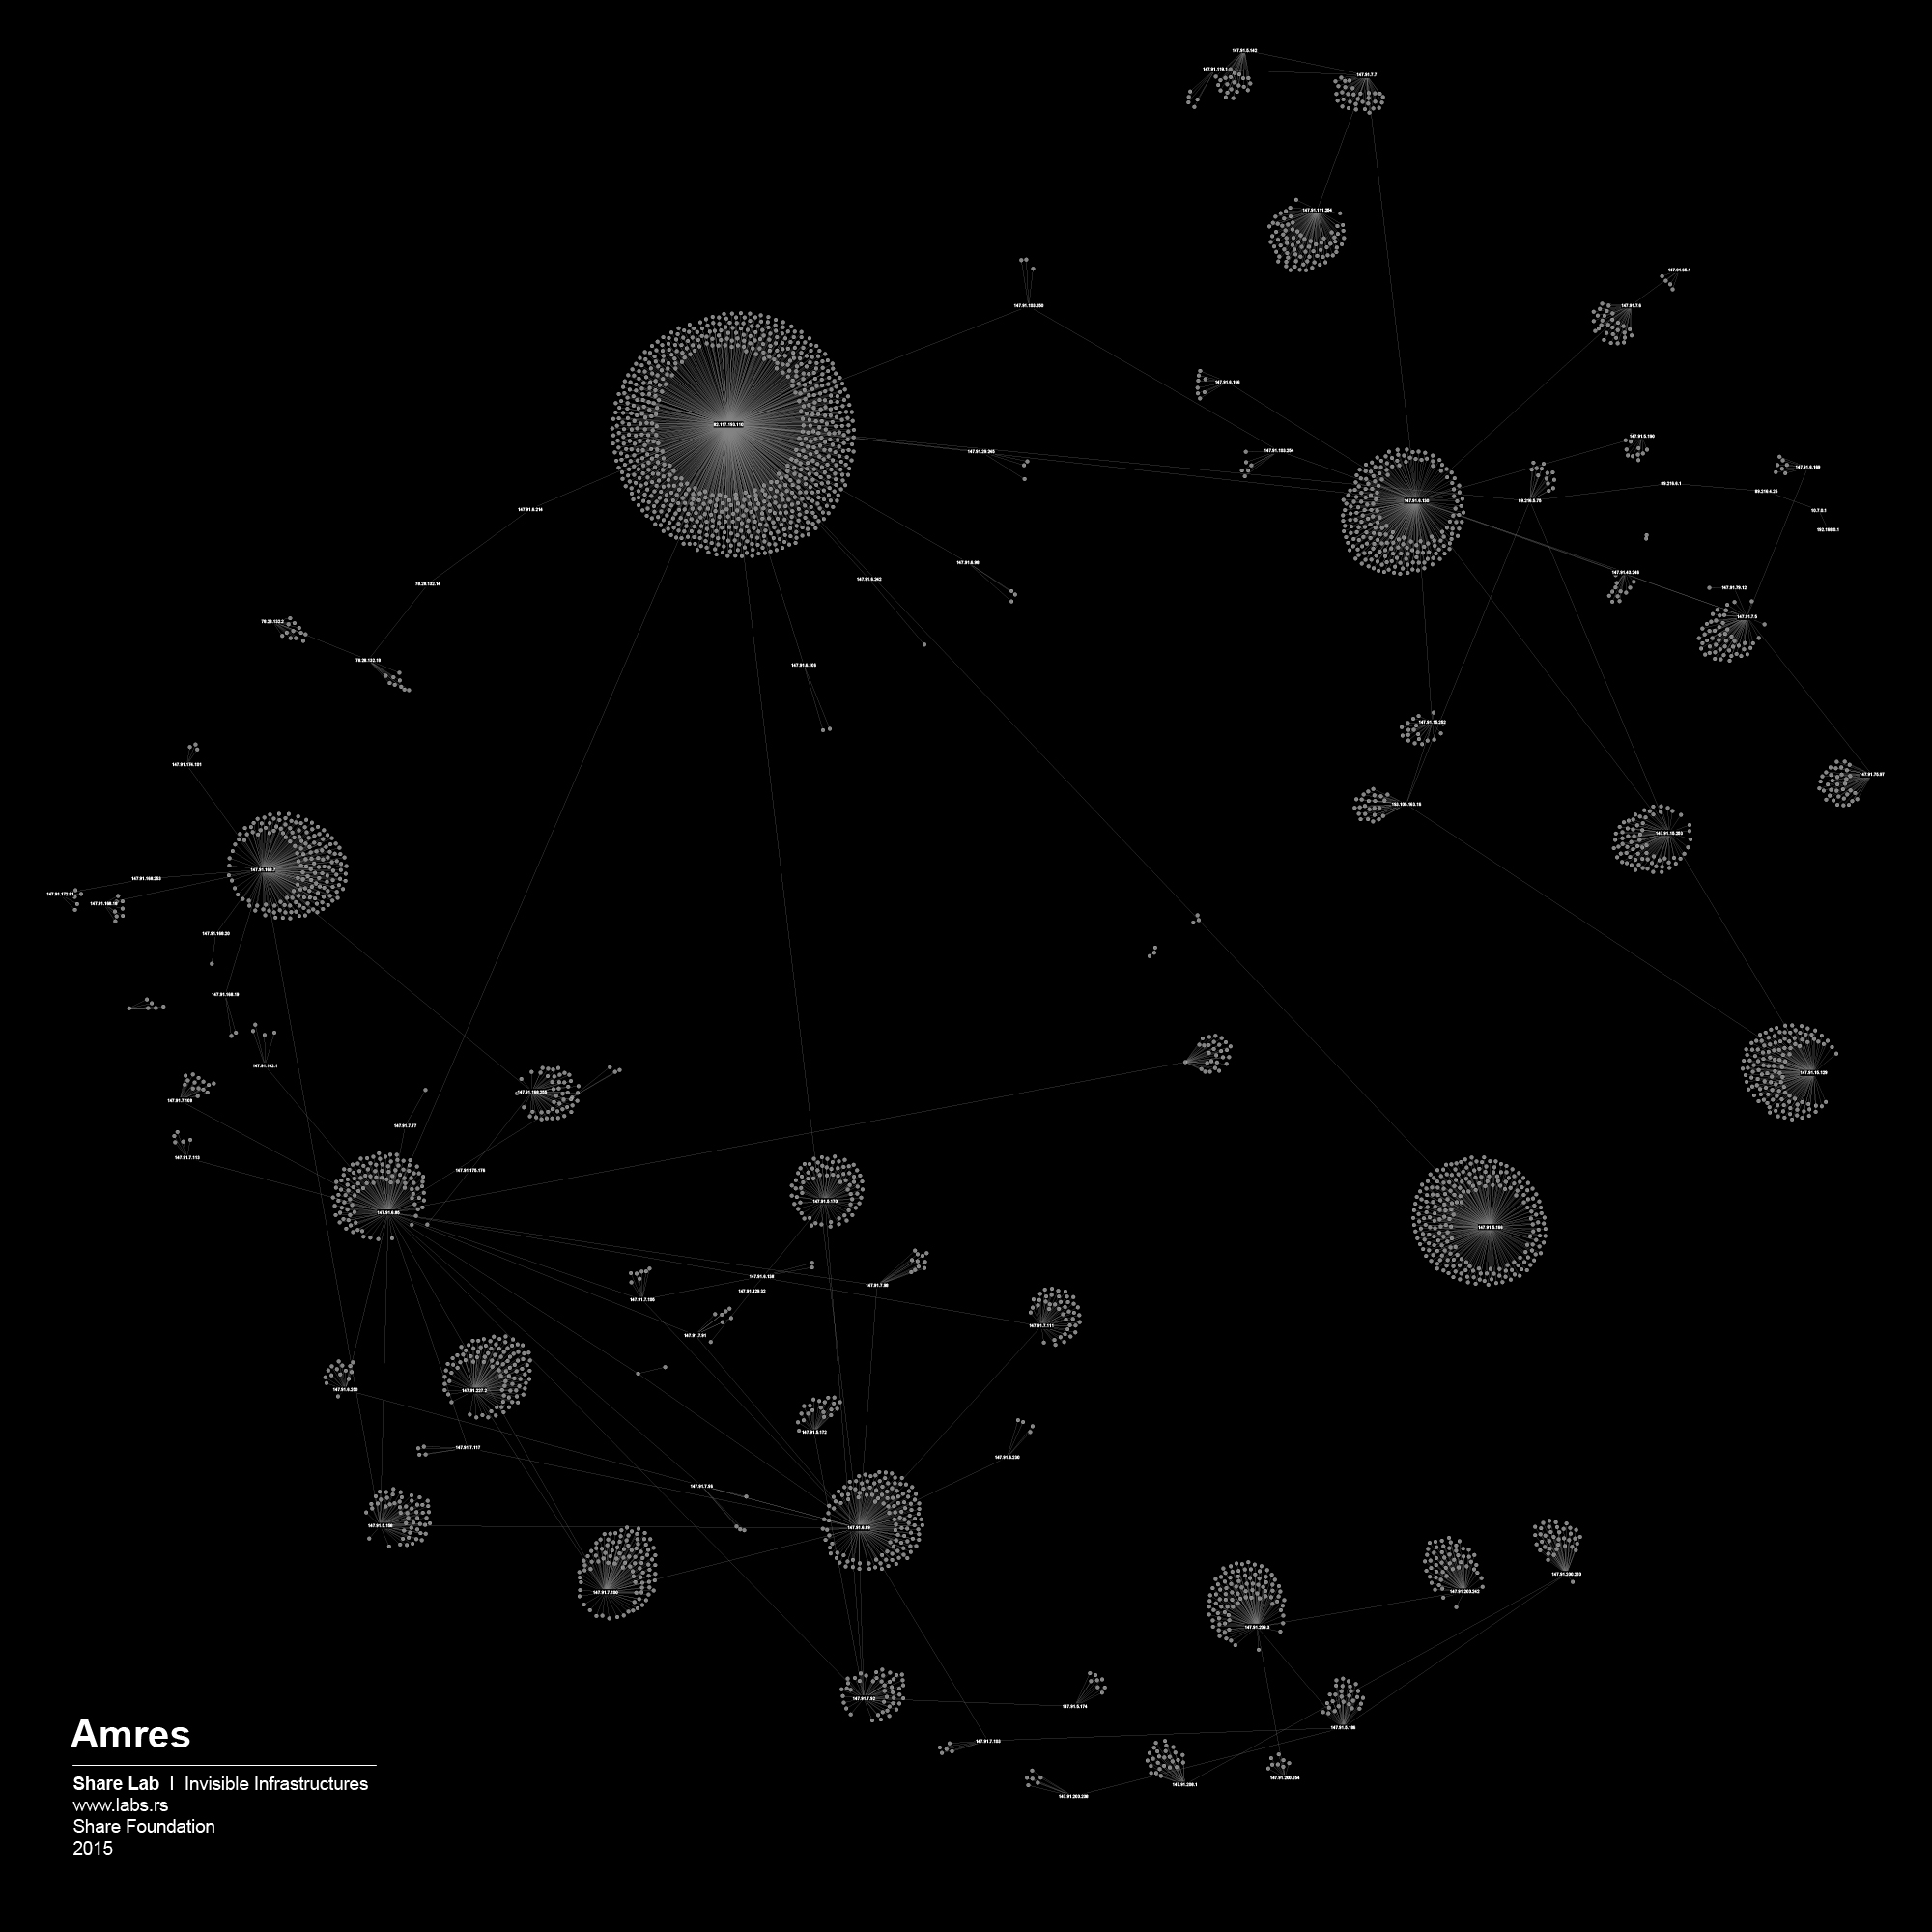
In one of our previous researches 80 related to the case of the national research and education network of Serbia – AMRES’ internet filtering practice, we discovered a decentralized method of content filtering, delegated and executed through local administrators and routers at every University in Serbia. Each local administrator is responsible for his own black list of sites and ports. The AMRES network is one of the oldest ISPs in Serbia, established in the early 1990s, and its method of Internet filtering presented here is filtering on institutional level. If we take a look at the visualization of the AMRES network, we can clearly see why this method of Internet filtering was the most applicable one – the decentralized structure of the AMRES network somehow imposes this kind of filtering strategy.
In our view, that type and complexity of a network structure and topology, ownership model & management needs, have a crucial role in defining the model of internet filtering, and the amount and type of equipment that will be used. For us, users or researchers without access to privileged information, the analysis of network topology maps can be a starting point for better understanding infrastructures of control and potential repression.
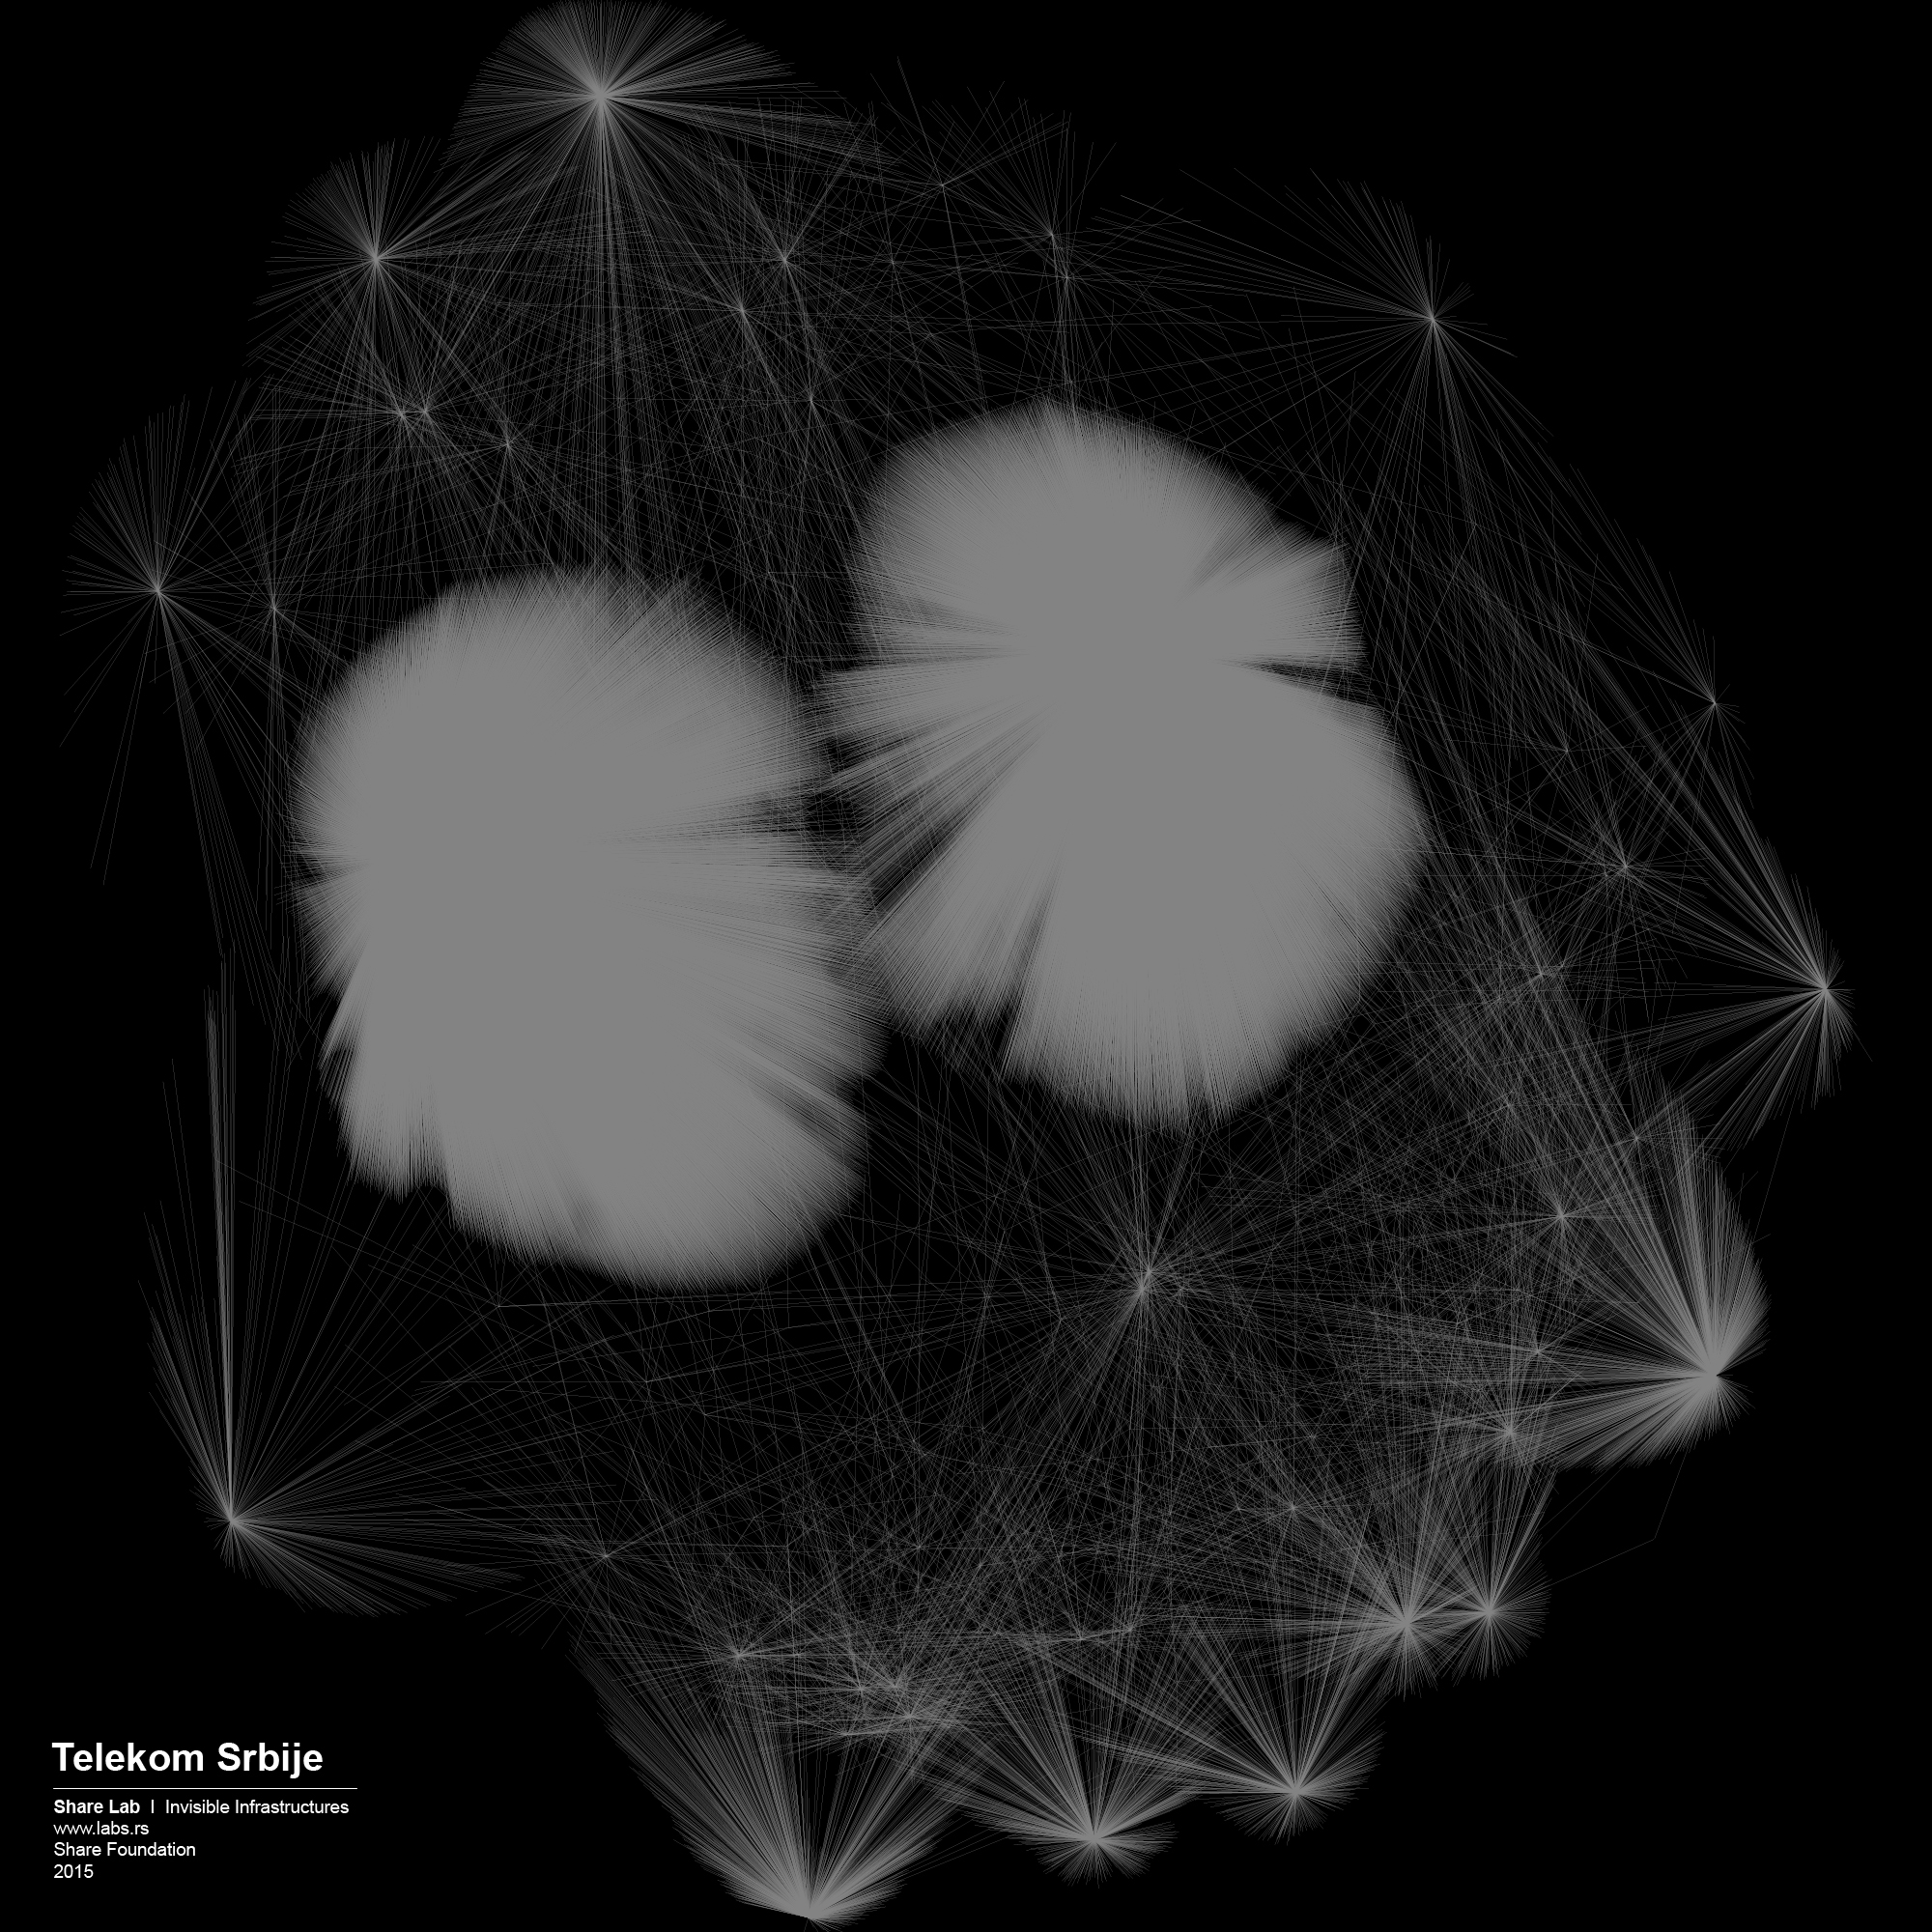
In December 2014, the Government of the Republic of Serbia sent a Proposal of the Law on Amendments to the Law on Games of Chance 81 to the Parliament. The proposed changes were adopted without a discussion and public insight, even though these provisions would introduce Internet censorship in Serbia through a “back door”. The solution that presented the main problem was the amendment 82 which prohibits “ enabling access to websites by domestic electronic communication network service operators to legal entities or individuals organizing games of chance without the approval or consent of the Administration”.
Fortunately, after SHARE Foundation analyzed the Proposal and started a media campaign, the Proposal of the Law was withdrawn from the parliamentary procedure following an intervention of the Government. In one part of the Proposal, it was written that the installation, maintenance and costs of the equipment intended for filtering is a responsibility of the ISPs. In order to create an argument regarding unreasonable costs that every ISP would have, we tried to analyze the network topology maps of every individual ISP in Serbia and try to guess how much and what kind of equipment they would need to purchase. Even though our method is not 100% accurate, we had in our hands something to work with, something that gave us an insight into the unknown and invisible design of the networks. By watching the map of Telekom Serbia’s network, the biggest ISP in Serbia and owner of the biggest share of the infrastructure, we could observe the highly centralized structure where almost all the main nodes, routers were connected to just two main servers. The logical conclusion is that in order to perform real time filtering they would need to instal equipment exactly in those two points. On the other hand, from the number of nodes attached to those two main routers, we can guess that they are able to process huge amounts of traffic, therefore the equipment that they would need to install would probably need to be of high-end performance. We were able to predict the type and cost of the theoretical filtering solution, giving that there are just a few manufacturers of such equipment.
We played the Game of Filtering on the maps of the other ISPs as well, and each of them was a story for itself. Most of them were much more decentralized and we needed more efforts to find out where filtering could potentially happen. Decentralized networks are more complex to control, they have more crossroads, more points to cover if you want to have access to all the data flows. Although, it’s hard not to see the shape of the Panopticon structure in the case of the network organisation similar to the one we saw on the case of Telekom Serbia.
Given that our analysis is still only at the level of an individual ISP, this is just a small fragment of the story. The Internet is a network of networks, and to be able to create a full picture and to understand where the points of control are, we need to examine their local interconnections and links to the International networks. This is the topic of our next analysis.

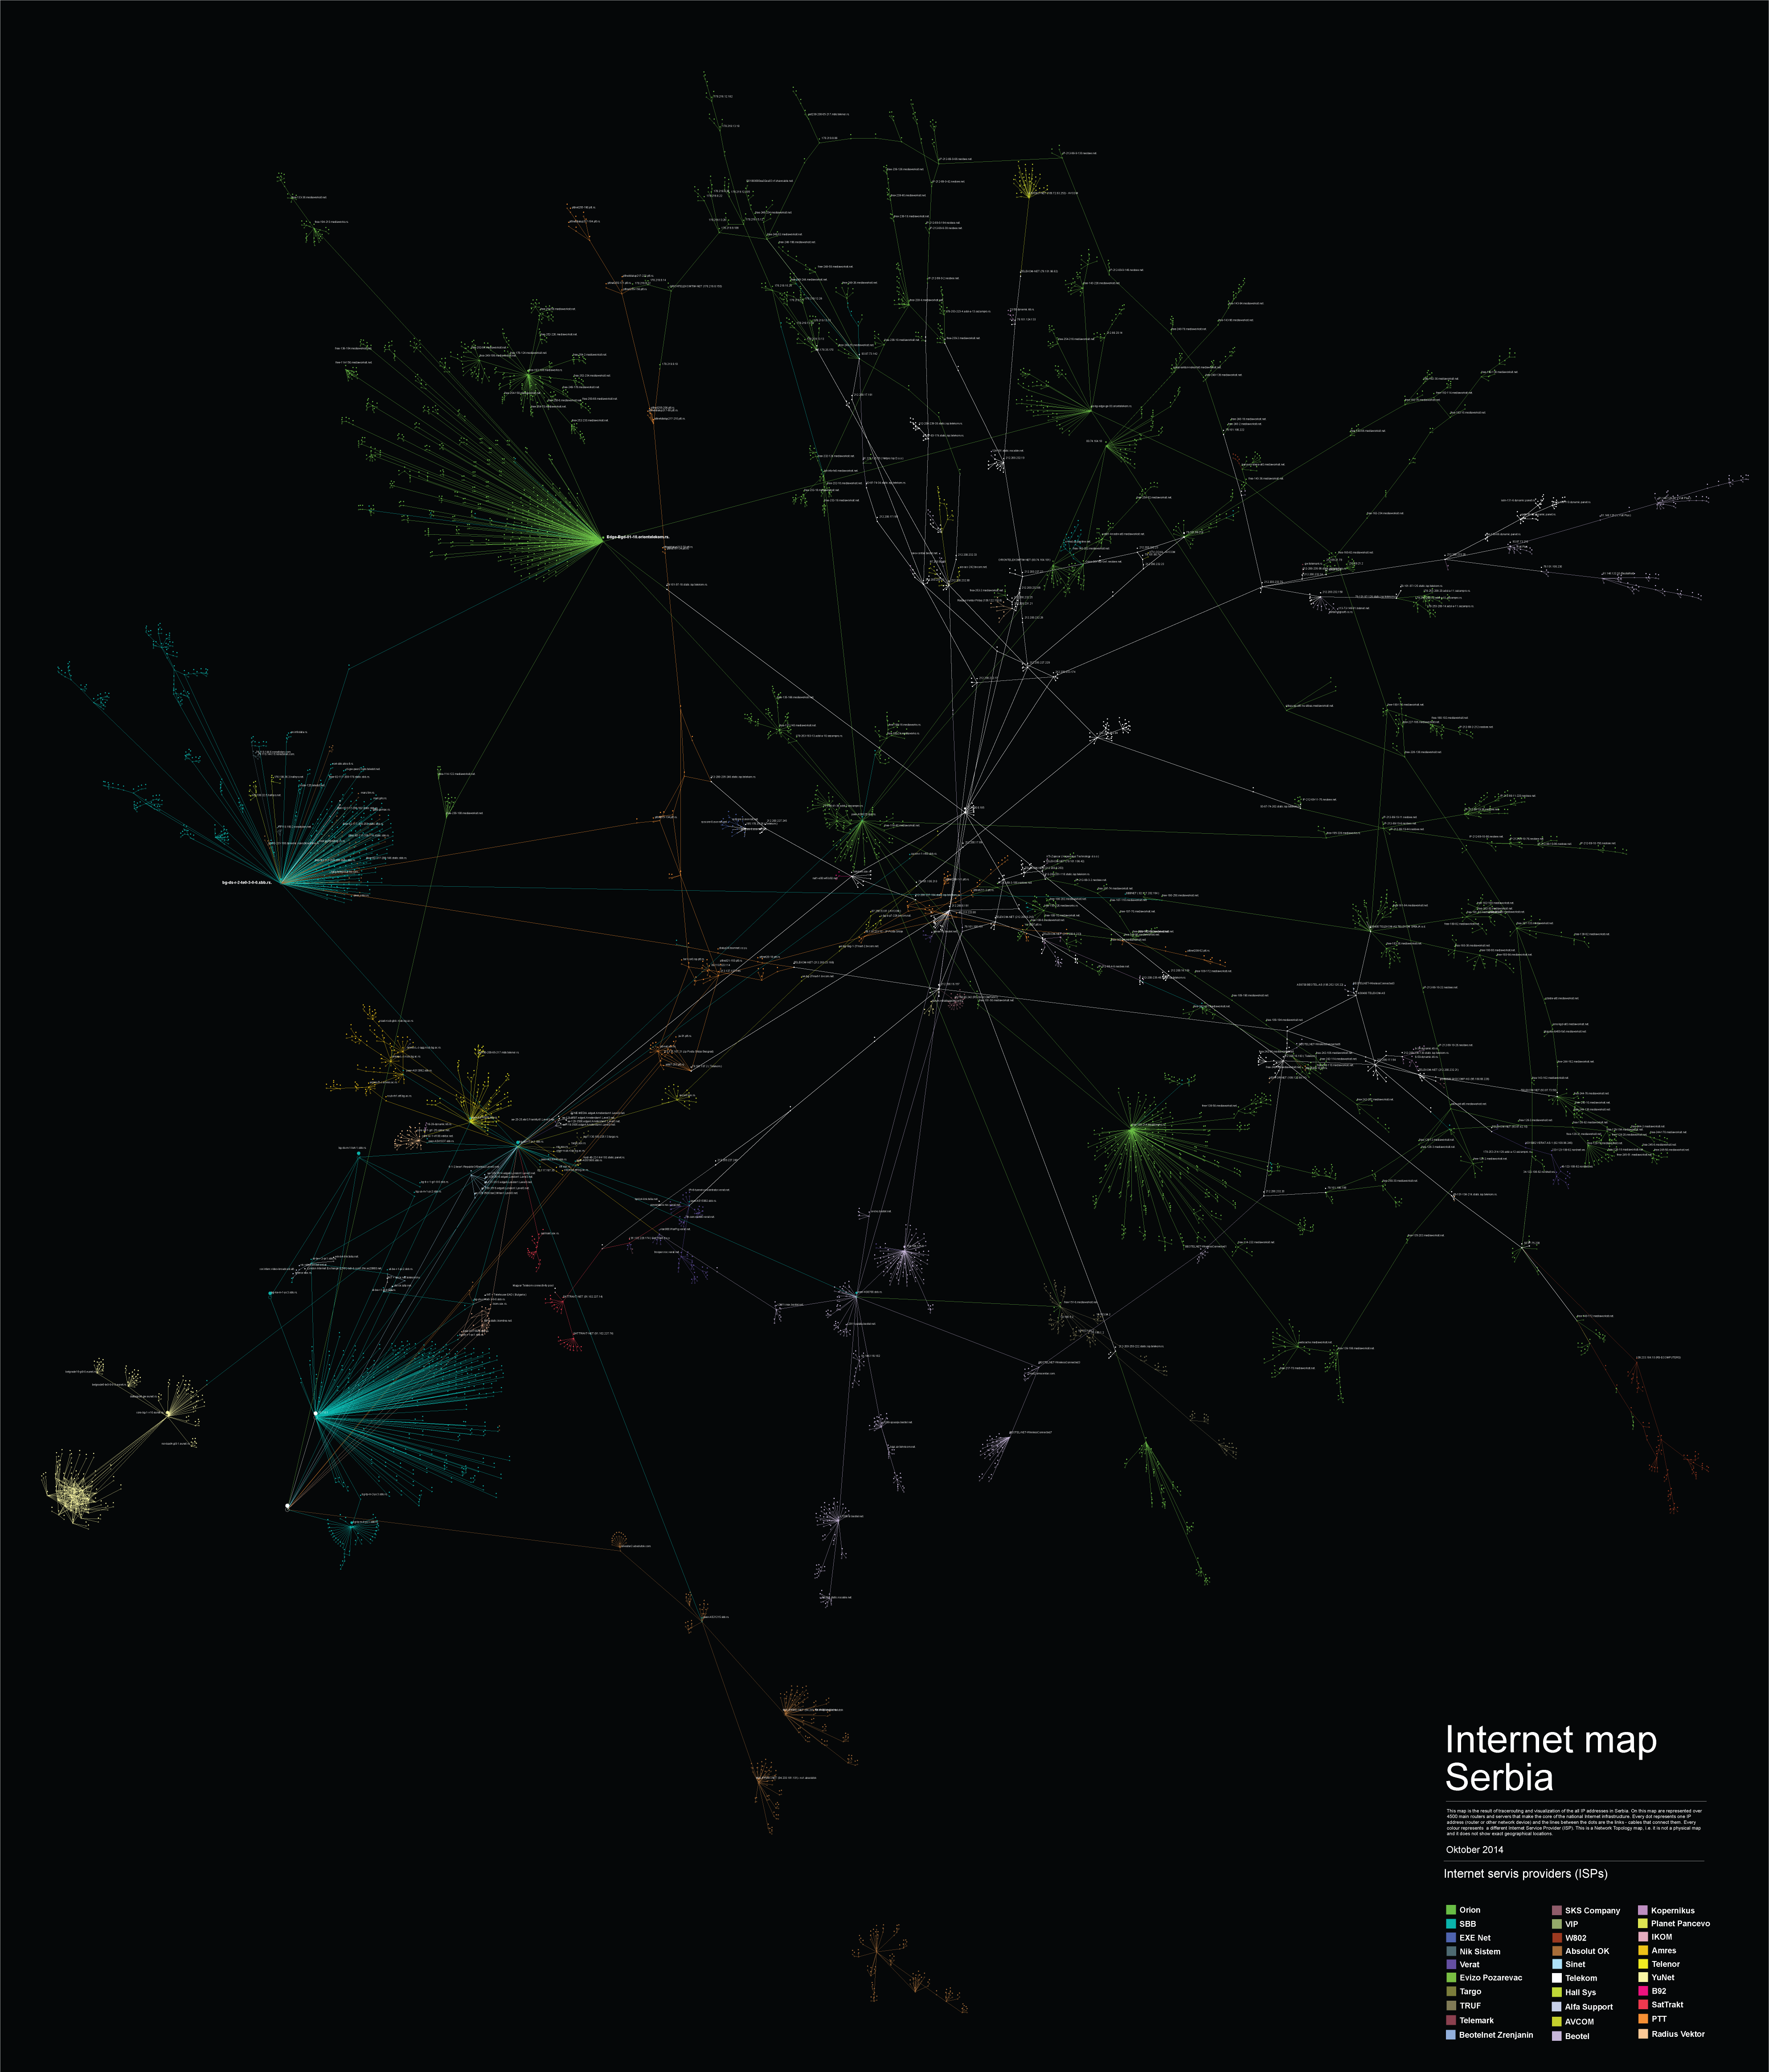
What are we looking at?
By identifying and tracerouting 300.000 IP addresses and 30 ISPs in Serbia using various open network analysis tools, we created a map representing over 4.500 main routers and servers that make the core of the national Internet infrastructure. This Network Topology map allows us to identify the main actors, companies (ISPs) that own and control the infrastructure, have a possibility to access, retain, analyze or sell user’s metadata, their interconnection points, national Internet exit points and the level of infrastructure centralization on both national as well as the level of individual ISPs.
Every dot represents one IP address (router or other network device) and the lines between the dots are the links – cables that connect them. Every colour represents a different Internet Service Provider (ISP). This is a Network Topology map, i.e. it is not a physical map and it does not show exact geographical locations.
Networks, run by different Internet Service Providers, are interconnected at physical locations where their routers are connected by cables, the points of connection are called Internet exchange points (IXP). Those are the places where different networks meet, joining different networks into a single system, allowing us to connect to other connected devices on any other network.
Interconnection is both definitive of the Internet, and a manifestation of a business relationship between two ISPs83.
Most ISPs are unlikely to have peering arrangements with all other ISPs in the world. Thus, with the exception of a small number of very large multinational network operators, most ISPs, themselves, need at least one transit provider to ensure they (and their customers) can reach the entire Internet84.
Despite the strong theoretical background, and the virtuality of the matter which was subject to this research, the output is quite concrete.
The most important conclusion is the identification of the intersections, i.e. the points where the ISPs meet. These are points of power, and the more ISPs meet at a single point the importance of that point, router, server, increases. It is important to know who manages and controls those points, because that is the entity that controls the internet in Serbia.
Anyway, the most important output of this research is that it can serve as a starting point for different multidisciplinary researches related to the internet infrastructure in Serbia. A few examples would include, measuring the internet speed in Serbia, measuring the level of bandwidth throttling, determining the routes that are used most often when accessing online content, etc.
Methodology
The research process is divided into four phases. Every phase is equally important since it provides the input data for the phase that follows. The final output of this research can also be used as an input to some other, more advanced analysis.
Determining the IP ranges
Every device that is connected to the Internet has one or more interfaces through which it communicates with other devices on the network. Each and every network interface is defined by a certain set of parameters, one of which is it’s IP address. The IP address is a logical Internet Protocol address which allows data to flow over the Internet from it’s source to the destination it was intended to reach.
Even though IP addresses are more logical rather than physical, using an IP address it is simple to determine in which country the device that uses it is located. The reason for this is that the IP addresses are assigned to users by a single authority. IANA (Internet Assigned Numbers Authority) through the RIRs (Regional Internet Registries, RIPE NCC for Europe and parts of Asia) assigns the ranges of IP addresses to the entities interested to rent them, but they keep a database as for which range is assigned to whom and other data including to which country is the certain range connected. That means that the IP addresses are also somewhat physical addresses. This information is publicly available, and there are websites online that show the IP address ranges by country along with the actual owner.
Scanning the Network
Since not all of the devices are connected directly to each other (in fact few are, i.e. even computers positioned in a single office use a router to communicate), there is the necessity of routing over the Internet. That means that if one host wants to communicate with another host on the Internet, he needs to establish a route through which they can connect. That route is in essence a set of IP addresses of different network devices that make it possible for the two hosts to communicate.
This means that in order to reach the destination address, the data hops from host to host. In order to see how two hosts are connected, the ICMP (Internet Control Message Protocol) is used. That is one of the most important protocols in the IP set of protocols. There is a simple tool, called traceroute, which is mostly used in network diagnostics. This tool makes the data hops over the Internet visible and systematic, which makes them usable by sending ICMP messages and waiting for responses from the destination hosts.
For tracerouting ranges of IP addresses there is a special tool called Nmap, which is quite user friendly, detailed and precise. Naturally, the bigger the range, the more computer resources are exploited. Basically, Nmap traceroutes the paths between the hosts on which it runs and every IP address from the range that is being scanned.
Note: The output is actually consisted of the routes that connect the source computers to all the active hosts from the range that accept ICMP messages.
Data Processing
The outputs of the scans are what we can call “raw data” in this case. They contain quite a portion of data that is not usable due to the hosts not giving any response during the scans because of different reasons, and are as such irrelevant for the Internet infrastructure at the time of scanning.
The actual usable data needs to be extracted and formatted in a proper way, so that it can be used as an input to the visualization software. First and most important it is to know what the software used for visualisation can work with. For this research it was CSV (Comma Separated Values) file, with a simple structure, i.e. 3 fields Source IP, Destination IP and Label.
The output of Nmap can be stored in a .xml file. Both of these file types are a special variant of text files, which makes the entire process of parsing data much easier. In essence, what is needed is a piece of software that will extract some text from one file, and put it in another. There is an ample of solutions available online, manly scripts. In this case a python script was used.
The script takes two arguments, the input file and the output file and what it does is, it searches the text files for a certain words (in this case trace and ipaddr) and when it comes to those predefined keywords it takes the necessary values. In the end it generates the .csv file with the required structure (in this case omitting the Label field, which is not required). The script is available here.
Note: People who prefer Perl to Python should consider this link.
Data Visualization
In order to visualize large sets of data, in our case more than 300.000 different IP addresses and the links between them, we needed to find a tool that has the ability to display, manipulate and transform the network into a map. We used Gephi, an interactive visualization and exploration platform for different kinds of networks and complex systems, dynamic and hierarchical graphs.
Our main challenge was how to represent a large number of nodes, in a most convenient way and still have a visualization useful for further research. Most of the Graph Layout Algorithms integrated into Gephi software during our tests failed to deal with large networks ( +100k nodes ) except partially OpenOrd and ForceAtlas2 algorithms.
ForceAtlas2, the algorithm that we used in the end is a Continuous Graph Layout Algorithm, a force-directed layout which is integrating different techniques such as the Barnes Hut simulation, degree-dependent repulsive force, and local and global adaptive temperatures. More about the algorithm you can find here.
In order to represent more clearly the results we chose to eliminate end-nodes and eliminate *noise*,. This reduced and cleared data set consisted of 4067 nodes, IP addresses that represent interconnected infrastructure of the main routers and servers serving the end users in Serbia.
Tools
Nmap ( http://nmap.org/ )
Python script used for XML to CSV parsing (script)
Gephi ( http://gephi.github.io/ )
All the information transmitted through the Internet, between the routers, servers and other hosts, is split into smaller chunks of data known as packets. Every packet consists of a header and content. If we need to explain this by using an analogy, we should think about those packets as a traditional paper envelope where the letter inside is the content and the stamps and the addresses written on the outside are the headers. Without an address written on the envelope, the letter will never reach the intended destination. Similar to a post office, the ISP’s router examines the destination address of each packet and determines where to send it. As we said, those “addresses written on the envelope” are called headers and they are one type of metadata.
On a sunny morning at 7:45:03, one Internet packet is born. 60 bytes weight, with just one simple mission in life – to get to the place called 173.252.120.6. Even though this does not sound like an exciting mission in life, things that happen in the next 1 second are pretty exciting. His journey starts with a fast 7ms jump, 5 meters away to the box called home router. Over the attic, where he passes through the switch where all the cables from the building meet, he jumps down to the street and into the underground cable that brings him to the main city router in Novi Sad. With a speed of 30.600.000 km/h he runs for 10 ms to Belgrade, to the SBB TelePark building.
 89.216.8.141 SBB TelePark, Belgrade, RS (Photo: Google StreetView)
He jumps around a few routers inside of the building and then leaves the country, travels for 0,05s through the tunnel in the direction of Frankfurt, Germany. Frankfurt is a really popular destination nowadays for young Internet Packets born in Serbia. Almost 50% of them at some point of their really short life, pass through the DeCIX, the biggest Internet Exchange Point (IXP) in the world85 with an average 2523 Gigabits of traffic per second86. This is the place where more than 600 ISPs from more than 60 countries meet and connect, something like airports for the Internet.
In his long distance journey our internet packet will jump from one “crossroad” of the Internet to another, passing different countries, invisible borders and visiting big, gray, dehumanized buildings in the suburbs of the cities. The European IXP scene today consists of some 150 IXPs and represents an impressive spectrum of players, ranging from the largest IXPs worldwide87 to up-and coming IXPs and critical regional players88 all the way to small local IXPs that can be found all across Europe89.
 80.81.194.40 – Equinix, Lärchenstr. 110, 65933 Frankfurt – DE-CIX premium enabled site (Photo: Google StreetView)
 80.81.194.40 – Equinix, I.T.E.N.O.S. KPN, Level3, Telehouse , Kleyerstrasse 79-90, Frankfurt. – DE-CIX (Photo: Google StreetView)
After the visit to the biggest internet exchange point in the world our packet is off to Dublin, Ireland, passing through the TelecityGroup carrier – neutral data center specialized for bandwidth intensive applications, content and information hosting.
 31.13.30.211 TelecityGroup, Dublin, IR (Photo: Google StreetView)
Some destinations on the path of our Internet packet are hidden for us, numerous repeaters, network equipment and intermediate routers on the way do not reveal their existence on our tracerouting results. Most of this invisible equipment on the way is there to make this travel possible, keeping the speed of packets constant or just connecting two cables, but some of the equipment on the way are hidden from us for other reasons. In the 1970s, Skewjack farm in west Cornwall, England, at the coast of the Atlantic ocean was known as a cult place for sea-surfing enthusiasts – the Skewjack Surf Village. Unfortunately, the surf village was closed in 1986 and this place became known for another kind of surfing, web surfing, or to be more precise – an extended form of web surfing voyeurism and hoarding. This farm is situated just a few kilometers from one really important place for the Internet, Widemouth Bay south of Bude, landing spot for some of the biggest and most crowded transatlantic optic cables, connecting Europe and US, one of the backbones of today’s Internet. Before the Internet packet dives deep beneath the ocean, he will most likely jump to the bunker-like building at the Skewjack farm.

 Skewjack, UK (Photo: Google Maps)
It was revealed in 2014 that this farm was the location of the Government Communications Headquarters interception point that copies data to GCHQ Bude, an even more visually exciting farm, populated with tens of huge satellite dishes that serve as a satellite ground station and eavesdropping centre. There is an estimation that 25% of all internet traffic travels through this point90.

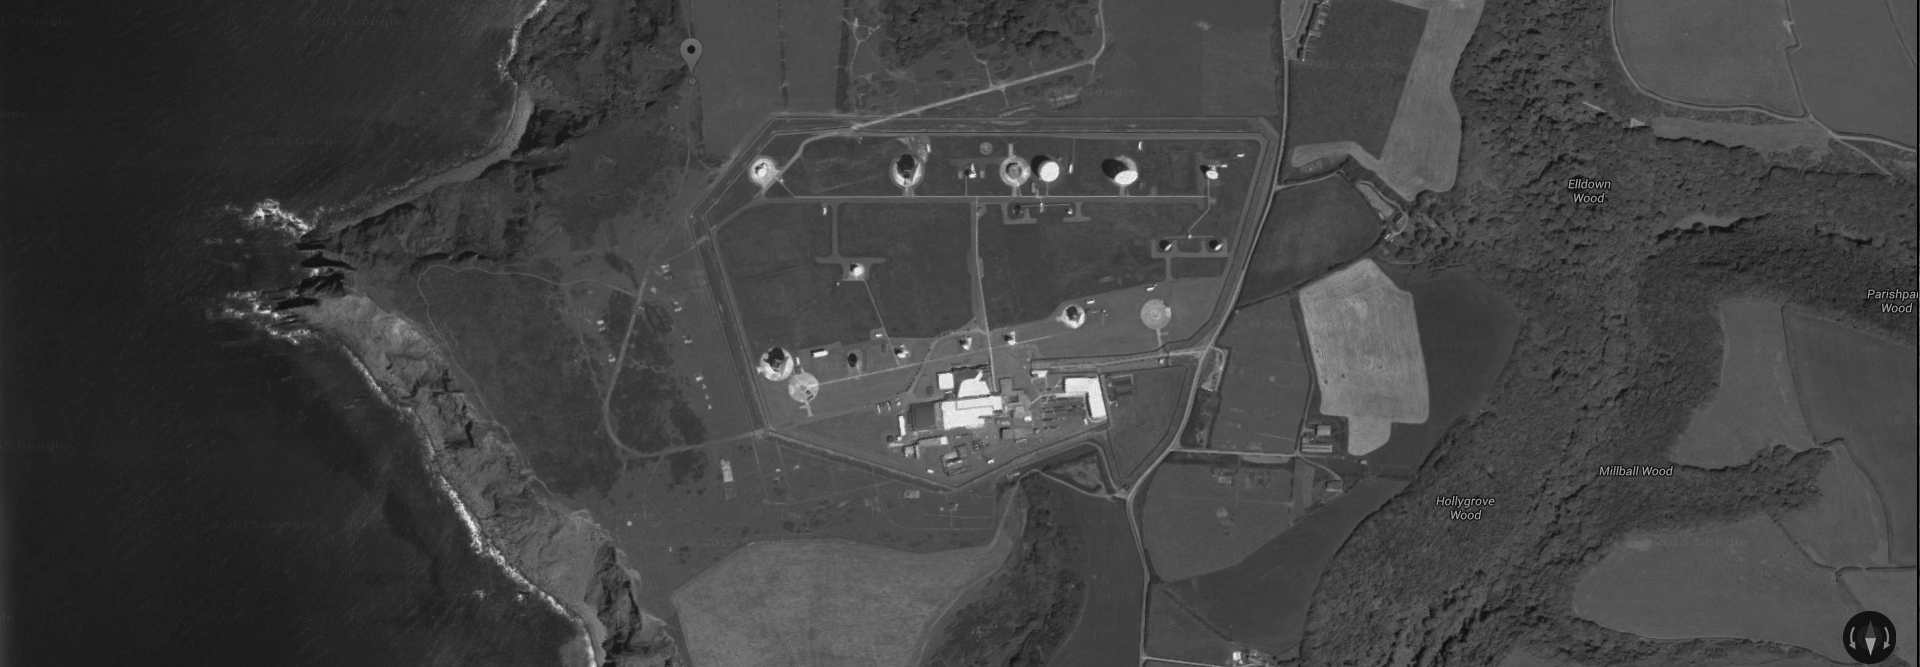
GCHQ Bude, England (Photo: Google Maps)
After a quick detour, our packet goes into a transatlantic cable landing site 10 km away at the Widemouth Bay, near a small coastal city of Bude, a place with one of the biggest concentration of transatlantic optic cable landing sites in the World.
Before 1866, information traveled from one side of the Atlantic to another only by ship, and this sometimes took weeks. The first attempt in 1858 of laying a 2,000-mile copper cable along the ocean bottom was successful but was operational for only three weeks, when it was destroyed after having experienced many technical difficulties91. It took nine years and five attempts to succeed in building the transatlantic telegraph cable “The Eighth World Wonder”, technology that will rapidly transform communication between continents and create the first worldwide communication network.

Cable Station, Valentia Island Ireland (Photo: Google StreetView)
The 1866 trans atlantic telegraph cable, laid down between Valentia Island in Ireland and Heart’s Content in Newfoundland US, could transfer 8 words a minute, and initially costed $10092 to send 10 words93 . In 1900, the shape, topology of the telegraph network94 looked very similar to the submarine telecommunication optic that we have today95 . The main landing points of this network, made of thousands of kilometers of optic cables, are shaped by geographical conditions as well as political and economical power – the power to access, transfer and store informations, to participate in the data and metadata exploitation industry and surveillance-industrial complex.
It’s hard not to be seduced with the magic of those tiny streams of data traveling with a speed of light on the ocean floor. Different data streams are separated in different frequency of light, allowing enormous amounts of data to be transferred, traveling with speed of, in case of our packet, 50.000.000 m/s96 . In the past 150 years, speed of transatlantic communication jumped from the metric of weeks to the fraction of a second, far beyond human perception, making the process of information transfer abstract and invisible. Still, for the high frequency trading algorithms, responsible for a half of the European Union and United States stock trades, every millisecond lost in transfer of data plays a crucial role, pushing for faster and more sophisticated solutions in data transfers.

Tuckerton NJ, TAT 14 Landing point (Photo: Google Map)
There are a couple of main spots for cable landing on the other side of the ocean. They are mostly situated on the east side of Long Island (Brookhaven), Manasquan and Tuckerton in New Jersey, an hour and a half drive south from New York city. Our Internet packet is now heading south, towards another Internet capital – Ashburn, Virginia, 50 km northwest of Washington, D.C.
At first, the Internet backbone was maintained by the US government, runned by the National Science Foundation and was used by the academic or educational communities and institutions. Their supercomputing initiative, launched in 1984, was designed to make high performance computers accessible to researchers around the US97 and in 1986 this 56 kbit/s backbone was connecting scientific centers across US. But this backbone was prohibited for growing number of commercial ISPs by the NSFNET Acceptable Use Policy98. In the beginning of the 90s commercial ISPs needed to find a way to make a physical connection between themselves in order to exchange traffic over their private infrastructure, avoiding government owned backbone. They came up with a common, neutral physical locations where they would connect their networks, some kind of a informational highways’ roundabout. One of the first such locations was Ashburn, suburb of Washington, D.C, populated with numerous technology startups, military and government contractors. MAE (Metropolitan Area Exchange) created in 1992, fast became one of the biggest crossroads in the Internet history, with most of the world’s Internet traffic passing through it at some point, creating a sort of an Internet black hole. The 5th floor of a building on Tysons Corner became a bottleneck of the Internet.
The opening of the network access points also marked an important philosophical shift, one that would have ramifications for its physical structure. In a clear departure from its original roots, the Internet was no longer structured as a mesh, but rather entirely depended on a handful of centers99.
Even though it is no longer as influential as it was in the beginning of 90s, Ashburn is still one of the Internet capitals, home of a large number of data centers, a strategic communications hub for the eastern United States, a major communications gateway to Europe and the largest Internet peering point in North America.
 Equinix, 44470 Chilum Place, Ashburn, VA
After a visit to the former Internet capital, our Internet packet heads 700 km southwest, to his final destination – Forest City in North Carolina. Forest City – a home to 7,500 residents and hundreds of millions of user profiles. Physical manifestation of Facebook. The world’s biggest database of personal informations, private and public photos, intimate chats, thoughts and emotions packed into two massive 28.000 square meters facilities filled with hard drives, routers, wires and cooling systems.
 31.13.29.232 Facebook Data Center, Forest City, North Carolina, US (Photo: Google StreetView)
Only 80 full-time employees working three shifts are needed to run these gigantic gray buildings. Thanks to the automation systems100, one technician can take care of about 25,000 servers that work in complete dark, lights turning on only when sensors detect movement. Not far from this place there are other big facilities, created with the same goal, similar in size but operated by Google (in Lenoir) and Apple (in Maiden).
 Google data center, Lenoir, North Carolina, US (Photo: Google StreetView)
Those are the locations where your data actually exists. Data centers are monopolies of collective data, accumulation of information about information101.Those are the locations where metadata society accumulates wealth, consisted of vast amounts of information, created by us and analyzed by them.
This is the end point of the exciting 1-second-long life and journey of our Internet packet. In only one second, he traveled over 9000 km and crossed numerous borders, being transferred from one ISP to another, operating under different legal frameworks and commercial interests, jumping from one Internet crossroad to another and leaving a trace of his existence at every point of his path. The life mission of this packet was simple, he was created to send information to facebook.com that a user, somewhere in Serbia typed www.facebook.com in his browser. Once at his fated destination he will trigger birth and send out on a journey a certain amount of new packets, filled with informations that will travel in the opposite direction, from the Facebook data center to the user’s computer, resulting in a Facebook page being shown on his screen in a blink of a second.

Ghosts and the afterlife of Data
At his final destination our packet will be stored, buried to rest in a dark, cold room of the data center among other billions of packets, waiting to eventually have an afterlife, to be a subject of algorithmic analysis. But this is not the only place where he will be stored. On his journey, at numerous points he was cloned and stored in other data centers, ISPs’ data retention servers in different countries by different government agencies or commercial companies. He will eventually be used in different ways, as a piece of the big puzzle presenting your behavior, preferences and interests or as a little piece that will differ you from or mark you as a potential terrorist in the eye of the algorithm. On the other side, our little Internet packet will contribute to the fast growing industry of personal data collection, analysis and trade. The estimated value of EU citizens’ data was €315bn in 2011 and has the potential to grow to nearly €1tn annually by 2020102.
]]>