What are we looking at?
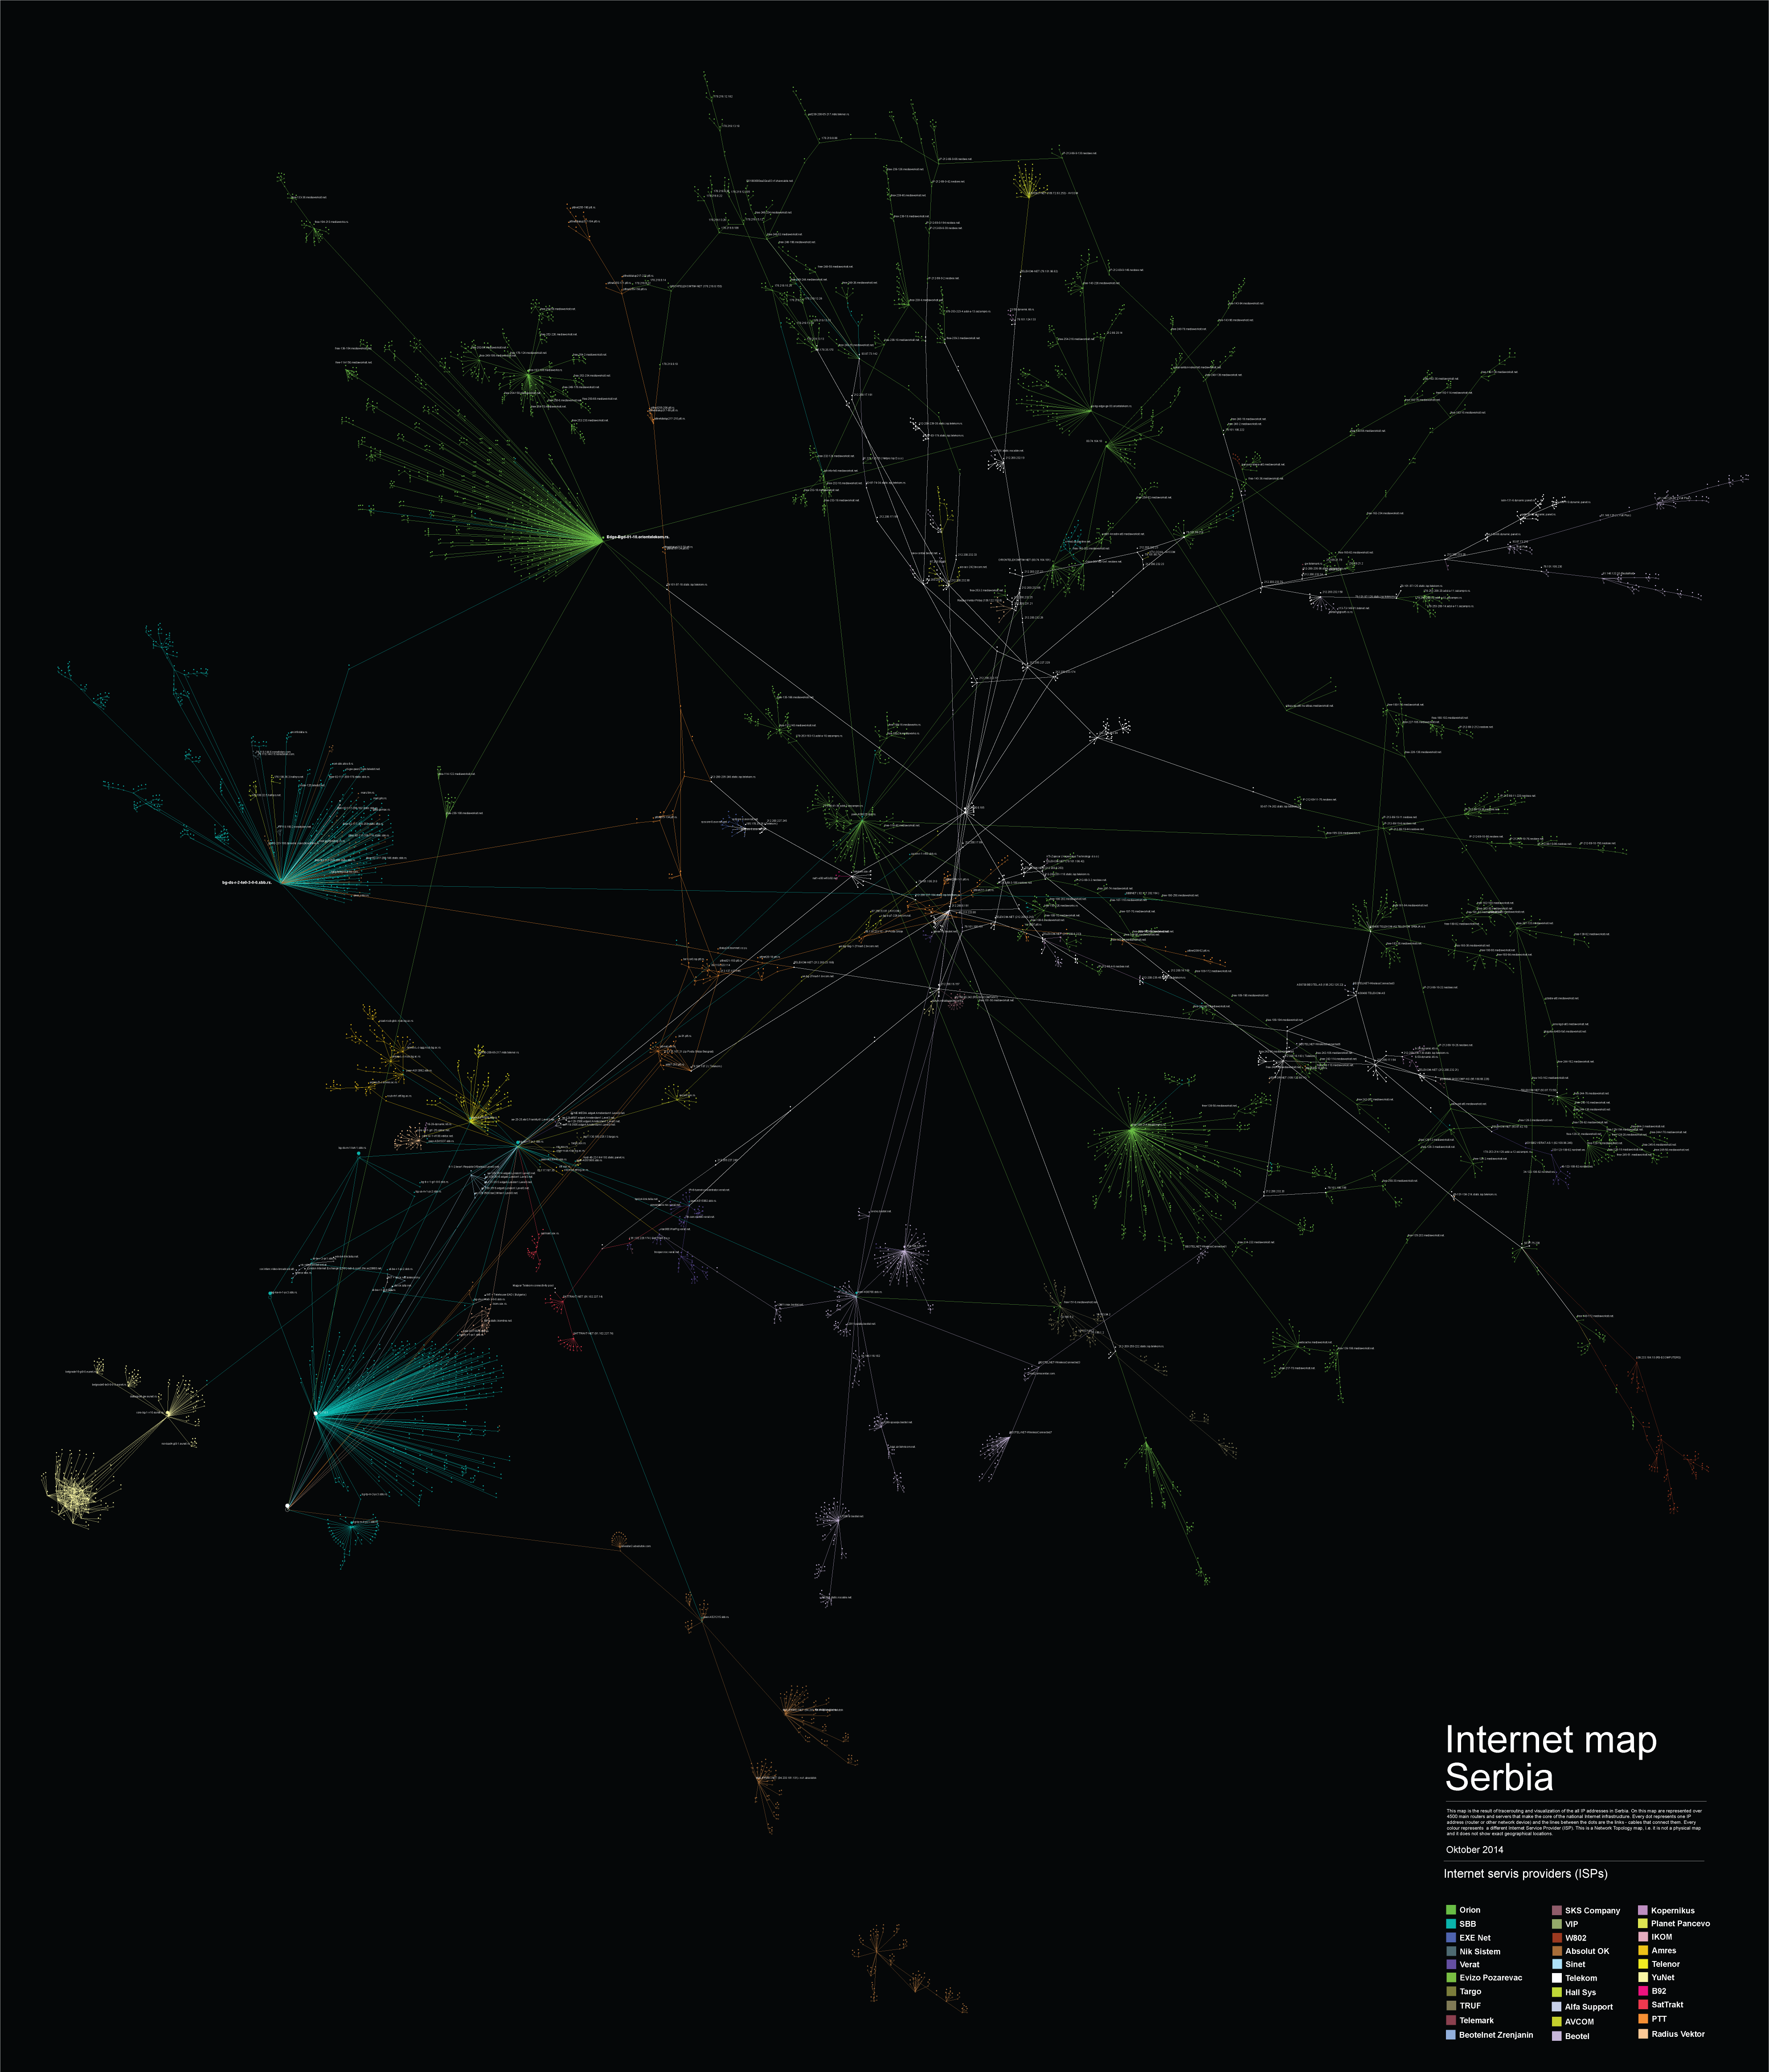
By identifying and tracerouting 300.000 IP addresses and 30 ISPs in Serbia using various open network analysis tools, we created a map representing over 4.500 main routers and servers that make the core of the national Internet infrastructure. This Network Topology map allows us to identify the main actors, companies (ISPs) that own and control the infrastructure, have a possibility to access, retain, analyze or sell user’s metadata, their interconnection points, national Internet exit points and the level of infrastructure centralization on both national as well as the level of individual ISPs.
Every dot represents one IP address (router or other network device) and the lines between the dots are the links – cables that connect them. Every colour represents a different Internet Service Provider (ISP). This is a Network Topology map, i.e. it is not a physical map and it does not show exact geographical locations.
Networks, run by different Internet Service Providers, are interconnected at physical locations where their routers are connected by cables, the points of connection are called Internet exchange points (IXP). Those are the places where different networks meet, joining different networks into a single system, allowing us to connect to other connected devices on any other network.
Interconnection is both definitive of the Internet, and a manifestation of a business relationship between two ISPs1.
Most ISPs are unlikely to have peering arrangements with all other ISPs in the world. Thus, with the exception of a small number of very large multinational network operators, most ISPs, themselves, need at least one transit provider to ensure they (and their customers) can reach the entire Internet2.
Despite the strong theoretical background, and the virtuality of the matter which was subject to this research, the output is quite concrete.
The most important conclusion is the identification of the intersections, i.e. the points where the ISPs meet. These are points of power, and the more ISPs meet at a single point the importance of that point, router, server, increases. It is important to know who manages and controls those points, because that is the entity that controls the internet in Serbia.
Anyway, the most important output of this research is that it can serve as a starting point for different multidisciplinary researches related to the internet infrastructure in Serbia. A few examples would include, measuring the internet speed in Serbia, measuring the level of bandwidth throttling, determining the routes that are used most often when accessing online content, etc.
Methodology
The research process is divided into four phases. Every phase is equally important since it provides the input data for the phase that follows. The final output of this research can also be used as an input to some other, more advanced analysis.
Determining the IP ranges
Every device that is connected to the Internet has one or more interfaces through which it communicates with other devices on the network. Each and every network interface is defined by a certain set of parameters, one of which is it’s IP address. The IP address is a logical Internet Protocol address which allows data to flow over the Internet from it’s source to the destination it was intended to reach.
Even though IP addresses are more logical rather than physical, using an IP address it is simple to determine in which country the device that uses it is located. The reason for this is that the IP addresses are assigned to users by a single authority. IANA (Internet Assigned Numbers Authority) through the RIRs (Regional Internet Registries, RIPE NCC for Europe and parts of Asia) assigns the ranges of IP addresses to the entities interested to rent them, but they keep a database as for which range is assigned to whom and other data including to which country is the certain range connected. That means that the IP addresses are also somewhat physical addresses. This information is publicly available, and there are websites online that show the IP address ranges by country along with the actual owner.
Scanning the Network
Since not all of the devices are connected directly to each other (in fact few are, i.e. even computers positioned in a single office use a router to communicate), there is the necessity of routing over the Internet. That means that if one host wants to communicate with another host on the Internet, he needs to establish a route through which they can connect. That route is in essence a set of IP addresses of different network devices that make it possible for the two hosts to communicate.
This means that in order to reach the destination address, the data hops from host to host. In order to see how two hosts are connected, the ICMP (Internet Control Message Protocol) is used. That is one of the most important protocols in the IP set of protocols. There is a simple tool, called traceroute, which is mostly used in network diagnostics. This tool makes the data hops over the Internet visible and systematic, which makes them usable by sending ICMP messages and waiting for responses from the destination hosts.
For tracerouting ranges of IP addresses there is a special tool called Nmap, which is quite user friendly, detailed and precise. Naturally, the bigger the range, the more computer resources are exploited. Basically, Nmap traceroutes the paths between the hosts on which it runs and every IP address from the range that is being scanned.
Note: The output is actually consisted of the routes that connect the source computers to all the active hosts from the range that accept ICMP messages.
Data Processing
The outputs of the scans are what we can call “raw data” in this case. They contain quite a portion of data that is not usable due to the hosts not giving any response during the scans because of different reasons, and are as such irrelevant for the Internet infrastructure at the time of scanning.
The actual usable data needs to be extracted and formatted in a proper way, so that it can be used as an input to the visualization software. First and most important it is to know what the software used for visualisation can work with. For this research it was CSV (Comma Separated Values) file, with a simple structure, i.e. 3 fields Source IP, Destination IP and Label.
The output of Nmap can be stored in a .xml file. Both of these file types are a special variant of text files, which makes the entire process of parsing data much easier. In essence, what is needed is a piece of software that will extract some text from one file, and put it in another. There is an ample of solutions available online, manly scripts. In this case a python script was used.
The script takes two arguments, the input file and the output file and what it does is, it searches the text files for a certain words (in this case trace and ipaddr) and when it comes to those predefined keywords it takes the necessary values. In the end it generates the .csv file with the required structure (in this case omitting the Label field, which is not required). The script is available here.
Note: People who prefer Perl to Python should consider this link.
Data Visualization
In order to visualize large sets of data, in our case more than 300.000 different IP addresses and the links between them, we needed to find a tool that has the ability to display, manipulate and transform the network into a map. We used Gephi, an interactive visualization and exploration platform for different kinds of networks and complex systems, dynamic and hierarchical graphs.
Our main challenge was how to represent a large number of nodes, in a most convenient way and still have a visualization useful for further research. Most of the Graph Layout Algorithms integrated into Gephi software during our tests failed to deal with large networks ( +100k nodes ) except partially OpenOrd and ForceAtlas2 algorithms.
ForceAtlas2, the algorithm that we used in the end is a Continuous Graph Layout Algorithm, a force-directed layout which is integrating different techniques such as the Barnes Hut simulation, degree-dependent repulsive force, and local and global adaptive temperatures. More about the algorithm you can find here.
In order to represent more clearly the results we chose to eliminate end-nodes and eliminate *noise*,. This reduced and cleared data set consisted of 4067 nodes, IP addresses that represent interconnected infrastructure of the main routers and servers serving the end users in Serbia.
Tools
Nmap ( http://nmap.org/ )
Python script used for XML to CSV parsing (script)
Gephi ( http://gephi.github.io/ )