
The room in which Mr. J woke up was situated in a unique 103-metre tall building called People’s Park Complex, the first shopping centre of its kind in Southeast Asia that has set the pattern for later retail developments in Singapore. That Friday morning, the view from the 22nd floor of this soc-extravagant building was gorgeous.

The weather was clear, hot and humid1, usual for April, so the fact that the water in the shower was not hot enough did not bother Mr. J too much. Who needs hot showers in the tropical climate of Singapore, anyway?

This place was the home base for Mr. J’s quest during his last couple of days in Singapore, where he flew in from Hong Kong on April 7th. The previous week was the mix of different meetings around town, and there were few things on Mr. J’s mind other than his love of burgers (something that he really likes to explore in different places on his travels). This time his main interest was a combination of online dating websites for singles, night clubs around town, immigrant women workers’ issues and expat situation in this busy and hectic Southeast Asian port. Being an expat in Switzerland himself2, this topic probably resonated with him.
This was almost a relief, since the thoughts occupying him in the previous weeks, stimulated by dozens of texts, YouTube videos and documentaries, were mostly focused the on dark aspects of war mercenaries, British and American forces in Afghanistan.
The day started like any other. It was 01:36:04 at his home in Zurich 3 and 8 hours more in Singapore when Mr. J took his laptop computer and went on to browse the web.
He started at slow pace for the first 20 minutes, on and off his keyboard; he googled “Singapore young actress”, watched LinkedIn page of one of the managers of the FehrAdvice & Partners AG4 from Zurich area, took a look at the “starlet in Singapore Joicy Chu” and read Wikipedia article about the Academy Award winning documentary “Taxi to the Dark Side”5, about killing of an Afghan taxi driver who was beaten to death by American soldiers while being held and interrogated at Bagram base.

Before diving deeper into his Singapore explorations, he checked out two websites about job interview tips and tricks. Looking for new job opportunities online was part of his morning routine for some time now. Incidentally or not, around an hour later his thoughts would wander off to the matter of mid-life crisis. After a 12-minute break, he started to plan his day around town. First thing that he needed to do was to pop by 354 Admiralty Drive, an hour long ride on the public transport to the north of the city.
Probably feeling uncomfortable with the idea of going to such a faraway place at the completely opposite part of the city, Mr. J was zooming in and out Google map and checking different options several times.
Next location that Mr. J was interested in was more promising – The Swiss Club, founded in 1871 when it was known as The Swiss Rifle Shooting Club of Singapore, where friends of Mr Otto, the founder of this place, gathered with their rifles for some serious shooting practice in the forest at Balestier Road. Today it is a fancy upper class club with a swimming pool, a restaurant and a guest house.
At this point we will leave Mr. J to the privacy of his own thoughts.
I
Exploring Browsing History
This story was based on just a tiny excerpt, a two-hour sample, from the internet browsing history of a Swiss journalist J. B. In late June 2015 he visited the Tactical Tech office in Berlin as he was assigned to lay open his private life and see what can be told from the data he creates on his devices.
A year later, we gathered in Berlin for a week of data investigations and one of the data sets that we explored was the browsing history collection of Mr. J. Our goal was to find out how much we could learn from someone’s browsing history or, to rephrase it, what others can learn by exploiting data from our own browsing history.
Finding the real name and social graph behind browsing history
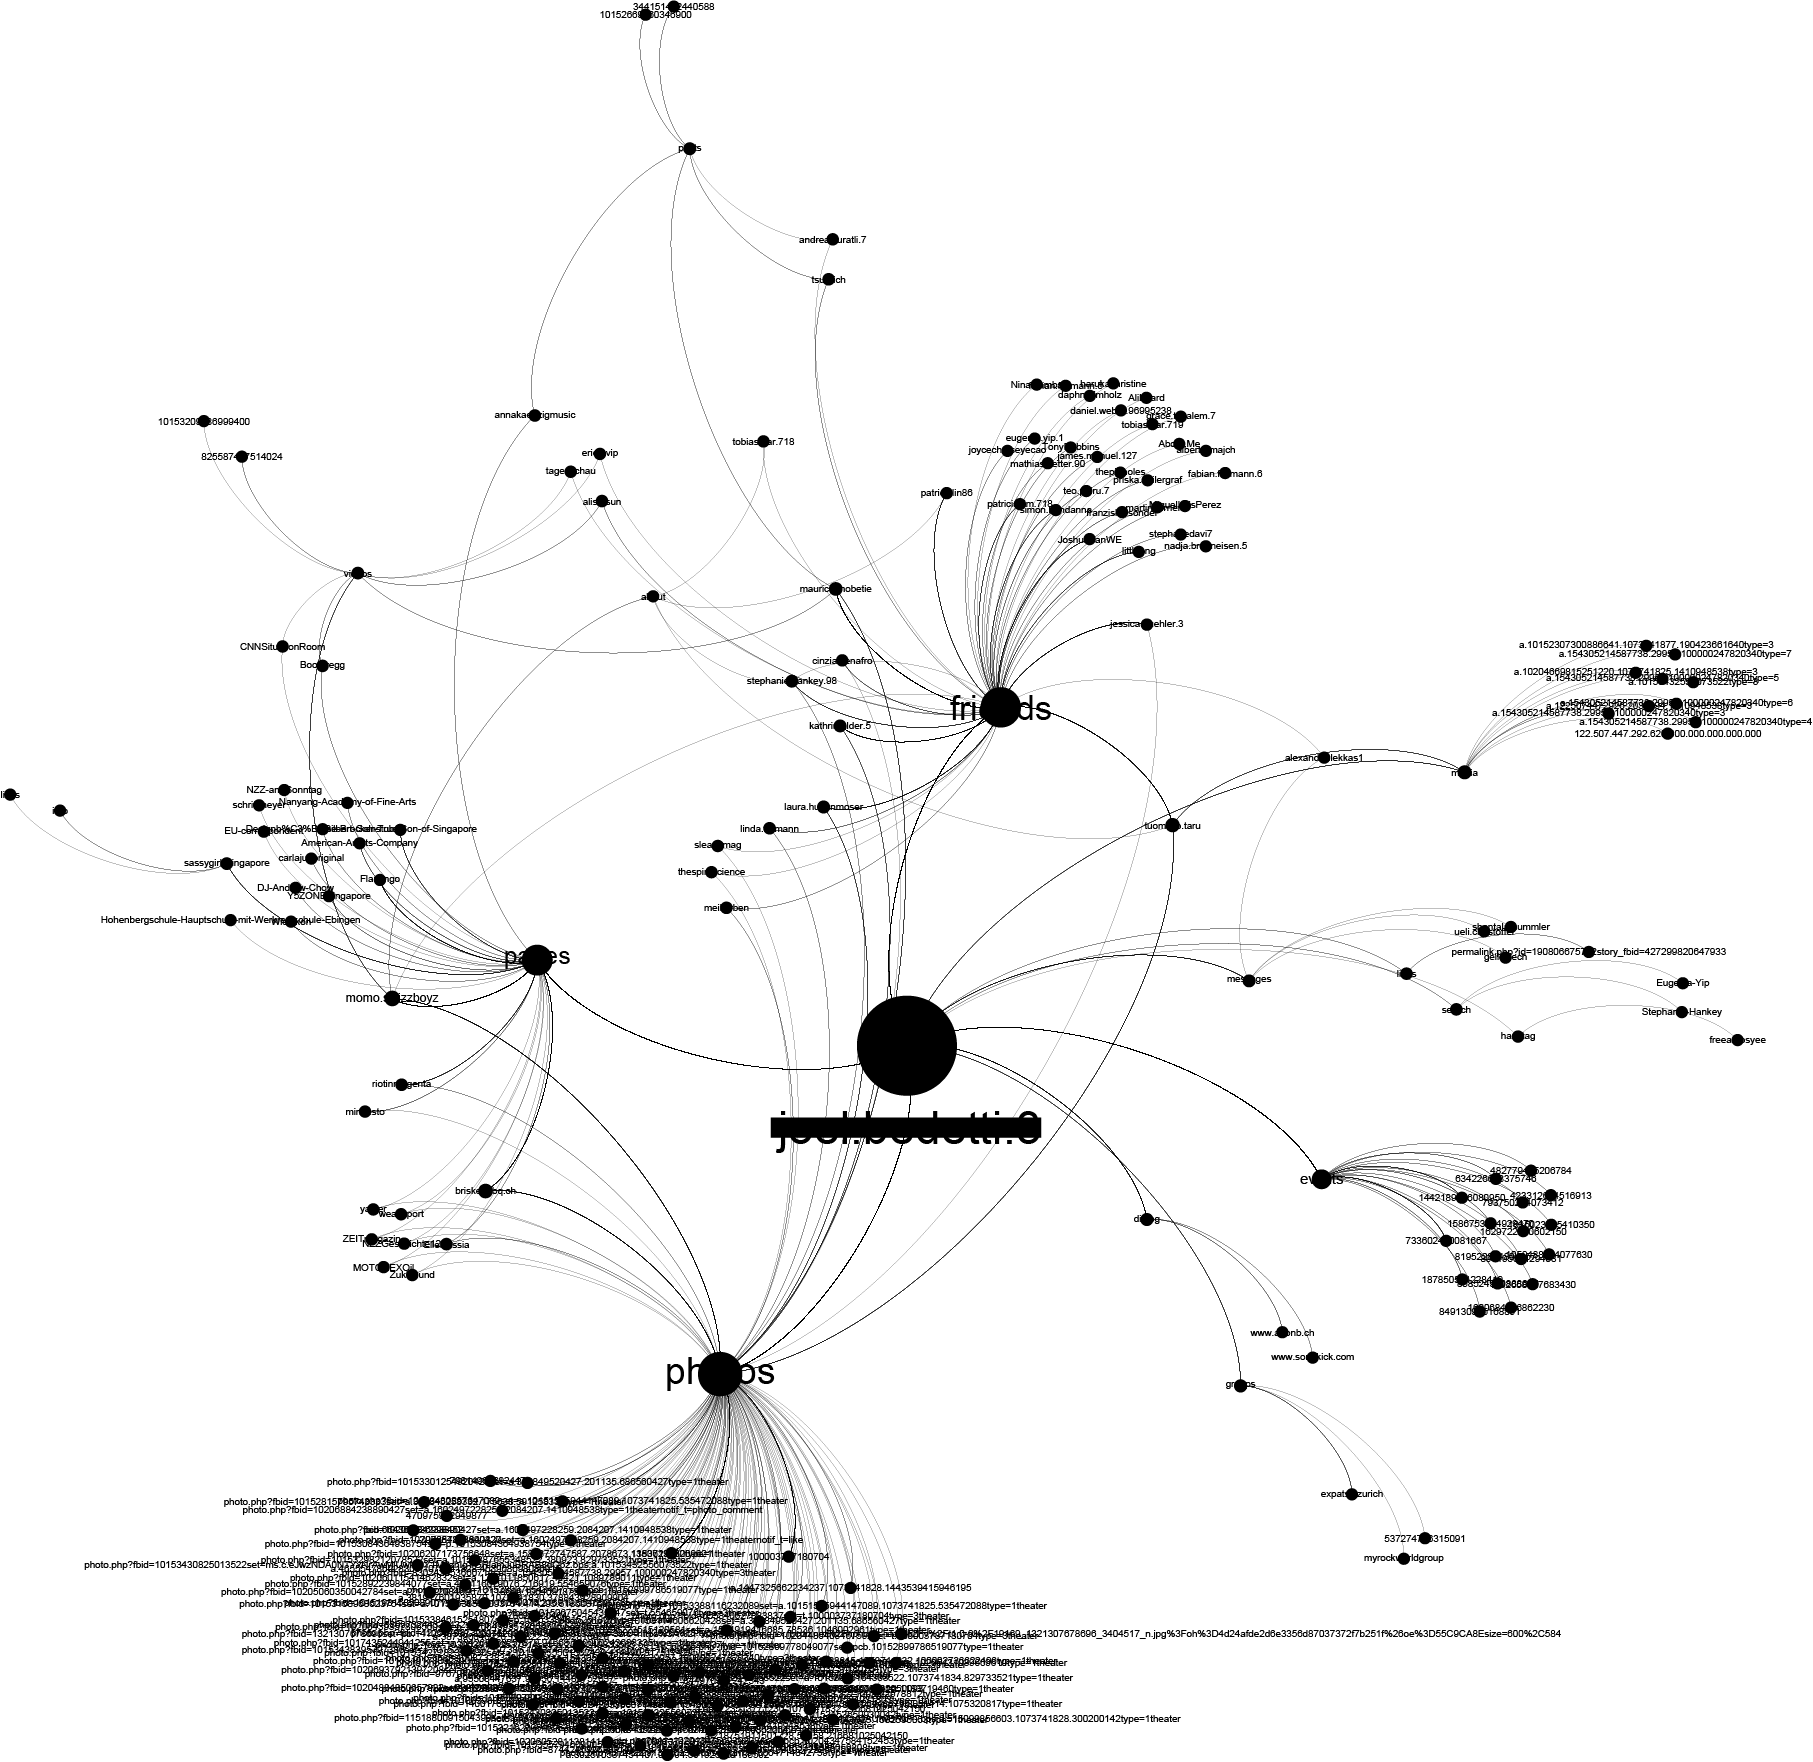
It took us just a few minutes of looking into the dataset to associate the real name of the person behind this browsing history. Just by sorting his Facebook traffic, i.e., the profile pages he visits, we were able to identify the real person. Since Facebook is enforcing a “real name policy” this is a neat way to link someone’s browsing history with their real name. For a more structured approach, there are numerous academic papers6 and models on how to uniquely identify users according to their browsing patterns and behaviors. Exploring Facebook URLs reveals much more than someone’s identity. Based on the structure of the URL we were able to reconstruct a part of this person’s social graph.
Mr. J’s intentions, desires, needs, and preferences
In his 2005 study, the industry analyst John Battelle describes Google as a ‘database of intentions’, ‘a massive clickstream database of desires, needs, wants, and preferences that can be discovered, subpoenaed, archived, tracked, and exploited for all sorts of ends’7. Exploring search queries from someone’s browsing history can give us some clues about this common relationship, probably the most personal one, between a person’s mind and this giant company.
Different forms of Google related URLs can reveal different interesting information. First, the most basic info is hidden in the country domain. Based on this alone, we were able to discern from which country Mr. J was browsing the web.
The following graph represents the online universe of Mr. J’s, consisting of all the websites that he had visited in a period of two months. From this social network analysis, we can see that Google has a dominant, central place in his online activities.
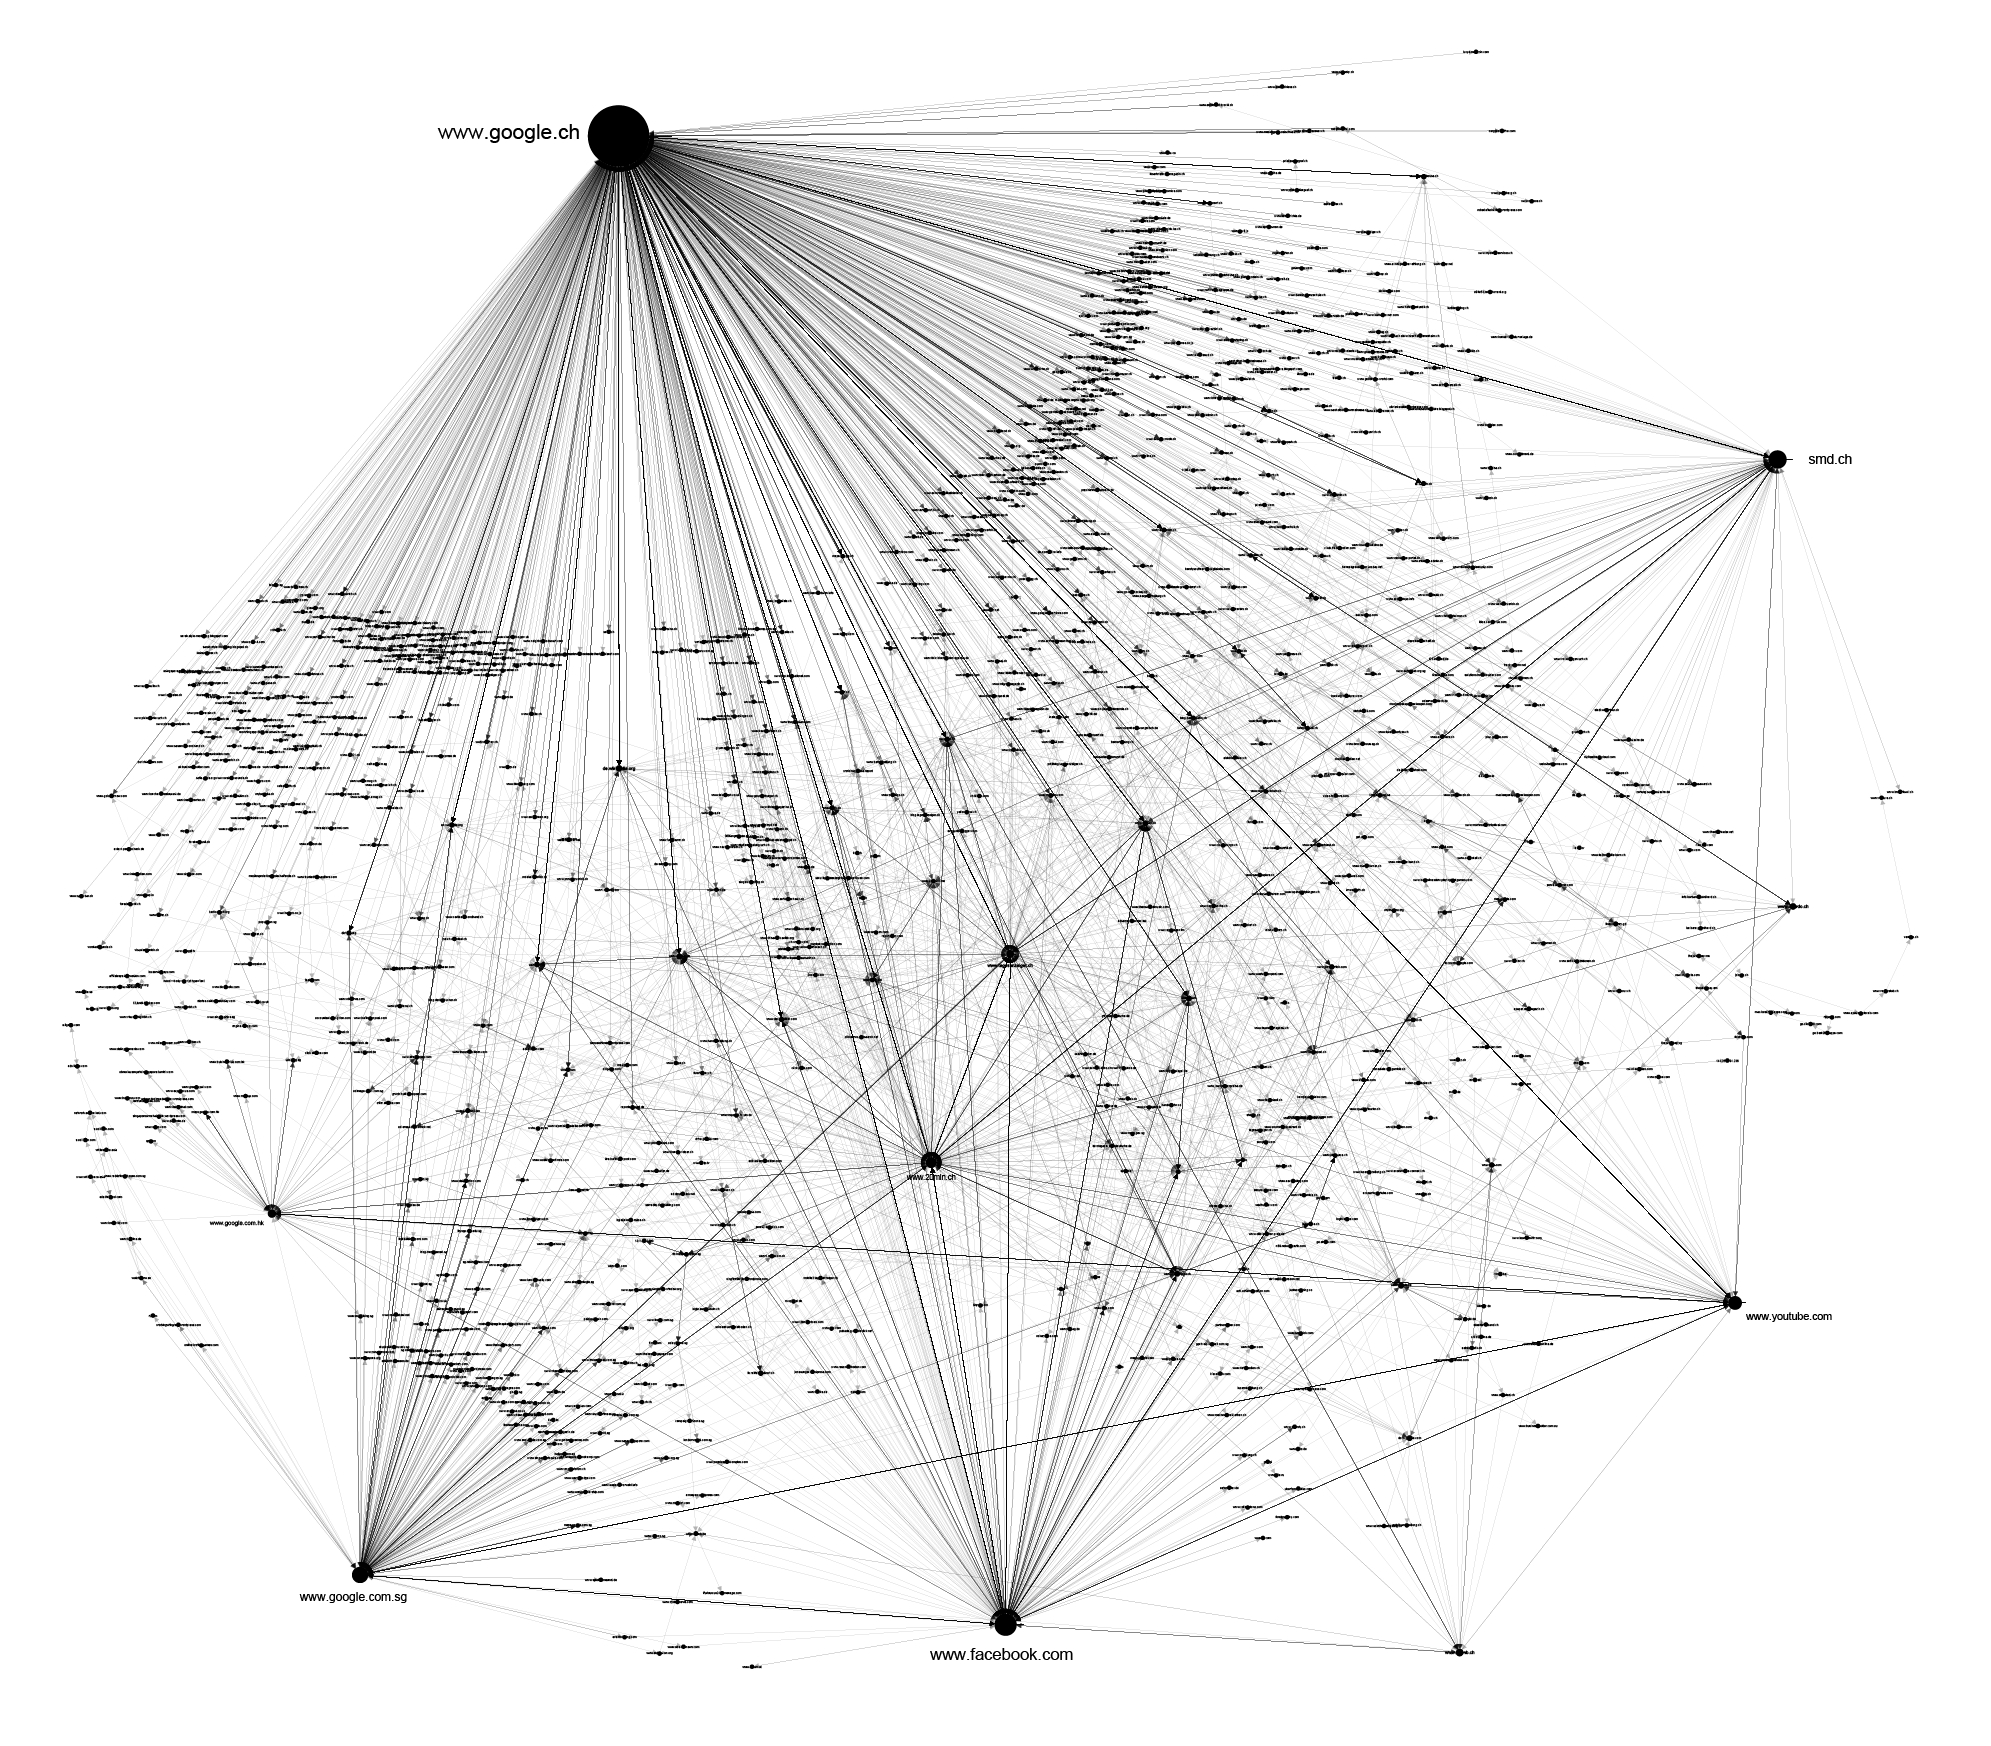
By parsing just query segments of Google URLs we can follow the dynamic of Mr. J’s interests, needs, and lines of thought during that time. If URLs from YouTube, another Google service, are added to this, the ‘cloud’ of Mr. J’s thoughts is even more complete.
Reality mining: Where is or where Mr J wants to be
These days it is hard to avoid geographic information systems, such as Google Maps. By merging the physical layer with multiple information layers, enhanced with location data from your mobile phones, they have established themselves as an essential tool for navigating the physical space, complex public transportation systems of big cities, commercial and social services, historical information, and even spaces consisting of wild Pokemon creatures and their training centers. They allow us to move through the physical space on an autopilot.
But those geographic information systems provide us services that collect not only our online behaviour data but also information on how we interact with physical space.
When Mr. J searches for some location on Google Maps, or tries to find a route to his next destination, we can easily extract information about that from his browser history. It feels really intrusive to see, for example, URLs that represent the exact routes and transportation that Google Maps suggested to him, or to see from browsing logs the spots on the maps he was zooming in or out. Not all of those location tags represent his exact location in time, some of them can be interpreted as his intentions, desires or preferences. Put together, this information can outline a profile in physical-informational landscape, where his actual locations in time are mixed with locations of his interests or desires.
Bed and Breakfast
Exploring other services that we can find in someone’s browsing history, can provide more insight into someone’s life. We started this story with the bed in which Mr. J woke up in Singapore. We got the picture of his bed from the Airbnb page we found in his browsing history. There is a clear pattern that we can discern when someone is choosing which apartment to rent on Airbnb.

Usually it begins by browsing different options, but then, when a decision is made in the mind of a user, they need to get in touch with the apartment’s owner, and that is an event that can be seen in the browsing history. Crossing this information with URLs from Google Maps for example, can help us confirm the location and time of someone’s stay in that particular apartment.

There are numerous other services that we can explore. For example, browsing through someone’s Yelp history can help us get a picture about their food preferences. Again, a combination of different services can reveal a line of thought and events, and help reconstruct someone’s behaviour. At one moment, for example, Mr. J was browsing the web, exploring his usual topics of interest, then he started exploring Yelp for restaurants in one particular area of the town, used Google Maps to navigate to the exact location, and then logged out.

Exploring Patterns: Creatures of habits in the eyes of the algorithms
We are creatures of habits, and we tend to create repetitions and patterns in our everyday behaviour. We tend to go to bed and wake up at similar times, to create our morning routines and create rituals of our social interactions. Since many segments of our lives are mediated by technology, those patterns are replicated and visible through the different digital footprints. When patterns are recognised, anomaly detection is born. As stated by Pasquinelli8, the two epistemic poles of pattern and anomaly are the two sides of the same coin of algorithmic governance. An unexpected anomaly can be detected only against the ground of a pattern regularity.
Both pattern recognition and anomaly detection are used as methods for understanding the vast quantity of data, our digital footprints that are being collected by many actors, from government agencies around the globe, internet companies and service providers or data dealers.
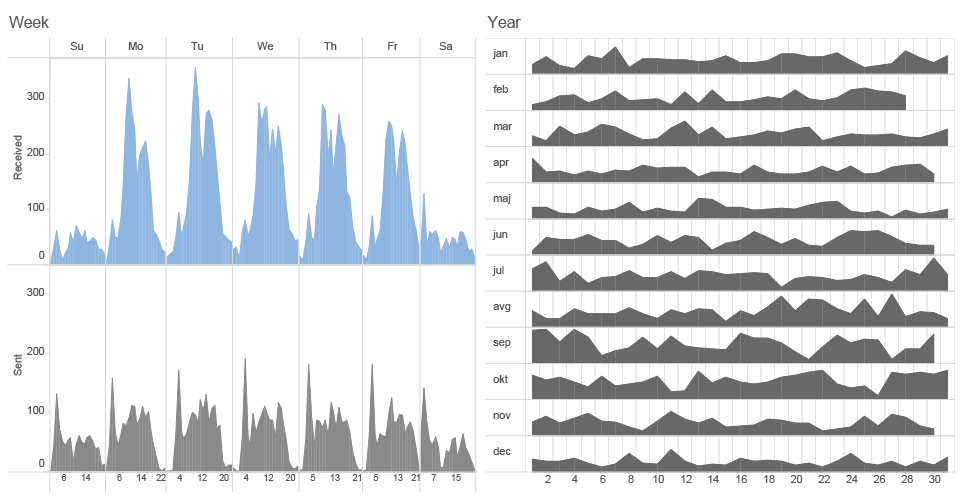
Something recognised as an anomaly in the eye of the algorithm can put you on the watchlist of a government agency or some behavioral pattern can label you as a target for an online advertisement. In the case of Mr. J simple bar charts and heatmap based on the number of browsing actions in time can reveal few patterns of behaviour.
As we explored earlier in our investigation of email metadata9, pattern-of-life analysis is a method of surveillance specifically used for documenting or understanding subject’s habits. It is a computerised data collection and analysis method used to establish the subject’s past behavior, determine their current behavior, and predict their future behavior.
Just a quick glance at this heatmap can expose differences in behaviour of Mr. J during time of his travels in Hong Kong and Singapore (April 05-26) and a more structured behaviour during his stay at home in Switzerland. We can detect a potential holiday (offline) period from May 1st until the evening of May 7th, differences between working days and weekends, as well as his favourite time for lunch breaks. Patterns can be explored not only on the level of frequency of someone’s browsing, but we can also explore which particular websites or services feature in browsing history over the time.
Trackers
Different actors are trying to acquire different parts of one’s browsing history, depending on their position in the data flow. Almost each move in the online environment is tracked and recorded by hundreds of different invisible trackers, a network of hidden and soundless ”sensors” that are collecting information about your online movements, without any sign of their existence at all. We used a methodology for mapping the trackers behind websites that Mr. J was visiting based on the tools developed for the Trackography10 project by Tactical Tech. In the following graph you can find all the trackers and companies behind them that were collecting information about Mr. J’s visits during the two months we examined.
![]()
Deep mining
Dave: Hello, HAL. Do you read me, HAL?
HAL: Affirmative, Dave. I read you.
2001: A Space Odyssey (1968)
Previous examples were just exploring a surface level of Mr. J’s browsing, relations and meaning extracted only from the URLs themselves. The real meaning of all the text, pictures or videos that occupied his attention is of course not always visible from just a URL of a page visited. In order to go deeper into his experience, we will need to dive into the content itself.
If we give up the unreasonable idea to read every article from someone’s browsing history and tag each content by using our human brain, an obvious choice would be to find a methodology for automated extraction of keywords and meaning from the content. For this investigation we chose to test one of the available solutions that is using a type of artificial intelligence, machine deep learning method for text analysis – Cloud Natural Language API11. According to Google, this tool attached to its deep learning platform, can be used to extract information about people, places, events, and much more, mentioned in text documents, news articles or blog posts. It can be used to understand sentiment on social media or parse intent from conversations happening in a call center or a messaging app.
Back to the beginning of our story on that Friday morning, when Mr. J read Wikipedia article about the documentary “Taxi to the Dark Side” – this is what Google natural language, deep learning platform understands what Mr. J was reading about:
It is clear that this kind of tool is or can be used for analysis of our online behaviour, more precisely for identifying the keywords, persons or locations that we are interested in, by various actors in the game. This is the step forward in understanding and classifying someone’s behaviour, needs, and interests on a deeper level. Similar practice, as we explained in our previous research, is used to extract and cluster topics and keywords from created content within Facebook platform in process of transforming user behaviour into profit. But, the same process can be potentially used for different purposes, for example associating users with keywords, people or locations “of special interest” for a government agency.
Who Has Access To Browsing Data?
Understanding who has access to our browsing histories and the possibility to analyse it will give us an insight into the new power structures and distribution of wealth in the information society.
Lieut. Maury. Map from 1852. Source: raremaps.com
IV – From Past to Present
19th century roots
In 1850s U.S. Navy Lieut. Matthew Fontaine Maury uncovered an enormous collection of thousands of old ships’ logs in the US Naval Observatory. At the time, logs were not considered important information after the voyage was completed. Following his obsession, he developed a method to systematically extract key information from each log book and started to draw a map by hand with weather and currents information, using more than 1,2 million data points in order to increase navigation speed and safety of ships at sea. He is considered to be one of the pioneers of what we today would call the big data analysis, someone who was among the first to realise the value of information created from thousands of smaller chunks of data. But for our context there is another interesting aspect around this story. His maps were proven to be highly useful and successful, not just within the Navy, but also among merchant ships. Knowing the importance of new data collection, Maury established the principle of exchanging maps for the ships’ logs. This practice of offering a product or service, maps in his case, in exchange for sailing logs, like today’s browsing histories, is a fundamental part of the main business model of contemporary information technology giants such as Google or Facebook 150 years later.
A decade earlier, in 1840s, on the other side of the Atlantic, in the UK, there was another important historical event relevant to our story. According to David Vincent13, this period promoted the creation of what we would now term social networking, the use of the information technology of the time (postal service) to extend the realm of personal interactions. It was possible to conduct conversations, arrange and engage in meetings within cities, by exchanging mail back and forth in a single day. Prior to 1840 the postal services were mostly run by decentralized networks of informal letter-carrying outside of government control, developed to circumvent the high costs of the Royal Mail.When Penny Post was introduced as a centralized, low cost, government run postal service, the issue of privacy was written off on account of keeping the nation safe from internal threats, fueled by fears of the growing working-class movement.This allowed government the access to postal communication of citizens, and for the first time the communication practices of a nation were systematically counted and generated statistics.
As framed by Vincent, the same kind of statistical testing is available now. It is more granulated, more voluminous, more instant, and unlike the nineteenth century, involves the profits of multinational corporations.

‘Secret Office’ is formed much before, in the 1650s and operated within the General Post Office as an undercover state spying institution. The main role of this office was to intercept mail between Britain and overseas, and to read it. During the 1840s, the Secret Office was somehow exposed and an inquiry was held to investigate its activities.14
Present : Towards Thought Police
“There was of course no way of knowing whether you were being watched at any given moment. How often, or on what system, the Thought Police plugged in on any individual wire was guesswork. It was even conceivable that they watched everybody all the time. But at any rate they could plug in your wire whenever they wanted to. You had to live — did live, from habit that became instinct — in the assumption that every sound you made was overheard, and, except in darkness, every movement scrutinized.”
1984, George Orwell
 George Orwell’s 1984 – 1954 BBC TV Movie
There is a persistent effort to dwindle down the “electronic communication transactional records” to mere additional information of a person’s whereabouts, much like those the investigators would get from a cooperative bystander providing insight to someone’s comings and goings. Or those obtained through the so-called “national security letter”, an administrative subpoena that enables US federal agencies to gather information without prior judicial oversight.15
Sitting in front of the US Senate Select Committee in a hearing session held in February 2016, the head of the FBI allegedly referred to the proposed addition of the disputed phrase as fixing a “typo” 16. Six years ago, before a similar editorial intention failed, the US administration flashed their utter indifference to the content of communication, seeking only its technical records. “It’ll be faster and easier to get the data”; all the data that is already there, produced on a mass scale with every single click.
But the electronic communication transactional records, or the communication data – such as the numbers dialed, recipients of text messages sent, IP addresses of the devices involved, and particularly records of web domains visited – sometimes reveal more than the content itself, as we can see from this and our previous research. In the words of privacy groups: “These information could reveal details about a person’s political affiliation, medical conditions, religion, substance abuse history, sexual orientation, and even his or her movements throughout the day,“ painting an incredibly intimate picture of a person’s life.17.
The true scope of this hunger for communication data was revealed when Snowden blew the whistle on the National Security Agency and one of its handy tools, a computer system called Xkeyscore used for searching and analyzing global internet data, which NSA collects daily. As a “widest-reaching system for developing intelligence from the internet”, including the content of emails, websites visited and searches, as well as their metadata, Xkeyscore allows NSA analysts to search its vast databases with no prior authorization.18.
Another project, funded by DARPA can give us an interesting insight into the future applications of data collection and analysis. The Anomaly Detection at Multiple Scales (ADAMS) program creates, adapts and applies technology to anomaly characterisation and detection in massive data sets. Anomalies in data cue the collection of additional, actionable information in a wide variety of real world contexts. The initial application domain is insider threat detection in which malevolent (or possibly inadvertent) actions by a trusted individual are detected against a background of everyday network activity.19.This 35 Million USD project is intended to detect and prevent insider threats such as “a soldier in good mental health becoming homicidal or suicidal”, an “innocent insider becoming malicious”, or “a government employee abuses access privileges to share classified information”.This project is basically creating platform for recognition of the next Edward Snowden or Chelsea Manning within the big systems such as Military by analysing browsing habits of individuals among other data sources such as mobile phone logs or location data for example.
The data craze is in no way limited to the Western managers of war on terror and other interesting parties, but it holds the same universal pretext, national security. The difference is that China, for example, feels it is time to move the game one step forward, literally: one of its largest state-run defense contractor, China Electronics Technology Group, now works on order to develop software to collect and combine data on jobs, hobbies, consumption habits, and other behavior of ordinary citizens “to predict terrorist acts before they occur”20.Officials announced that this “united information environment”, dubbed predictive policing data platform, would first be tested in territories with mostly ethnic minority population21. Apart from conventional means of data gathering, such as extracting financial records and security cameras footage, or plain old neighborhood denouncing, more efficient in rural areas, the pre-crime platform also collates data on online behaviour of Chinese citizens.22
If it’s not national security, then it’s profit that craves for online behavior patterns, and not much room is left to decide which is the lesser between the two evils. Both a government and a corporation would surmise consent to being tracked from mere existence within their domain, while the limits are negotiated with each tool discovered.
Who is Mr. J?
So, can we really know who Mr. J is just by sifting through the URLs in his browsing history?
He may be an extremist in the making, sickened by crimes committed in the name of democracy stripped of any meaning in a relentless pursuit of profit. Or – was it in fact that Mr. J was contacted by yet another Swiss bank whistleblower, with leaks about worldwide financial fraud? Circumstantial as they are, the data gathered from Mr. J’s browsing history offer a striking insight into his stream of consciousness on a particular day. Knowing his thoughts, real investigators would need more data to confirm any of the possible theories as to what practical significance those thoughts bear. Either way, Mr. J remains exposed In the end, Mr. J is probably just an ordinary, decent, somewhat tired guy seeking a respite from a job treadmill. Fully deserving of his privacy.
Credits
This investigation was the join data adventure of Tactical Tech and Share Lab team conducted in August 2016 in Berlin.
Tactical Tech Crew
Fieke Jansen, Tactical Tech,Politics of data – data collection, analysis and investigation
Leil Zahra Mortada, Tactical Tech – data collection, analysis and investigation
Christo, Tactical Tech – data collection
Claudio Vecna, data collection
Share Lab Crew
Vladan Joler, investigation, analysis, visualisation and storytelling
Olivia Solis Villaverde, analysis, investigation and data visualisation
Mr. Andrej Petrovski, data collection and analysis
Dušan Ostraćanin, data collection and analysis
Milica Jovanović, text, editing and storytelling
COVER PHOTO: Nicolas Lannuzel via Flickr
Special thanks to Mr. J for providing and giving us possibility to investigate his browsing history
***
]]>
Most of those traces are hidden in metadata, i.e. tiny pieces of information stored in IP packets, headers of your emails or files that you are creating.
There is an ongoing debate over the significance of metadata. We wanted to question а somewhat heretical argument that bulk metadata contain sensitive information about private life of internet users and confront it with a ruling opinion that such statement is overrated. We have therefore undertaken the following social and scientific experiment using different methodologies. The purpose of this research is to investigate and consequently inform the scientific and popular audience about the real importance of metadata for our privacy.
In our previous research we explained how metadata is being collected and accessed by numerous actors – government agencies, Internet service providers, Internet companies such as Google or Facebook, data dealers or producers of mobile phone applications. We explained the invisible infrastructure behind data flow, but we never had a chance to investigate what these actors can really do when they have access to a vast amount of metadata about you. This data investigation is exactly about that.
This story is about the power of Metadata.
Our little “Big Data”
In the next few days Wikileaks and Transparency Toolkit published a searchable database of Hacking Team’s emails revealing details of their operation, contacts and communication with government agencies, companies and individuals around the globe as well as the functionalities of their cyber surveillance weapons.
Hacking Team designed a modular, multifunctional and cross platform surveillance solution, RCS (Remote Control System). The solution gives the operator a full and uninterrupted access to and control over the infected device, the privileges of the operator of the software are limitless, they can send email or SMS and make phone calls, listen in on the user’s phone calls and read encrypted communication. The access is not limited exclusively to the software, the operator can also manipulate with the hardware on the infected device, i.e. activate the microphone or the camera and record audio and video or take photos. The software is designed in such a manner that its operation goes undetected by any anti-malware or anti-spyware scanner, its traffic is well blended in with the user’s legitimate Internet traffic.
We were given this pile of data and soon we REALISED there was another gem hidden in it. We were able to extract a substantial amount of metadata – headers from hundreds of thousands emails from their database. We got our own little portion of Big data and that is where our research began.
Do It Yourself Metadata Investigation
The concept behind data-mining and analysis operation performed by the government agencies around the world is that metadata can be analysed to reveal connections between people, and these links can generate significant investigative leads.
This is not exclusively done by government agencies, our metadata is constantly collected and examined by major Internet companies such as Google and Facebook, but for the purpose of profiling of users and transforming our behavior into profit, which reaches tens of billions US dollars per annum.
Thanks to Edward Snowden’s revelations in June 2013 we got insight into the NSA Stellar Wind, Boundless Informant, PRISM and XKeyscore programs. One of the scopes of those programs was collecting and analysing large amount of email metadata. Analysis involve operations such as contact chaining, building a network graph that models the communication (e-mail, telephony, etc.) patterns of targeted entities (people, organisations, etc) and their associates from the communications sent or received by the targets.
NSA IG-DRAFT REPORT
“Metadata is extraordinarily intrusive. As an analyst, I would prefer to be looking at metadata than looking at content, because it’s quicker and easier, and it doesn’t lie.”
Edward Snowden
Edward Snowden
In some kind of reverse engineering process we explored the possibility of using their own methodology for an independent data investigation of the Hacking Team, one of the “CORPORATE ENEMIES OF THE INTERNET”.
Investigation process
Email Metadata : Building blocks for our investigation
Let’s begin with a short explanation of our little treasure – email headers. Every email consists of three components: the envelope, the header, and the body of the message. The envelope is a part of the internal process by which an email is routed, the body is the actual content of the message and the header, the third component of an email, is the point of interest of our research.
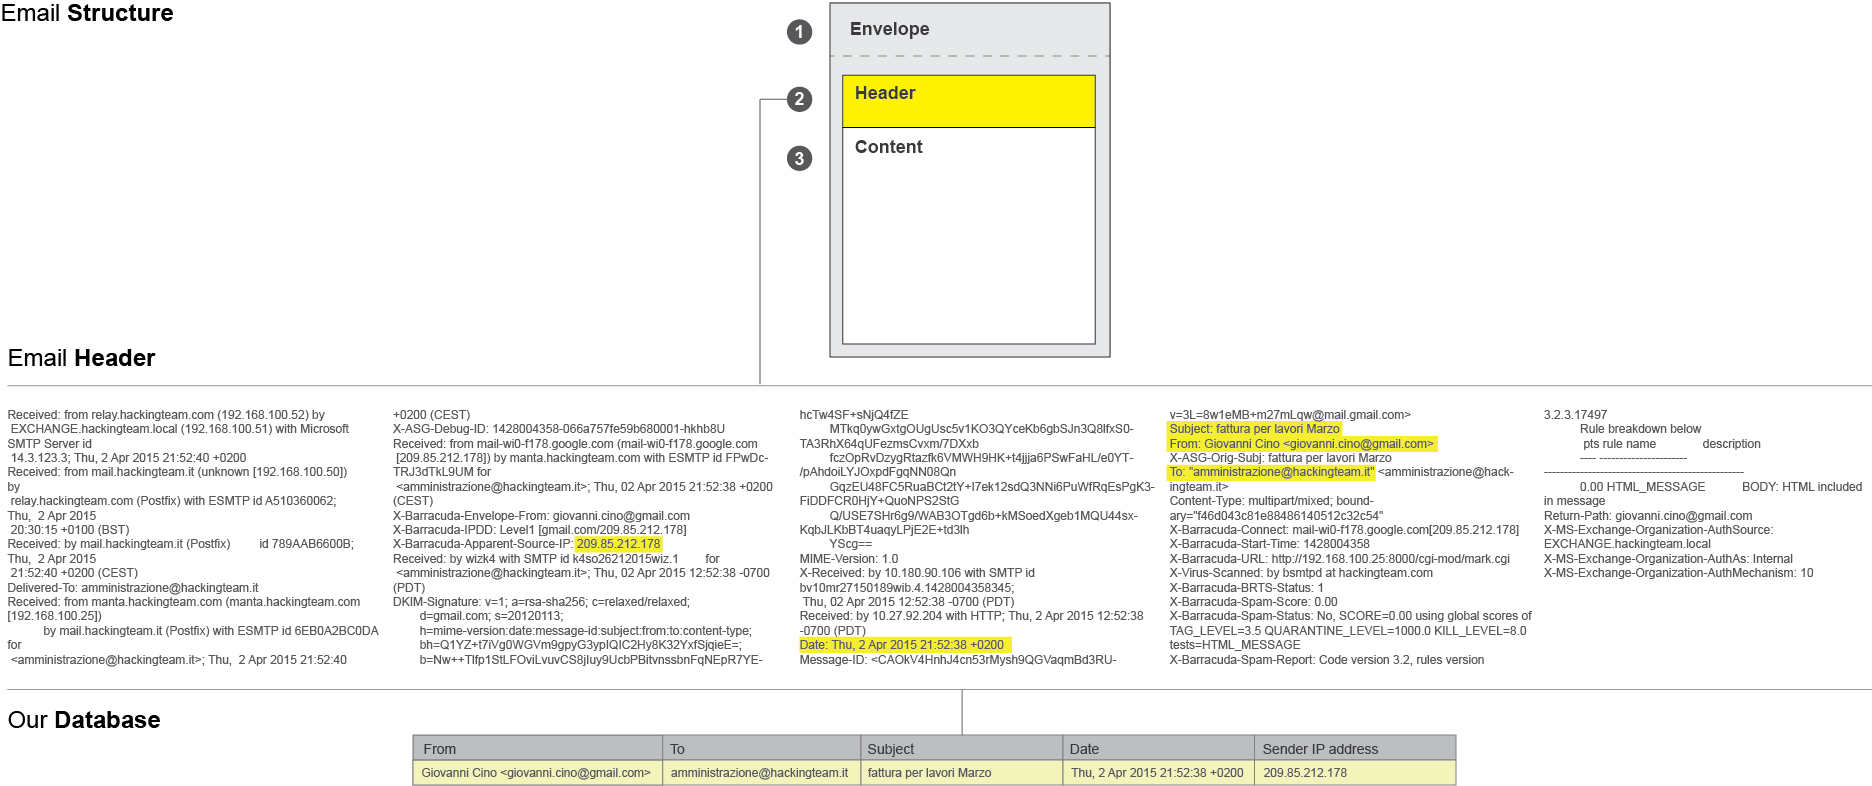
Headers identify particular routing information of the message, including the sender, recipient, date and subject, sending and receiving time stamps. In some cases email headers also contain the IP address of the sender and information on the route an email takes as it is transferred from one computer to another.
 Tools : Export from MS Outlook Code Two Outlook Export > Data processing MS Excel
After extracting data from around 60 accounts and hundreds of thousands emails of Hacking Team employees, we got a database we could work with.
Needles in a haystack
The first step we took in exploring this pile of data was to perform a Social Network Analysis, a strategy for investigating social structures based on network and graph theories. It characterises networked structures in terms of nodes (individual actors, people) and ties or edges (relationships or interactions) that connect them. In our case, the network graph represents an analysis of all email headers exchanged between Hacking Team employees and their contacts between 2012 and 2015. Even at this very begining of the investigation we were able to detect the main internal and external actors and ties, more precisely by the amount of exchanged emails between them.
By selecting the individual nodes, we are able to explore their individual social ties and contacts.
Social network Analysis of hacking team email database ( period 2013-2015 )
Tools : Social Network analysis with Gephy exported with Sigma.js by Oxford Internet Institute
By filtering out the nodes with less than a 100 exchanged emails, we isolate the internal Hacking Team communication and get a closer look at their internal structure based solely on it.
Social network analysis of nodes with +100 exchanged emails
TOOLS : SOCIAL NETWORK ANALYSIS WITH GEPHY EXPORTED WITH SIGMA.JS BY OXFORD INTERNET INSTITUTE
Giving that this was somewhat a learning process of our own, while exploring the metadata we came to notice that our understanding of data and leads we got from it highly depended on the type of visualisation we applied to the data set. Sometimes ties between different actors were more successfully, more clearly revealed by using different visualisations. Like in this example, where we see the same data set as the one presented above, but this time in the form of a heat map.
Heat-map of internal communication
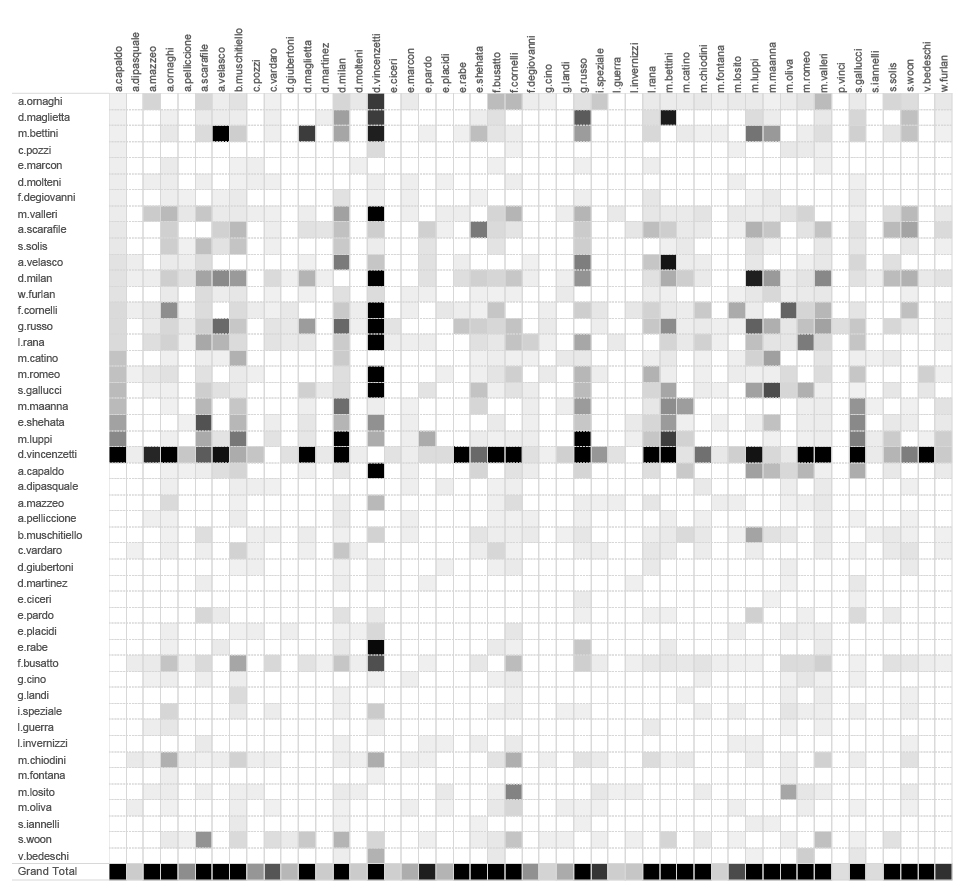
By spotting the darker squares we can explore individual ties between different employees within organisation. D. Vincenzetti is clearly the main actor in this graph, but we can also notice a few other strong relations across this heatmap, that can help us get a better insight into their organisational structure.
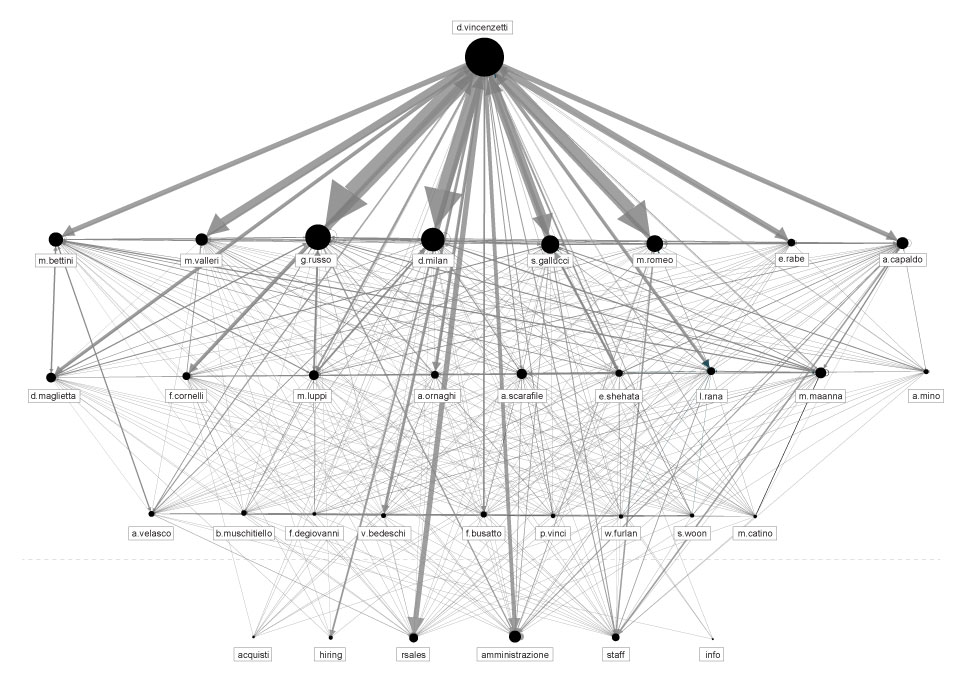
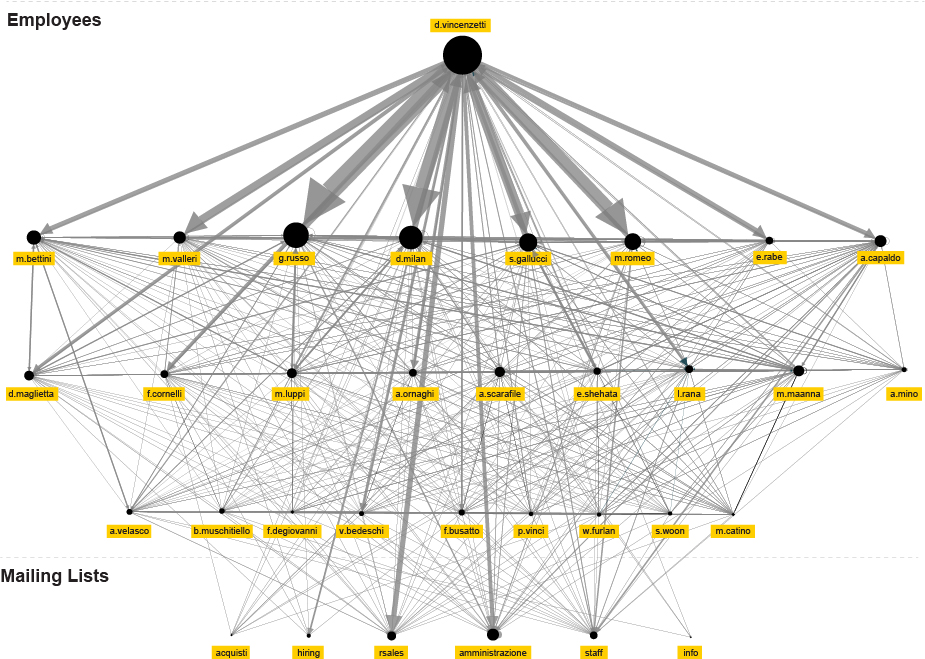
Finally, using the insights from both visualisation methods, we are able to shape a communication chart that might represent a credible representation of the organisational structure. It probably doesn’t display relations that are in accordance with what is written on their business cards, but on the other hand it probably represents real relations between people within the organisation better.
Potential organisational structure based on the level and direction of communication
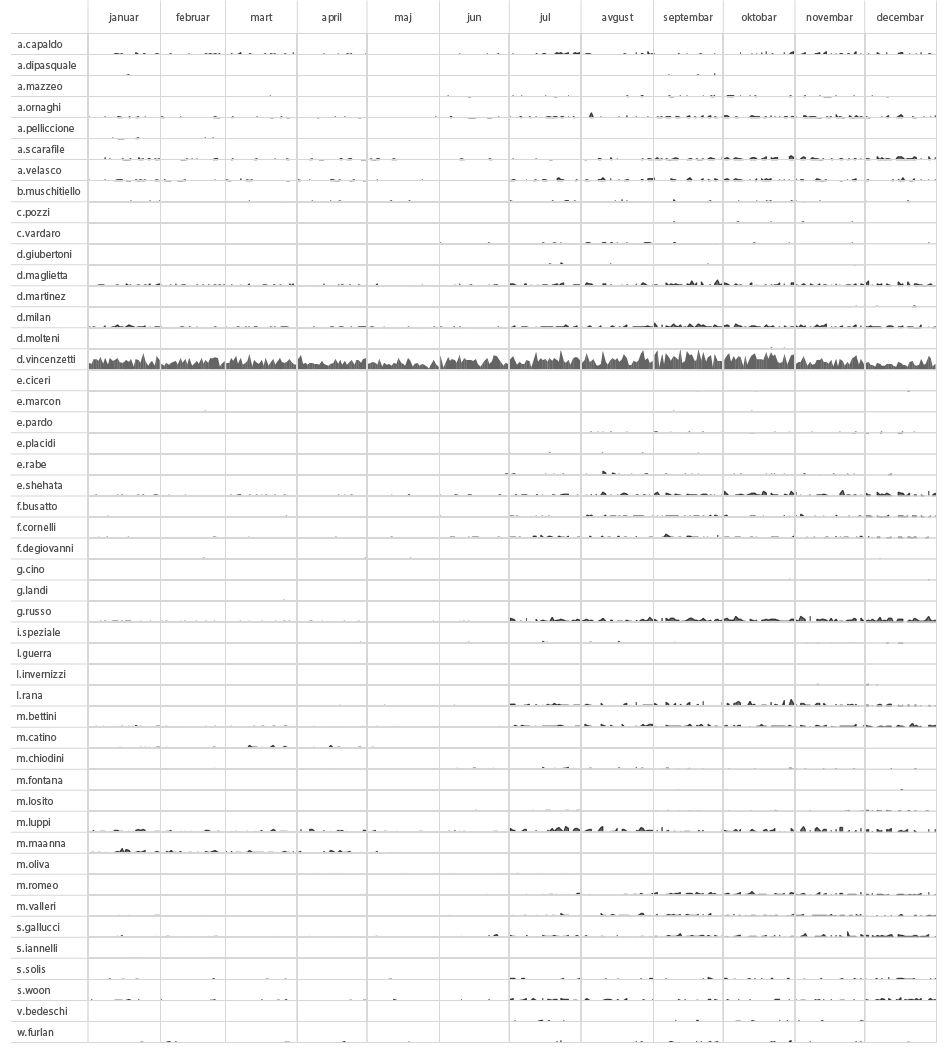
Setting aside the organisational structure, if we were to add another interesting piece of information retrieved from metadata – the time component, we would be able to track the activity of every individual employee in time, based on the number of sent messages from each one of them. Having done this, we created the following activity chart. With this kind of analysis you could, for example, speculate or determine which part of the year is the busiest for the organisation or, combined with other information inputs, when certain employees went on vacation or took a leave of absence.
Number of sent emails per HT employee in time (2014)
Exploring External Contacts
Even more interesting, or relevant for investigative data journalism and our effort to understand the nature of the organisation that we are investigating, are probably the external contacts.
In our set of data that means around 4600 different individuals that exchanged emails with Hacking Team employees in the course of 2 years.
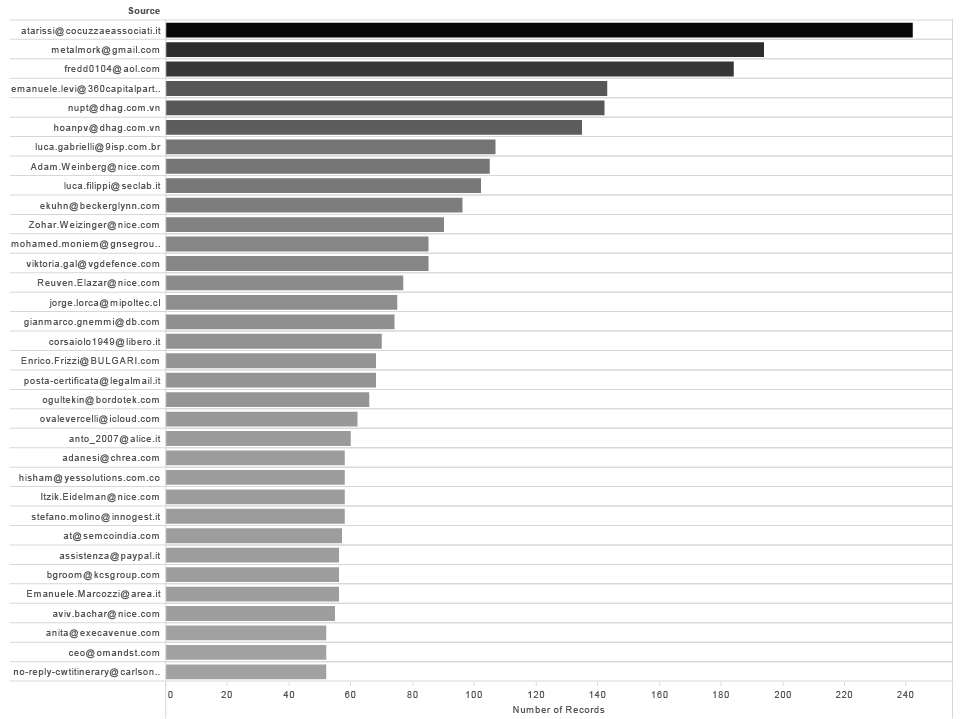
If we exclude all the @hackingteam.com adresses and rank results by the number of records we are going straight to the point. This is the list of Hacking Team contacts with more than 50 emails exchanged.
External contacts with more than 50 emails exchanged with HT Employees ( 2014-2015 )
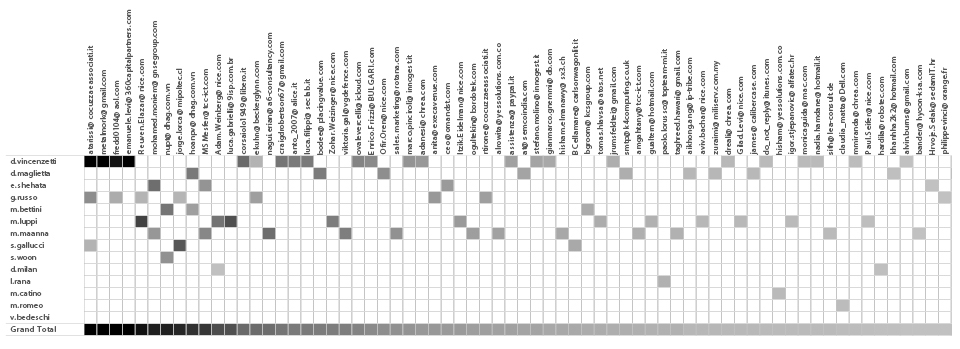
If we add the Hacking Team employees on the other axis, we will get information who in the team communicated with external contacts and how frequent and strong the communication was.
Number of emails exchanged (>30) between HT employees and external contacts ( 2014-2015 )
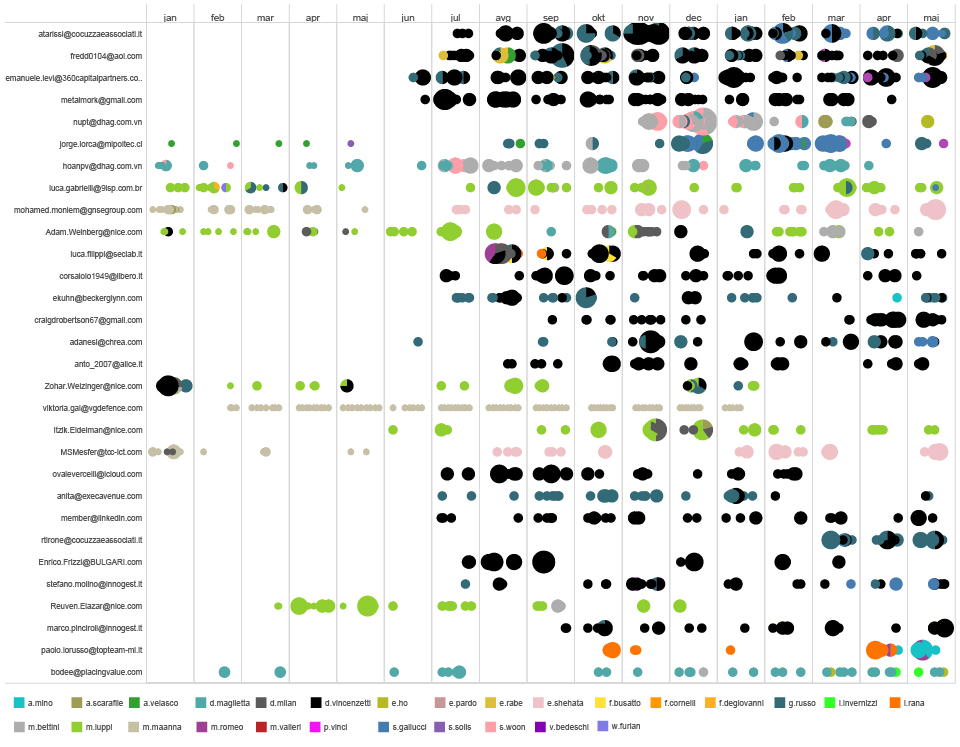
Additionally, if we add the time component, we have a complete overview of who communicated with whom and when.
Timeline of individual communication of external contacts and ht employees ( 2014-2015 )
We grouped the emails by domain, and after some research about the companies behind the domain names, we classified them by the type of service they officially provide.
external contacts grouped by the domain name based on the d.vincenzetti emails
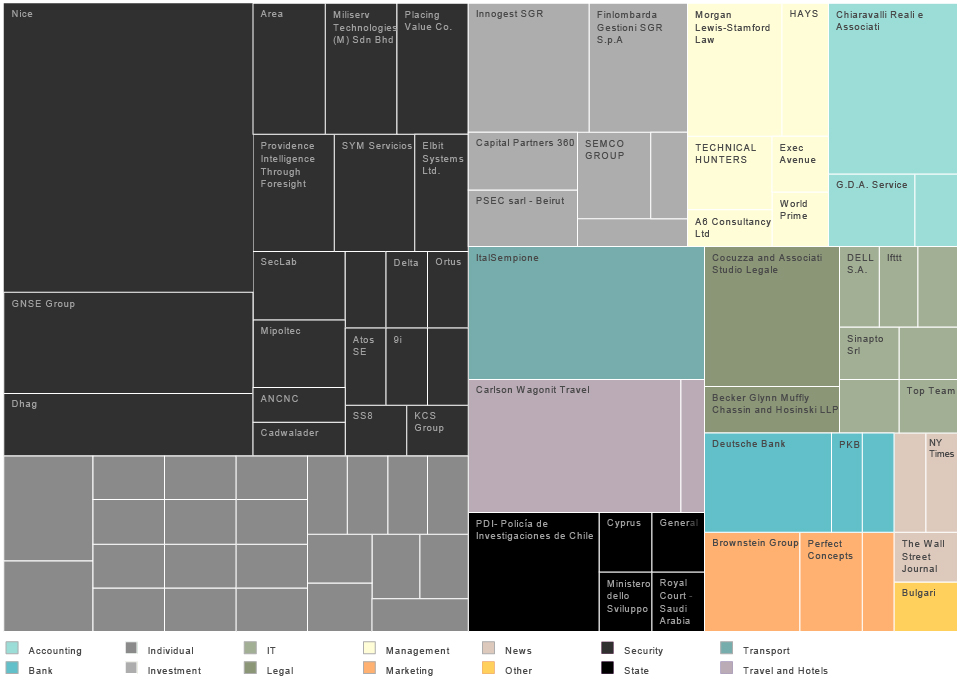
According to this treemap the biggest group of organisations collaborating with HT are from the “digital security” sector, followed by individual contacts, i.e. “consultants” and venture capital companies.
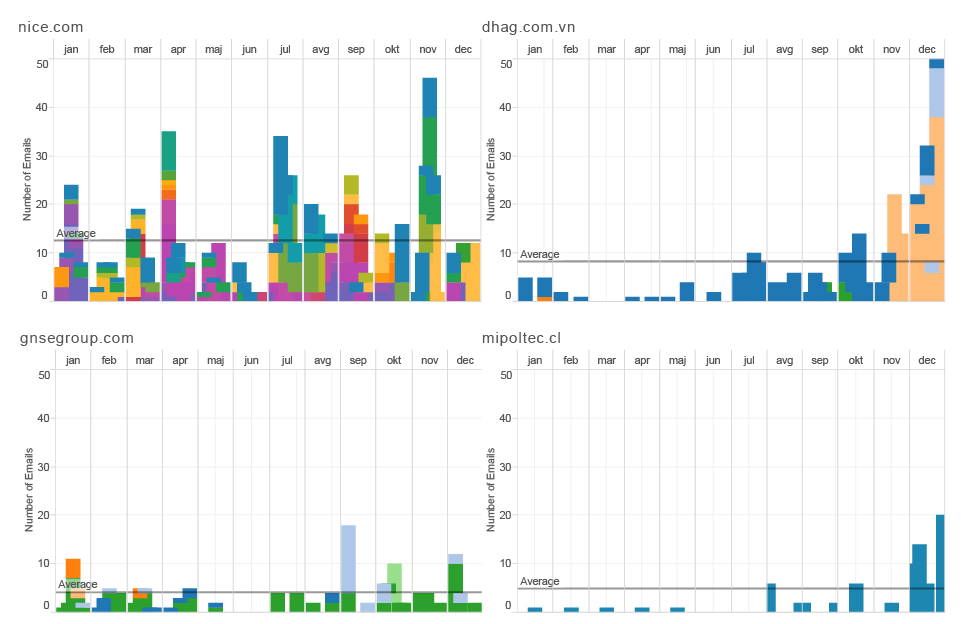
We can explore the relation between selected companies and Hacking Team in time.
Timeline of selected companies email communication with ht employees (2014)
According to their official STATEMENT “NICE solutions empower organisations to capture, analyse, and apply, in real time, insights from both structured and unstructured Big Data. This data comes from multiple sources, including phone calls, mobile apps, emails, chat, social media, video, and transactions. NICE solutions are used by over 25,000 organisations in more than 150 countries, including over 80 of the Fortune 100 companies”. Looking at the data we analysed we can probably conclude that the same expertise and tools for collecting data and analysis is shared and being sold on different markets and to different target groups, Hacking Team for government agencies and Nice Solutions for companies and law enforcement agencies.
Pattern of life
Humans are amazing pattern-recognition machines. We are constantly analysing complex sets of inputs, and making decisions based on facts we previously encountered or learned. But in recent years, we are not the only ones who analyse patterns around us, we are becoming more and more the object of analysis, mostly performed by machines and algorithms.
The unique way we interact with the technology we use, the unique set of contacts we have or our unique behavioral patterns define our metadata signature, our fingerprint. In the eyes of the algorithmic analysis every single person is unique.
Pattern-of-life analysis is a method of surveillance specifically used for documenting or understanding subject’s habits. It is a computerised data collection and analysis method used to establish the subject’s past behavior, determine its current behavior, and predict its future behavior. This form of analysis is generally done without your consent, and it’s applied not just in the security field, but it is a core activity and business model of many of the biggest Internet companies. More commonly, pattern of life analysis is called profiling. Inputs for this analysis are in most of the cases our metadata collected from emails, IP traffic or data from mobile phones and other technology we use.
Even though we are just limited to email metadata in our research , we will try to perform pattern of life analysis on one key figure from Hacking Team and try to see what we can get.
According to the previous phases of our metadata investigation, an obvious choice of a node (person) with the biggest amount of internal and external contacts and communication is [email protected]. We will call him Mr.D.
We are trying to understand 3 main things here:
What is the behavioural pattern of Mr.D ?
What are the anomalies in this pattern?
How different the behavioural pattern of Mr.D is in comparison to his social/professional circle?
pattern RECOGNITION : sum of Mr.d sent and received emails per hour during the day (2014)
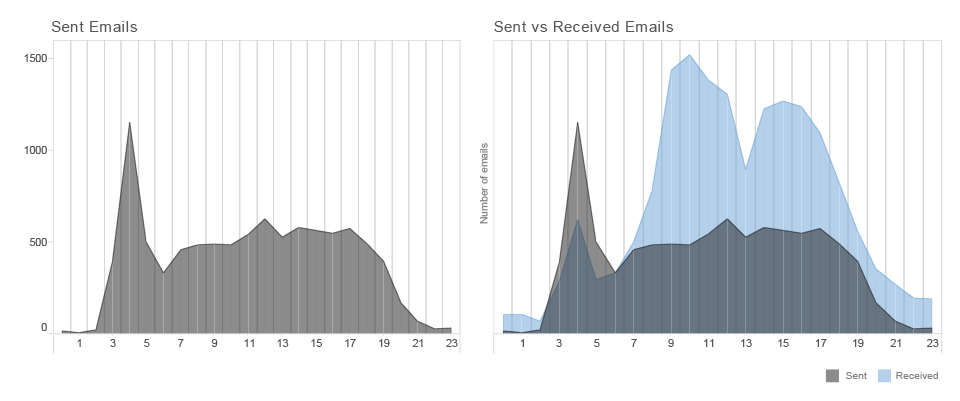
Sent emails represent the behaviour of the person that we are examining and received emails represent the overall behavioural pattern of his social or professional environment.
Mr.D is not the same as other people.
He starts his activities quite early in the morning. Almost every day around 4 a.m. is his time of concentration, the moment when he sends the biggest amount of emails during the day. If we are comparing the number of sent and received emails we can see that Mr.D has different habits than most of his contacts. His social and professional circles are most productive around 10 a.m., most of them have a lunch break around 1 p.m. and their productivity rapidly declines from 4 p.m. On the other hand, Mr.D doesn’t have a big swings of productivity during the day. His peak during working hours is at noon. It looks like he doesn’t have a regular lunch break and when his co-workers and external contacts start to lose concentration in the afternoon, he has another peak of activity around 5 p.m.. Additionally, Mr. D seldom sends any emails after 8 p.m.
PATTERN RECOGNITION : SUM OF MR.D SENT AND RECEIVED EMAILS PER week days and months (2014)
If we are analysing Mr.D’s behavioral patterns on a week’s scale we can find out that he is even working much more than his professional circles during the weekend as well. It looks like his only time out of emails is every saturday during lunch time around noon.
That is Mr.D’s average behavior, but what is even more important to our analysis are the anomalies in his behavior. Anomalies can point to many things. People are changing their behaviour when depressed, sick, working under pressure, when there are some deadlines or important events, when they are traveling or when they fall in love, for example.
ANOMALY detection : number of MR.D sent emails per hour (2014)
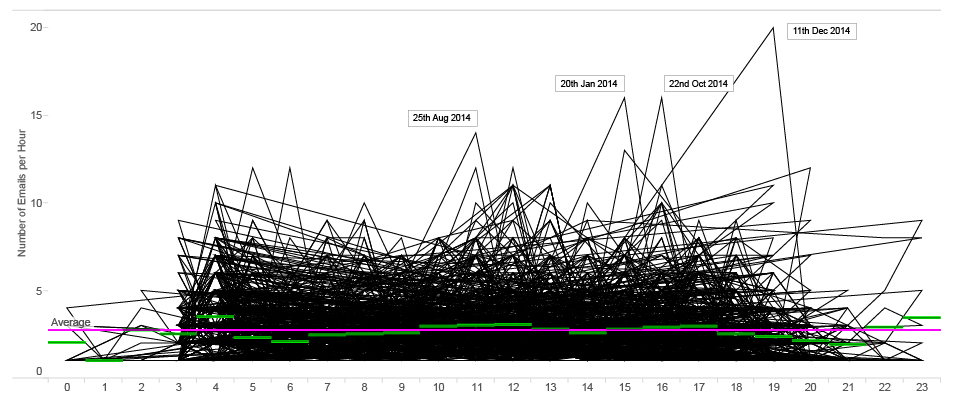
On this graph we can see some spikes that represent anomalies in Mr.D’s productivity.
For example, on the 11th of December at 7 p.m., he sent 19 emails during one hour compared to average 2.7 emails that he usually sends.
The following heatmap is probably most effective for spotting anomalies.
pattern RECOGNITION and ANOMALY DETECTION : heat-map of mr.d sent emails per hour (2014)
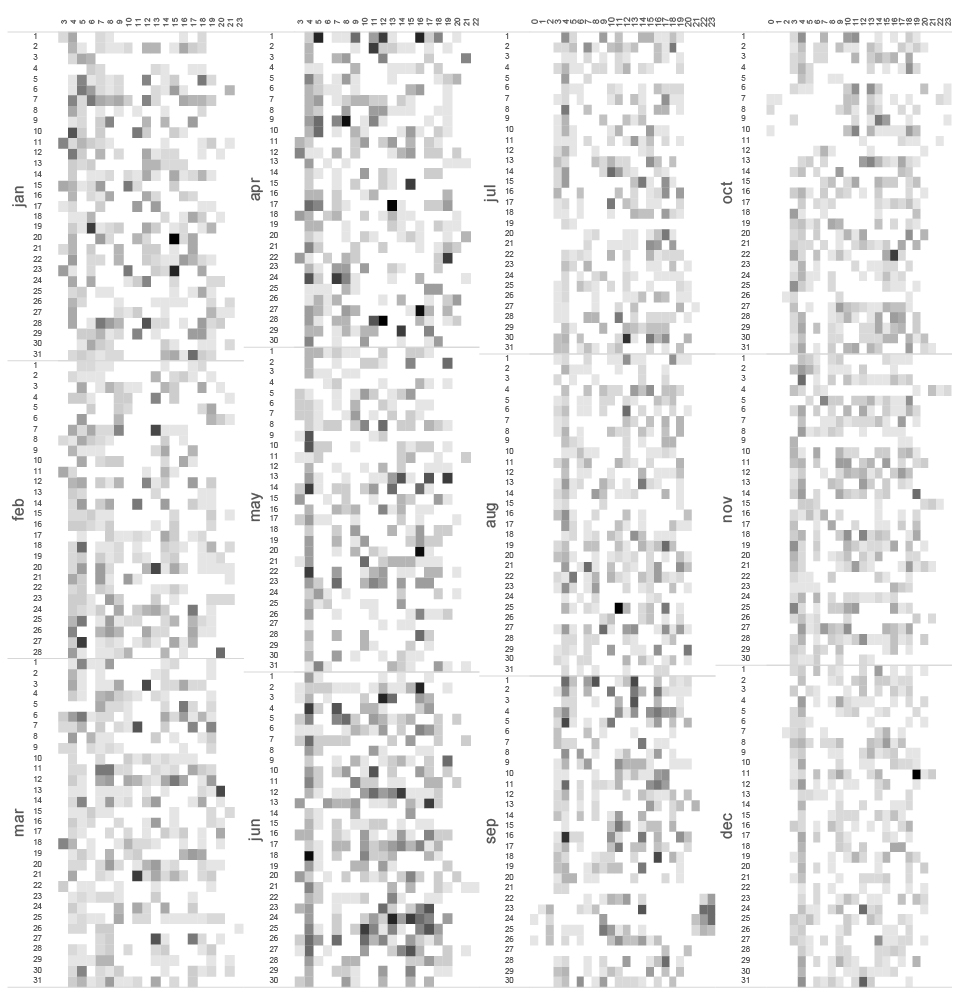
Looking at the heatmap, you can spot an interesting anomaly in September. On the 20th in the afternoon we see a really low level of activity, which is unusual for Mr.D, giving that we already know that his daily productive peak is around noon.
Further, on September 21st from 4 a.m, when he generally wakes up and starts work, there is no activity until the day after at 7 a.m.
In the next few days we see that the pattern is uncommon. It looks as if Mr.D sleeps in the afternoon and works intensively during the night. On September 27th, we can see again a lack of communication and then in the following days, Mr. D’s pattern is back to normal. Based on the other metadata inputs that we will explain later in our research, we found out that Mr.D was traveling to Singapore between the 21st and the 27th of September. With that we can easily conclude that a change in the time zone influences Mr.D’s email pattern.
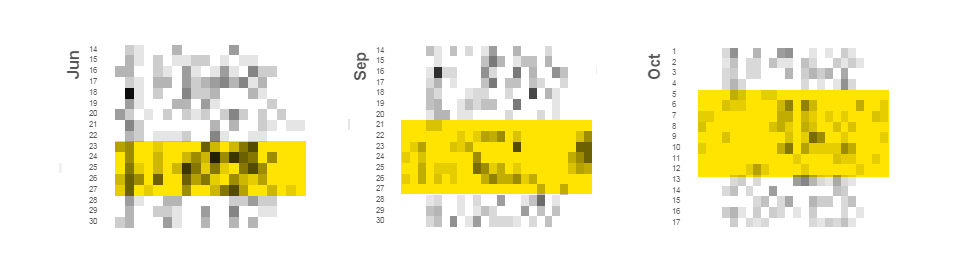
We can find another anomaly in the pattern from October 5th to October 12th, but this pattern looks a bit different, it swings in another direction. On this occasion Mr.D went to the USA and it showed us how different time zones leave different footprints in his pattern.
There is also one really interesting pattern anomaly on June the 24th and the following day (you can see darker squares and an increased level of communication). On that day, researchers from Citizens Lab published analysis “Police Story: Hacking Team’s Government Surveillance Malware” exposing the functionality and architecture of Hacking Team’s Remote Control System (RCS) in a never-before published detail. This report had a great media coverage, including media such as The Economist, Associated Press, Wired, VICE, International Business Times, Forbes and others. We can see how this stressful event for Hacking Team reflects on the pattern of Mr.D’s emails.
Mysteries of the Subject
Aside from the defined activity patterns and discovered anomalies, email subjects also reveal a very detailed overview of Mr.D’s communication with other employees of Hacking Team.
timeline of emails sent from mr.d to individual ht EMPLOYEES in 2014 ( hover on graph for subject line )
TOOL : TABLEAU
Just to make a short but interesting digression: while creating this graph of email subjects we stumbled upon the moment A.Pelliccione left Hacking Team in March 2014. At this moment his communication with Mr. D stops. Based on the IP location data that we will present later, we also found out that he moved to Malta and started communicating through a different email address – reaqta.com.
We can argue whether the email subject should be considered metadata or not. However, looking from a technical point of view, the subject is a part of the header in the same way as other types of information (From, To, Date, etc.). Basically, it’s just a matter of choice of the person who is to analyse the metadata. For the intents and purposes of our research, we will consider the subject a legitimate source for metadata analysis.
timeline of subject lines ( 2014 )
TOOL : TABLEAU
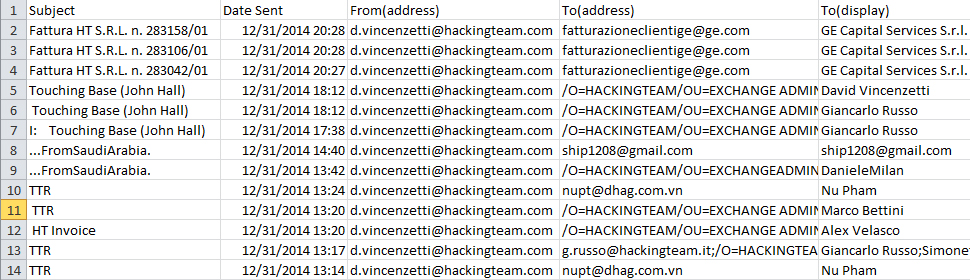
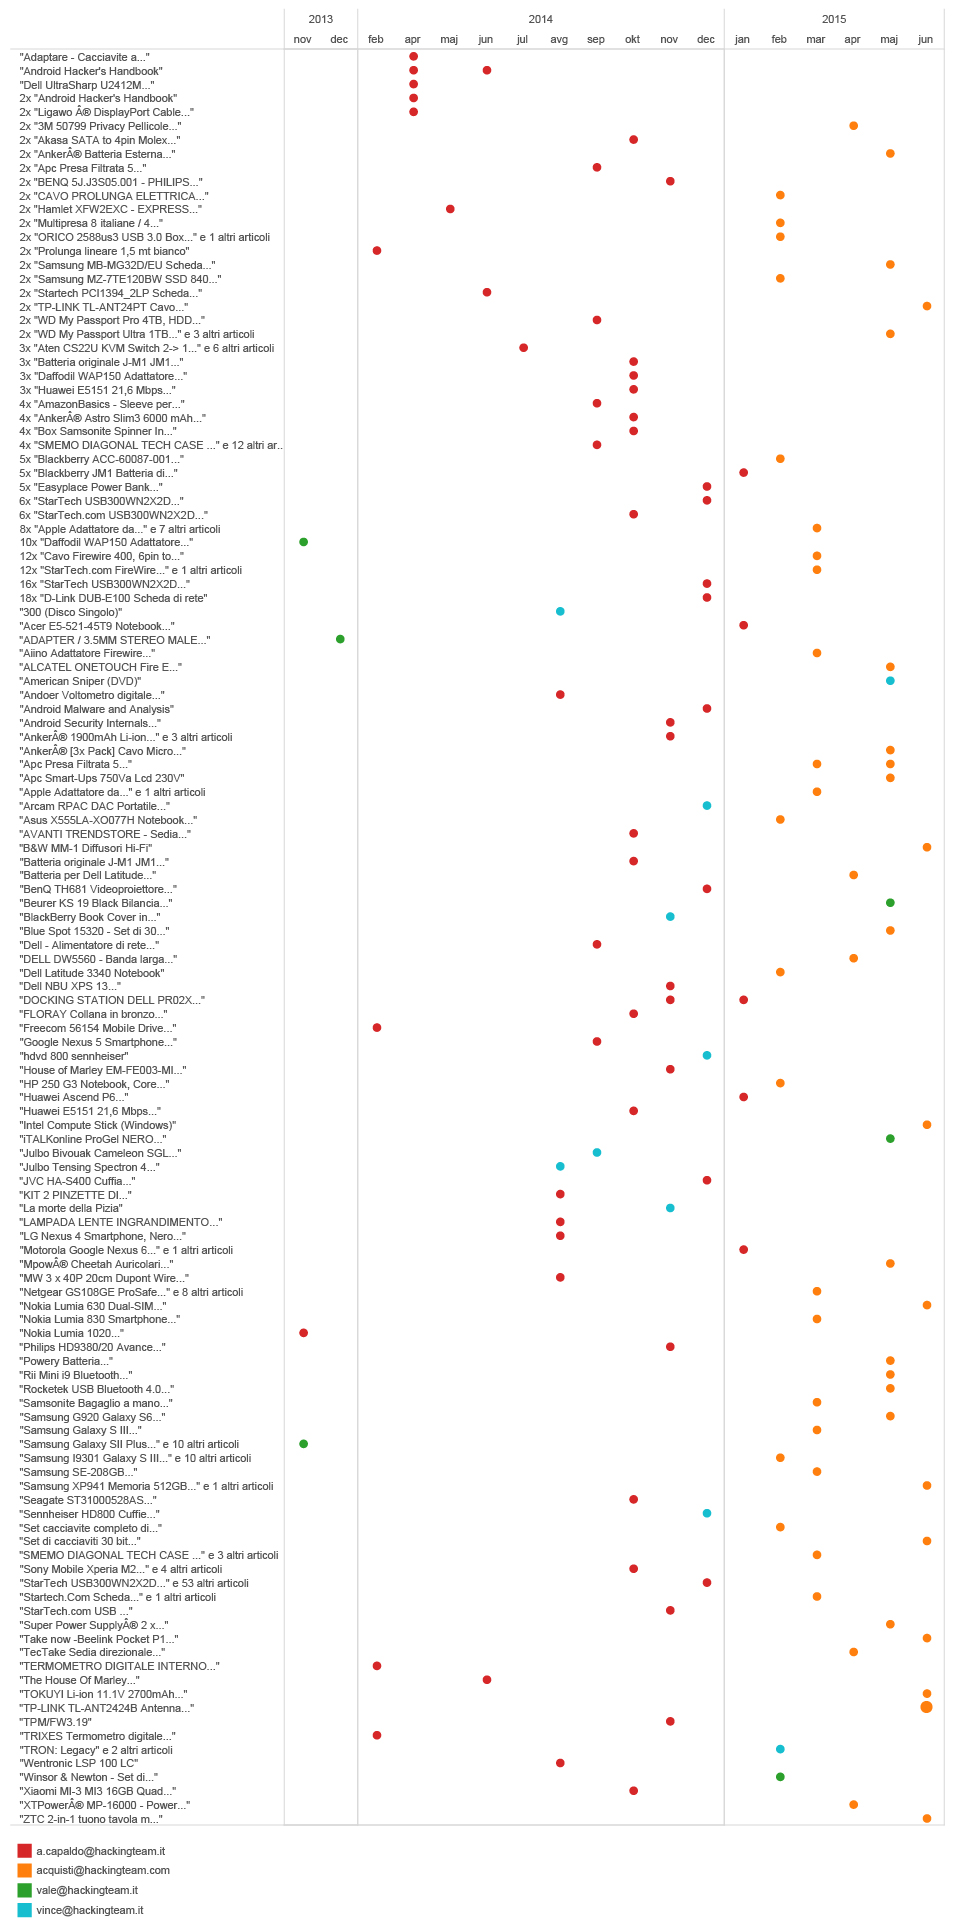
Getting back to email subjects, they can sometimes give us some really amusing information. For instance, many companies such as Amazon, list the ordered items in the subject of a Confirmation email you receive after your payment has been processed.
By extracting the emails sent by Amazon to Hacking Team employees, we were able to get an insight into their purchases.
timeline of emails with subjects from amazon.it
But there are some more extreme examples.
If we look at the treemap of Hacking Team partners, there is a company called Carlson Wagonit Travel. According to the company’s website, they deliver solutions for business travel, meetings and events management. For HT they arrange and buy plane tickets, book hotels and provide travel assistance. They have one bad habit (which is quite common for many booking agencies), every time an airplane ticket is booked, the agency would send an email with name and airport codes, contained in the subject line, to the prospective passenger. Extracting that information from the subject and cross-referencing with the date the email was sent, we are able to get an approximate information about the journeys of HT employees.
The list of Hacking Team frequent flyers and locations they visit looks like this.
map of ht employees flights based on cwt emails subject lines
TOOL : TABLEAU
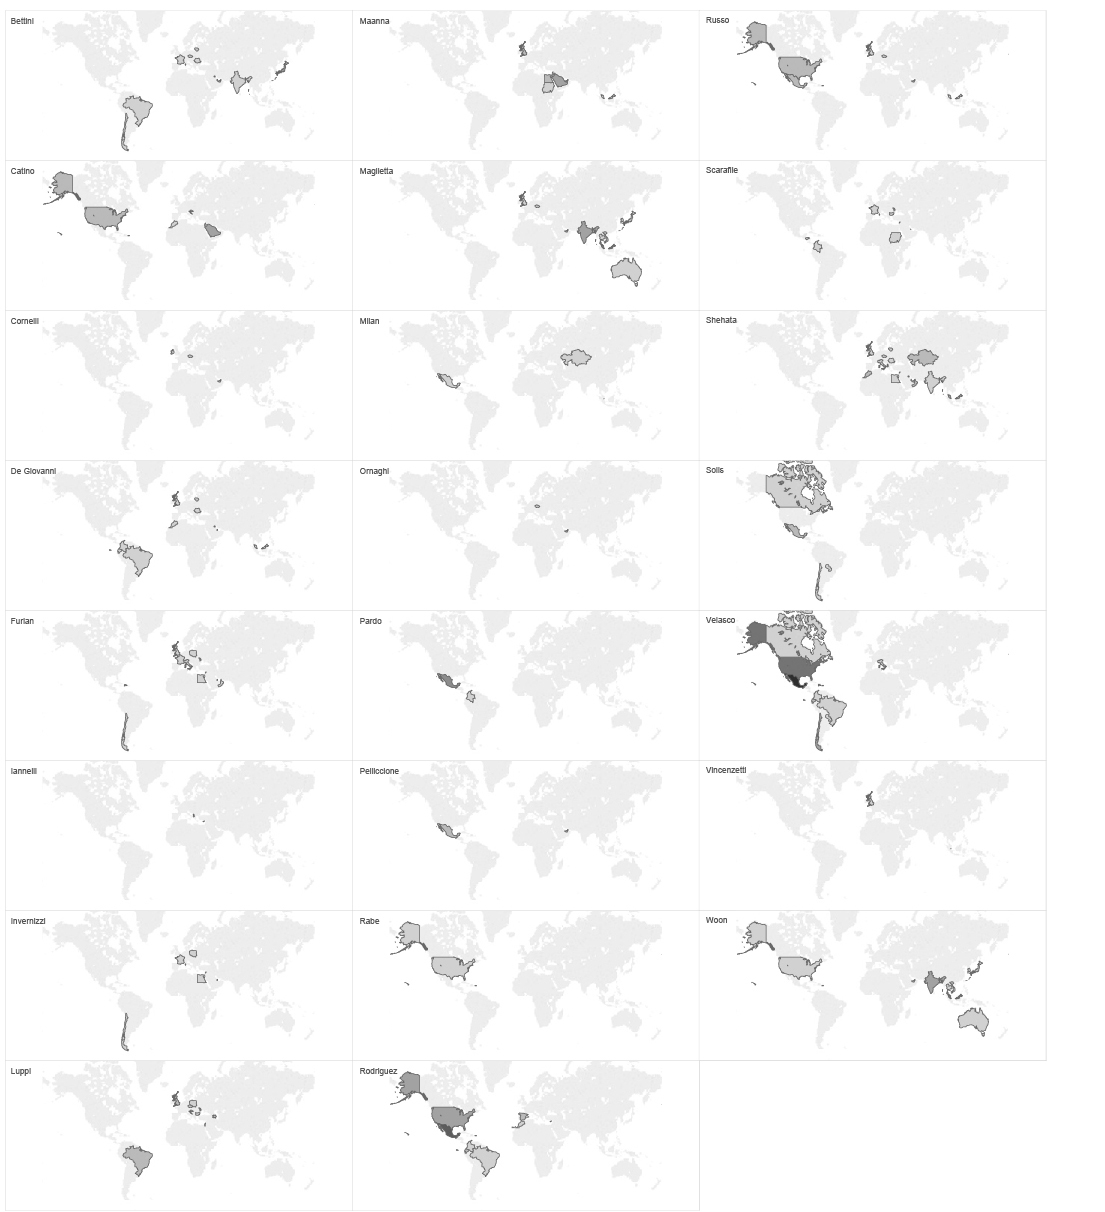
These data give some interesting information related to our assumption of how the organisational structure of Hacking Team looks like. If we go back to our organisational structure graph based on social network analysis and compare with this list of frequent flyers, we can see that the most frequent flyers are not very high in the hierarchy according to our network graph. However, if we group the flights by passenger’s name, we realise that each of the most frequent flyers is based in a certain place, and covers a certain region/market, such as SE Asia, Middle East, South America etc. Conclusion that we can get from this is that those employees are responsible for certain markets or regional Hacking team offices around the world.
individual ht employees flights map based ON CWT EMAILS SUBJECT LINES
If we regroup the same set of data, by location, we can see at which point in time and where two or more Hacking Team employees have met or have traveled together. This implies potential business meetings, sales of surveillance tools, establishing new relations with international customers and government agencies around the globe.
timeline of INDIVIDUAL HT EMPLOYEES FLIGHTS to different countries BASED ON CWT EMAILS SUBJECT LINES
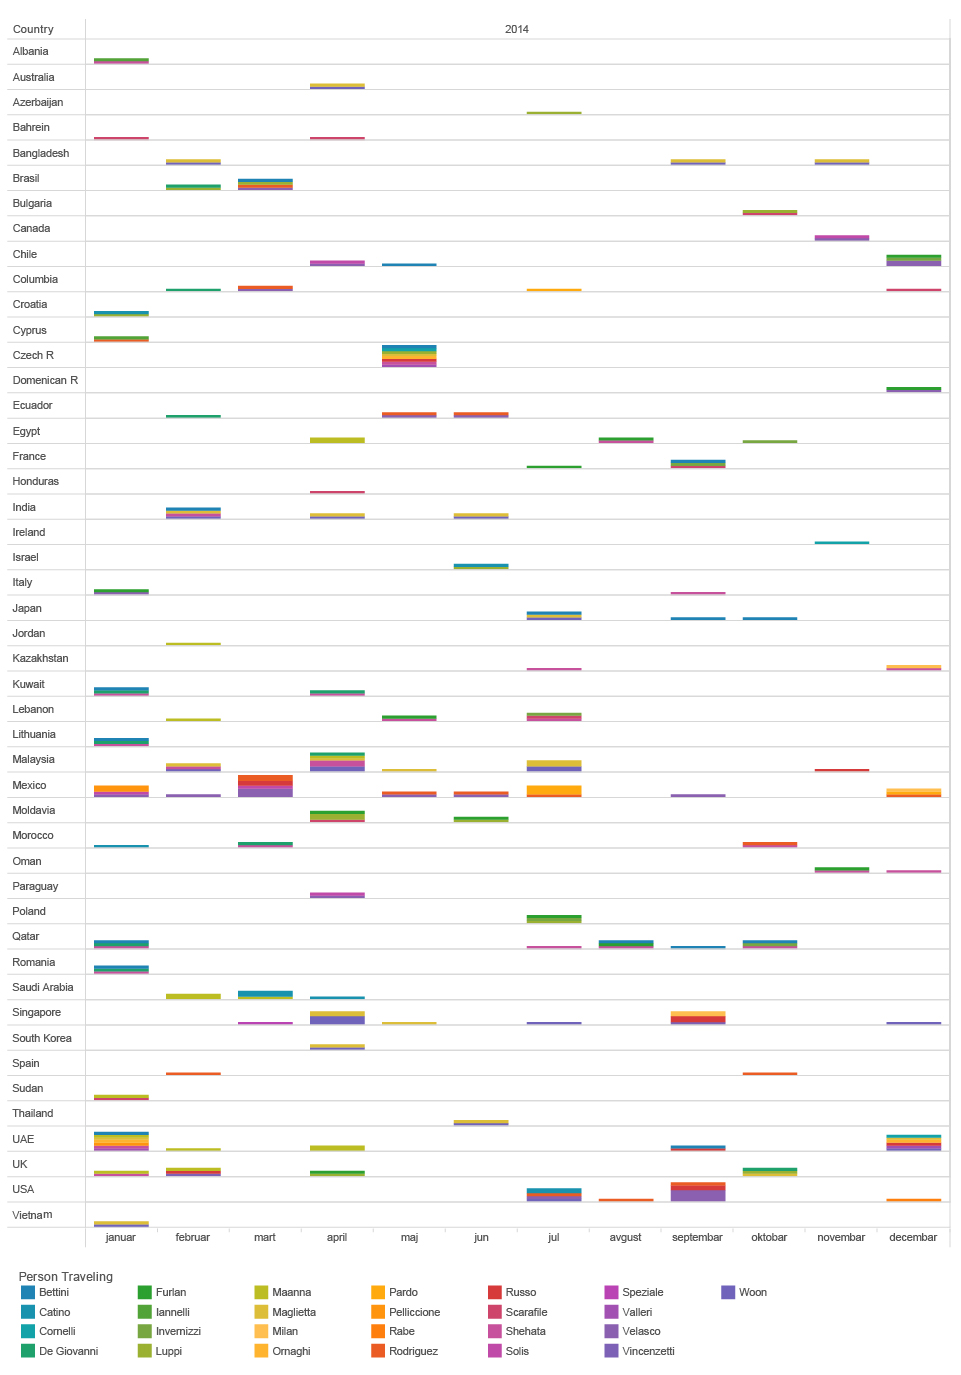
TOOL : TABLEAU
Homing pigeon
The email header hides one even more precise location information. In some cases, the email headers reveal the IP address of the sender. The IP address can then be geolocated, using some publicly available tools, to the level of a city or individual router. In the context of our investigation, this allows us to trace every one of Mr.D’s contacts. Every time someone sends an email to Mr.D, that person basically reveals their location to us. Just by analysing the metadata of Mr.D’s received emails we can get information where the senders are located, when they changed city or country.
This allowed us to locate even more precisely in time all employees of Hacking Team.
timeline of hT employees ip locations based on emails received by mr.d (2014-2015)
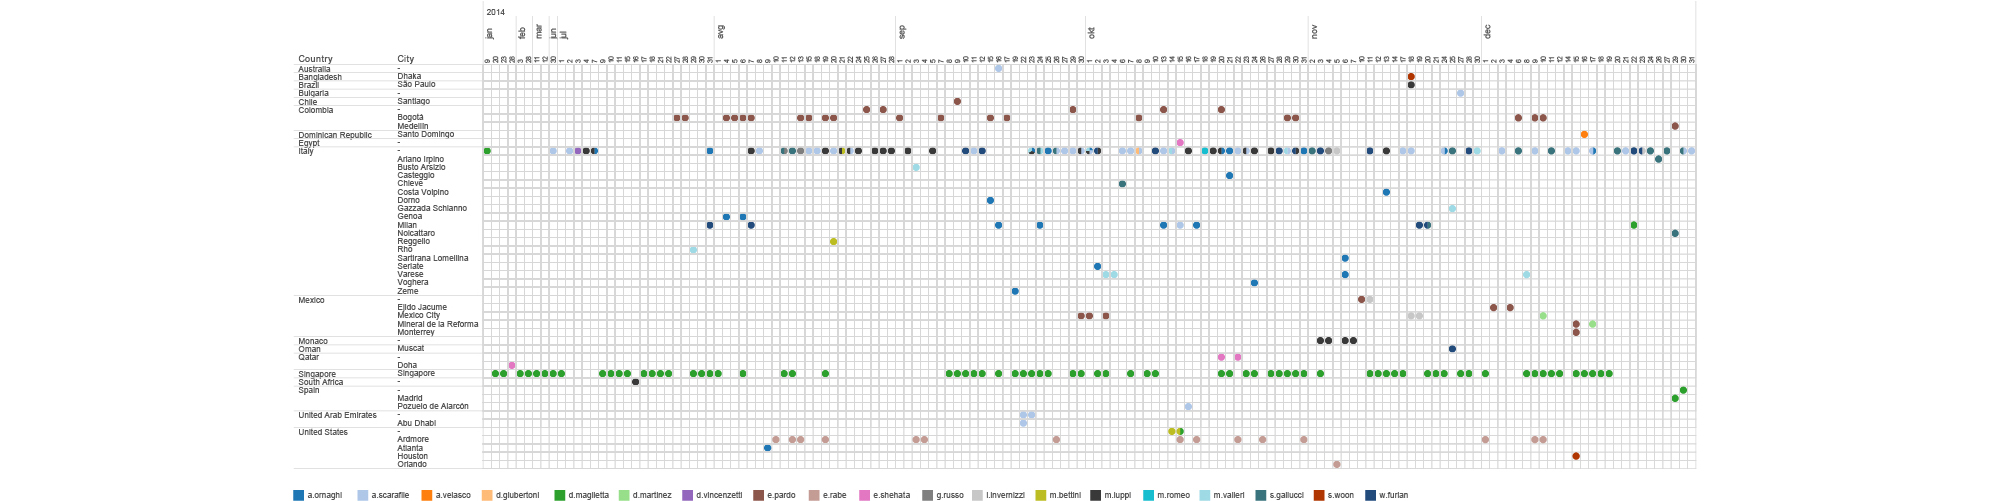
We can see for example, that most of the employees are located in Italy, but there are some of them being situated in different places around the world.
D.Maglietta is for example head of their office in Singapore but he spends Christmas in Spain. E.Pardo is in Bogota, Colombia most of the time and he had a visit from another HT employee A.Scarafile on January 14th. We can see how E.Shehata jumps around the Middle East visiting Qatar, Lebanon, United Arab Emirates, Egypt and Jordan. E. Rabe is situated in Ardmore, PA, USA but moved on February 14th to another suburb of Philadelphia. And finally, even though HT claims to have an office in Washington DC, based on metadata we didn’t find any evidence that would support that.
On a World map, the distribution of their locations looks like this.
map OF HT EMPLOYEES IP LOCATIONS BASED ON EMAILS RECEIVED BY MR.D (2014-2015)
TOOL : TABLEAU
Locations of the external contacts of Mr.D give us a real insight into their global operations.
MAP OF external contacts IP LOCATIONS BASED ON EMAILS RECEIVED BY MR.D (2014-2015)
TOOL : TABLEAU
This tiny piece of information allows us to explore individual contacts in each country, to find their main partners, even to track locations of their contacts in time.
MAP OF EXTERNAL CONTACTS IP LOCATIONS ( ZOOM or move map to explore other regions )
TOOL : TABLEAU
It’s Just Metadata
More often than not, the power of metadata is being taken naively or its potential usage is being oversimplified in comparison with the content of our communication. But we see that even our not very sophisticated, DIY methods, enabled us to create a deep and clear image of someone’s habits and activities, using information extracted from ‘only’ email metadata. Although our investigation primarily discovered relations, patterns and anomalies of someone’s work life, it still gave us an insight into that person’s habits that border with private life. In the end, metadata scans someone’s behaviors on a much deeper level than traditional surveillance practice related to content could ever do.
At moments, while conducting this investigation, it certainly felt as if we were peeking into the deepest corners of someone’s life. What felt even more disturbing is the idea that our subjects of analysis are probably less aware of their behavioral patterns that we are. It’s just metadata, and in our case just one little segment of it. This is why our research provoked an internal debate within our team on the ethical issues of this kind of practice and on the form in which the findings of this research should be published. On numerous occasions, supporters of NSA surveillance programs, claimed that collecting and analysis of metadata is not surveillance. According to our data exploration, we can claim that it can be even more intrusive than regular content surveillance.
Who has access to metadata?
Understanding who has access to metadata and the possibility to analyse it will give us an answer to the question of the new power structures and distribution of wealth in the information society.
Companies
The first and obvious group are the companies that provide services such as Google or Facebook. They don’t just have access to the metadata, they have actual data and content on their servers. Quality, variety and amount of metadata that for example Google owns about every user of his services, stored in gigantic datacentres are unprecedented MONOPOLIES OF COLLECTIVE DATA. Through their core business models they are pioneers of metadata exploitation. It could even be said that the first data centre setup by Google in 1998 can be considered the milestone of the birth of the metadata society.
The first and obvious group are the companies that provide services such as Google or Facebook. They don’t just have access to the metadata, they have actual data and content on their servers. Quality, variety and amount of metadata that for example Google owns about every user of his services, stored in gigantic datacentres are unprecedented MONOPOLIES OF COLLECTIVE DATA. Through their core business models they are pioneers of metadata exploitation. It could even be said that the first data centre setup by Google in 1998 can be considered the milestone of the birth of the metadata society.
INFRASTRUCTURE
The second group with access to metadata is related to the the internet’s infrastructure. Those are Internet service providers, mobile service providers, Internet exchange points and submarine optic cables and they can access data when it flows through their cables, routers and servers. The quality of metadata that they can collect depends on the endpoints attached to the infrastructure, but in any case they have access to the basic metadata of the internet packets. Even though the content of, say, emails, is supposedly encrypted (at least when using these mainstream services), the metadata is not, because the email architecture simply has to rely on metadata that are readable, as explained before.
The second group with access to metadata is related to the the internet’s infrastructure. Those are Internet service providers, mobile service providers, Internet exchange points and submarine optic cables and they can access data when it flows through their cables, routers and servers. The quality of metadata that they can collect depends on the endpoints attached to the infrastructure, but in any case they have access to the basic metadata of the internet packets. Even though the content of, say, emails, is supposedly encrypted (at least when using these mainstream services), the metadata is not, because the email architecture simply has to rely on metadata that are readable, as explained before.
GOVERNMENT
National Laws in most cases give the Government or some of the Agencies thereof a legitimate access to users’ data, including email and other metadata. Internet infrastructure owners or companies that provide services are obliged to cooperate with Governments whose jurisdiction they are under. They often comply with Government requests and have different forms of technical cooperations. However, in many countries Government agencies have invested in developing programs for mass surveillance of citizens based on collecting metadata. These programs often rely on software that creates and exploits backdoors (as is Hacking Team’s case) or use some other creative way to get access to metadata.
National Laws in most cases give the Government or some of the Agencies thereof a legitimate access to users’ data, including email and other metadata. Internet infrastructure owners or companies that provide services are obliged to cooperate with Governments whose jurisdiction they are under. They often comply with Government requests and have different forms of technical cooperations. However, in many countries Government agencies have invested in developing programs for mass surveillance of citizens based on collecting metadata. These programs often rely on software that creates and exploits backdoors (as is Hacking Team’s case) or use some other creative way to get access to metadata.
Those are the hunters, hoarders and scavengers in the ecosystem of the metadata society, but there are some smaller species worth mentioning as well. Metadata is often a resource for different businesses based on data collection and analysis in the field of digital marketing, business analytics or scientific research. You can even be a subject of surveillance in your work environment. The company you work for could perform metadata analysis of your productivity, anomalies in your behavior during work time and analysis of your contacts. To name an example, this kind of internal company surveillance service is provided by one of the Hacking Team main partners – Nice, mentioned earlier in this text.
Understanding the power of metadata brings us closer to understanding the algorithmic governmentality as a concept and practice. The quality of metadata is that it is really easy to process and it can be done by machines and algorithms. In the eye of the algorithm, we are observed through our profiles, sets of behavioral patterns and anomalies extracted from our metadata. Automatic processing and algorithmic analysis of those data in real time leads to the world in which algorithms can decide whether we are terrorists or regular citizens, are we suitable for a loan in the bank, an insurance policy, or who is going to appear in our social stream. Algorithms can eventually predict our future behaviour based on our past metadata, bringing us closer to the concept of pre-crime, the tendency in criminal justice systems to focus on crimes not yet committed.
We are not going to conclude anything about Hacking Team’s activities, because that was never the goal of our research. We wanted to understand, hands-on, through research and practice how metadata analysis can be performed and what we can learn from it. We hope that researchers and investigative journalists can use our data and exploration for their own research and that they will be able to find new connections and leads based on metadata.
Contributors
Vladan Joler – concept, research, data analysis, data visualization, text
Andrej Petrovski – data mining and processing, text
Nikola Kotur – data processing and development
Tamara Pavlovic – editing and proofreading
Jan Krasni – peer review
More about Share Lab you can find here
For any question, raw data for research, or anything else, please contact us on info.at.shareconference.net
]]>
At least one Serbian security service negotiated the purchase, while the Ministry of Defense comes up as a trial user of the spy software made by Hacking Team (HT), a company from Milan whose electronic databases were made publicly available last week by Anonymous and Wikileaks.
Not long after the Italian company’s Twitter account had been compromised, more than 400 gigabytes of data were published, including internal documents, client lists as well as source code.
Huge HT databases are still in the initial phase of analysis by experts, journalists and activists around the world. Share Foundation team singled out a company correspondence related to Serbia, in which members of the Security Information Agency (SIA) and the Ministry of Defense have participated, along with a private company located in New Belgrade.
The negotiations lasted until the end of 2011, partly with mediating services from a private company for trade and manufacturing of computer equipment “Teri Engineering“ from New Belgrade, whose CEO arranged meetings, software testing and negotiated the price. In an internal discussion, this Belgrade company was mentioned as a “player” which could introduce the spy software manufacturers “to the whole central Europe”.
According to the available information. the first contact from Serbia was established after the international exhibition of internal security equipment MiliPol Paris 2011, when a member of the Security Information Agency (SIA) contacted a branch of Hacking Team, asking if a presentation of HT software in Belgrade could be arranged.
SIA and Hacking Team
The software is known as the Remote Control System, RCS, based on the targeted spreading of viruses on computers and mobile phones of persons under surveillance. Most clients using this system are states and security services from across the world.
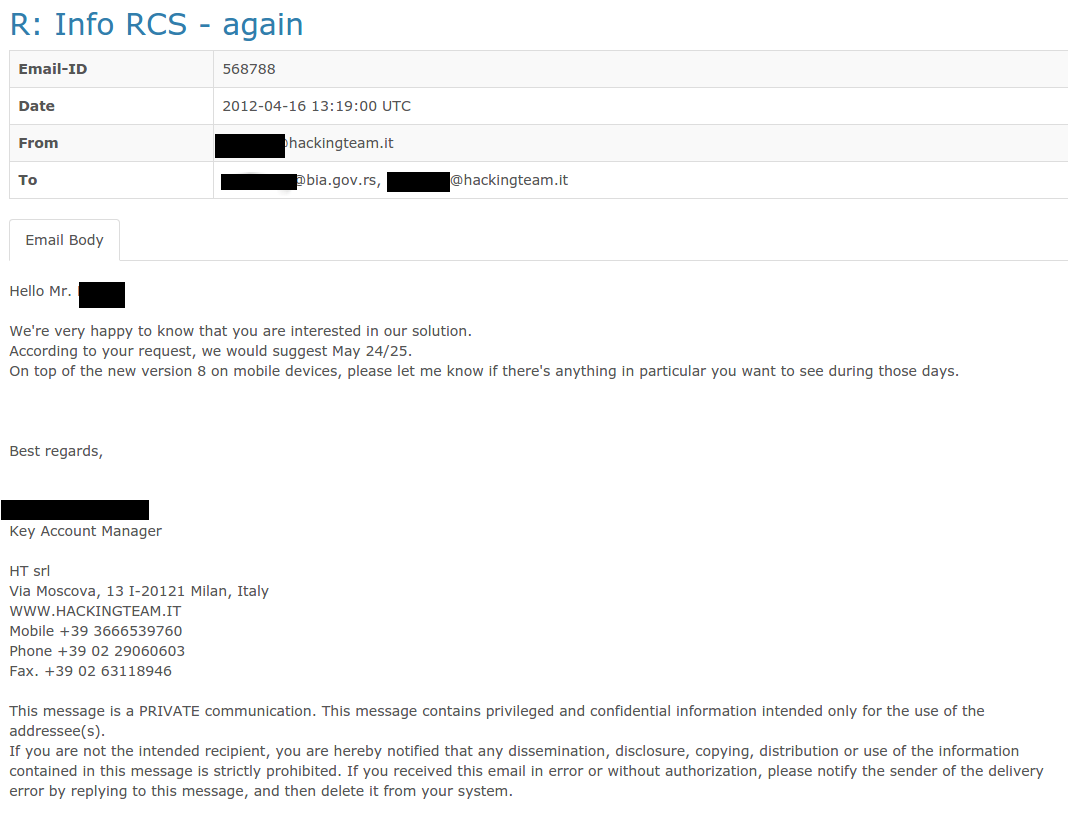
The initial presentation in Belgrade surely took place, but the correspondence dies down until April 2012, when the same SIA member addresses the HT manager, who will notify him that the new version of the software will be available in May and that they could meet at the end of that month.
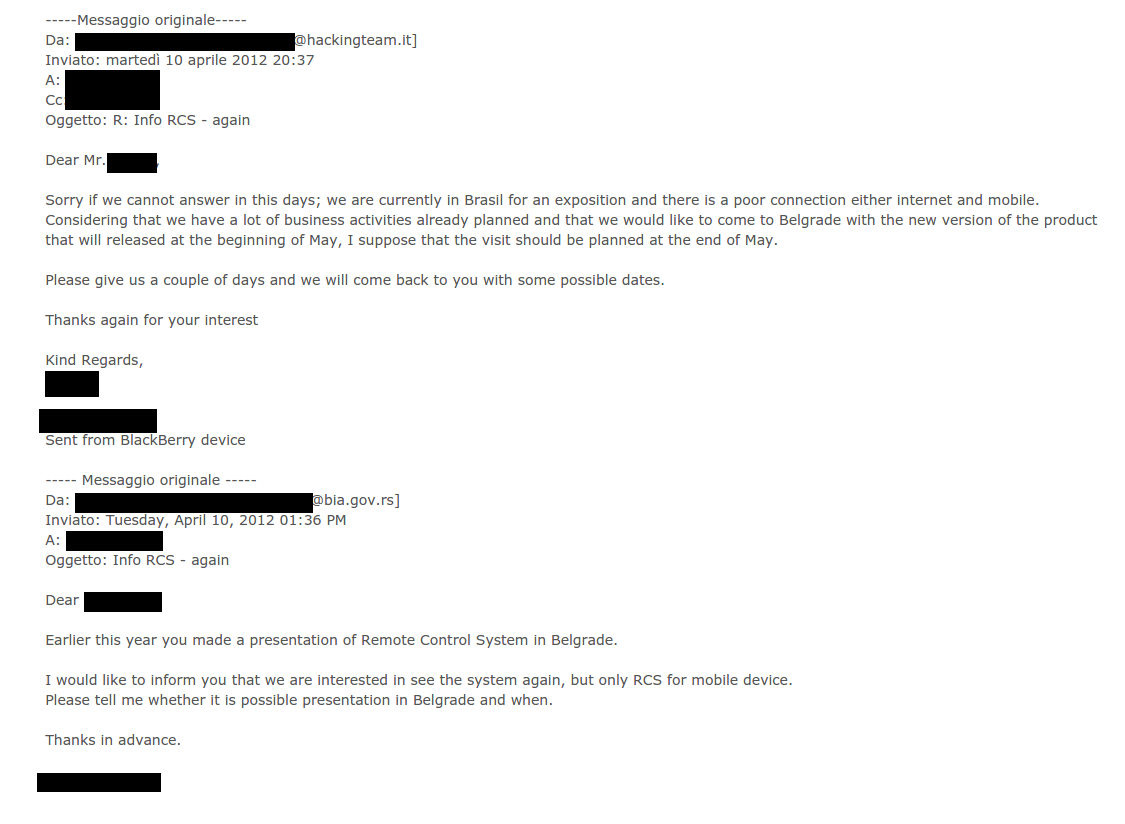
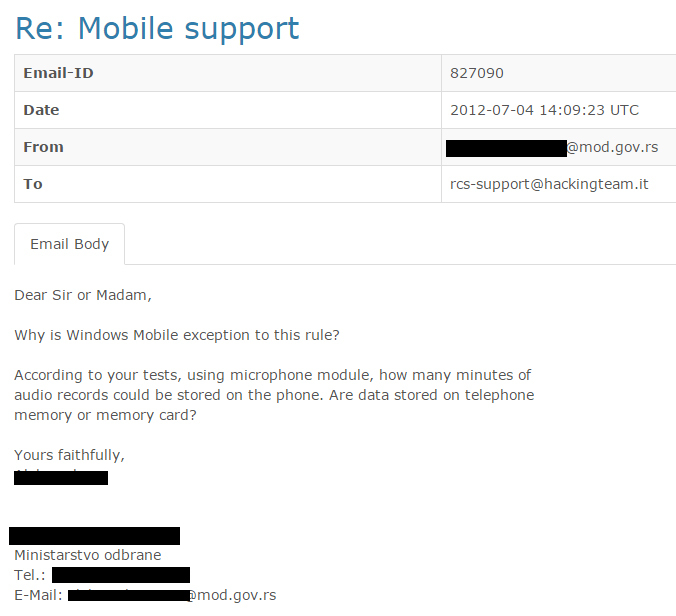
In the internal correspondence of the HT manager regarding the planned presentation in SIA Headquarters in Belgrade on 24 and 25 May 2012 it is noted that the SIA was “already introduced to the software in their Headquarters in the beginning of the year and a month ago in Rome”. It is stated that the SIA is now calling them to test only the software for mobile device surveillance. One of the HT representatives communicating with the Serbian security service member is mentioned in “Spyfiles 3”, a Wikileaks database with information related to many global manufacturers and vendors of spy equipment and software.
MSA searching for the spy virus
Independently of the communication with the Security Information Agency, at the same time the CEO of “Teri Engineering”, a private company from Belgrade, addresses the Hacking Team managers, with a recommendation (and a percentage for closing the deal) from Nice Systems, an Israeli company specialised in electronic surveillance and data analysis. In the correspondence, the intermediary from Belgrade lists MSA which is an abbreviation for Military Security Agency (“VBA” in Serbian) as a possible client, and offers local implementation services.
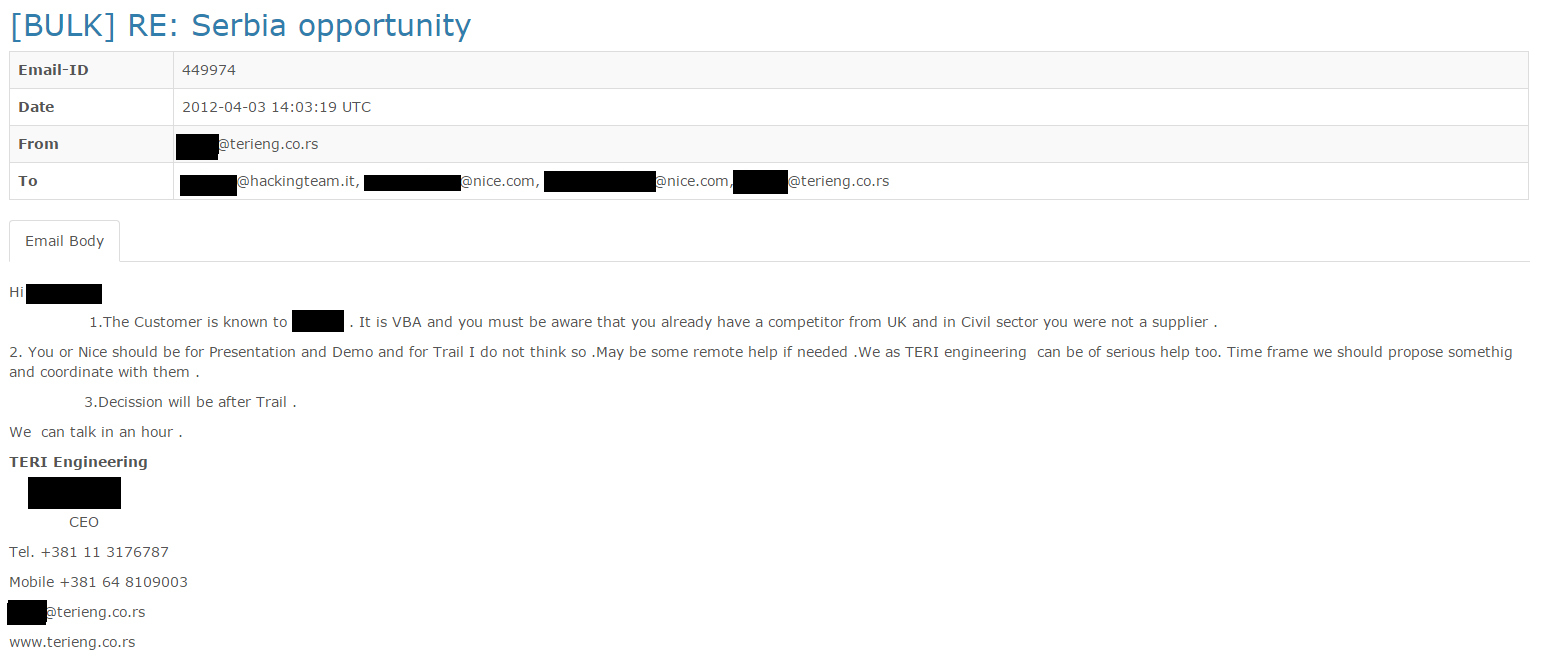
The negotiations begin in April, a month before the parliamentary elections of 2012, and the intermediary from Serbia insist that the presentation is held as soon as possible. From the emails it could be understood that the presentation was held shortly afterwards, and that the client from Serbia (MSA) received the system for a trial.
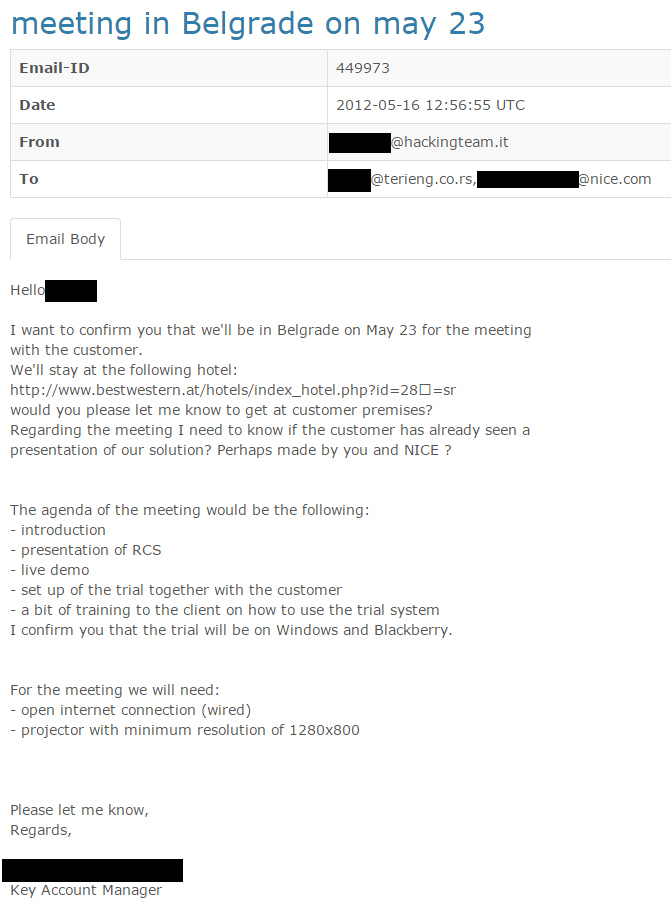
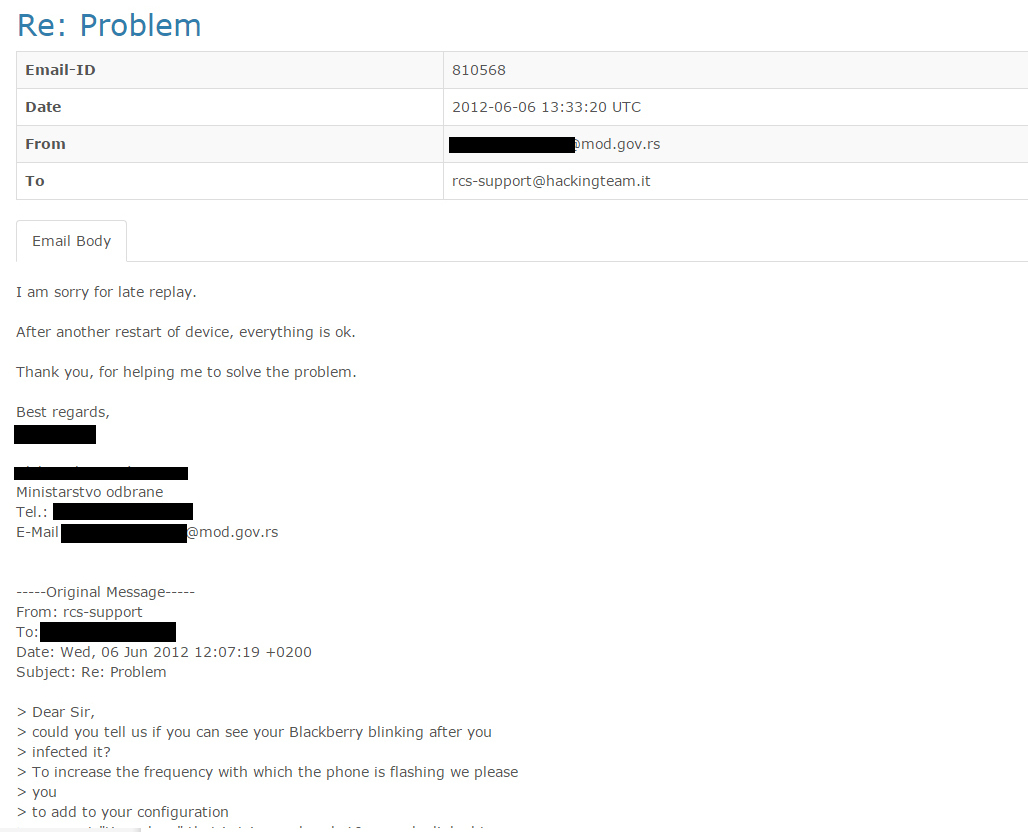
Negotiations on price soon followed, and the intermediary – despite the hefty commission for her company and the partners from Israel – managed to significantly lower the price from close to 500.000 euros to around a half of that amount. A person with an email address on the Ministry of Defense domain participated in the correspondence regarding the technical details of activating the virus and using the infected phone.
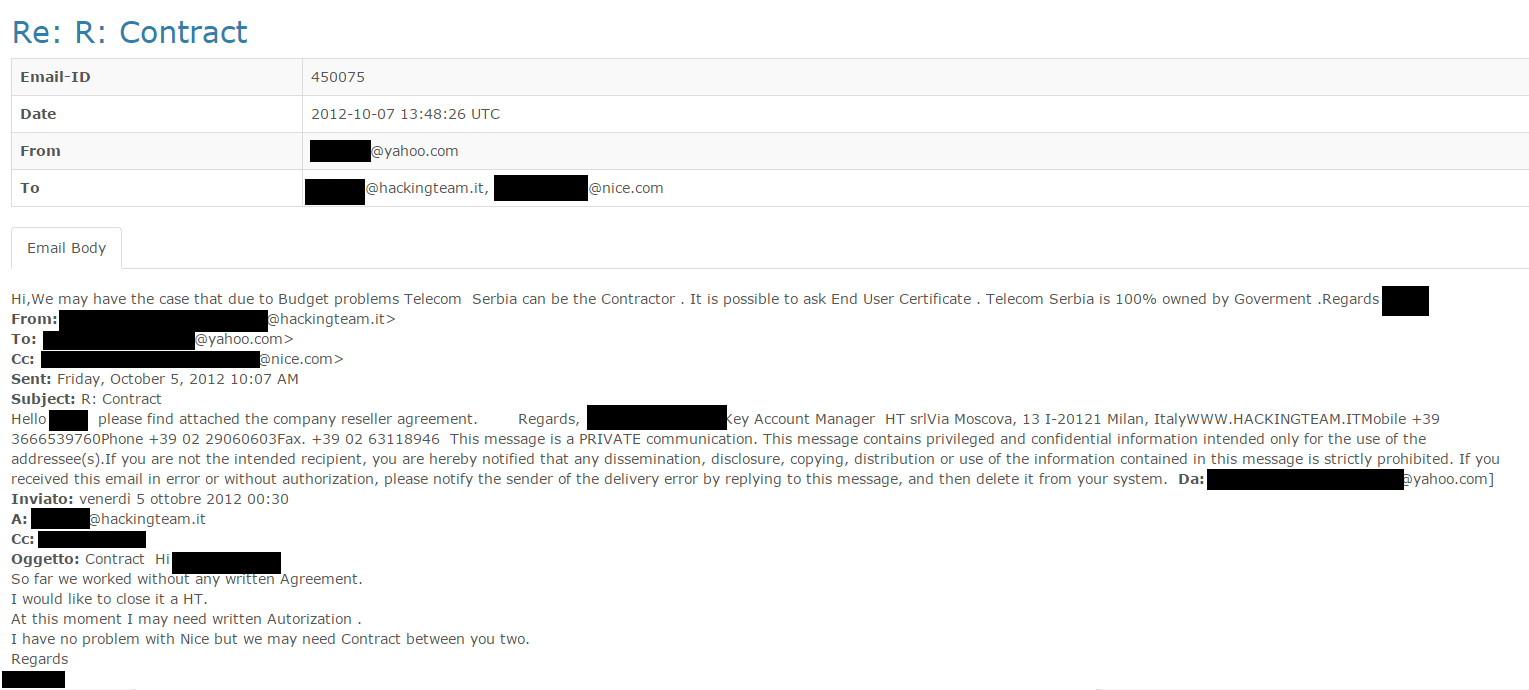
In late fall 2012, CEO of “Teri Engineering“ from Belgrade notified HT that because of possible “problems with the budget”, the procuring entity (instead of MSA/Ministry of Defense) could be Telecom Serbia, “100% state-owned company”.
Same year in September, after the trial was finished, the intermediary from Belgrade told the HT representatives that their system had a problem “which does not exist with the competitors”. It was Gamma, a company from London, whose software FinSpy, as it is known, soon found its buyer in Serbia.

Communication continued at the start of 2014, when there is a news from Belgrade that the budget for this deal was finally adopted, but negotiations stumble because of the price. Another obstacle were the parliamentary elections (March 2014) and the expected changes in the Ministry of Defense and security agencies, with new personnel appointments awaiting.
Hacking Team tried to arrange another presentation in Belgrade, aiming to divert their potential client from the competition. At that moment however, the competing spy software is already in Serbia.
In May last year, the communication from Belgrade totally dies down.
How do the agencies monitor infected devices
Until now, several ways how the Hacking Team’s system uses exploits in targets (e.g. devices) were identified. It is an advanced graphical interface in which most operations are performed with a single click. With the system, buyers also receive an instruction manual how to execute different types of infections, physically and on the internet.
The most common way of infecting targeted devices via the internet is to send infected documents (.doc files) by email, which when saved automatically start downloading spyware in the background and install a “backdoor” on the infected device, therefore implementing HT spyware.
In the control panel, there is a list of all infected devices, with their maximum number depending on the specific product. It is important to note that every system is tailor-made and that the price of the system depends on its functions, supported devices (PC, Mac, BlackBerry, mobile devices) and operating systems (Windows, Linux, OS X).
Primary use of this software is to monitor the system on which the spyware is implemented and not be recognised by the anti-virus program, which is why it is necessary to update the system regularly, so the price of yearly maintenance is 20% of the total value of the licence (75.000 €).

As part of its server, Hacking Team also had a KnowledgeBase, where it was described in detail which data from which devices and operating systems can be extracted. There are also instruction how to infect devices, as well as analysis of different anti-malware software.

For technical support, user would open a ticket on Hacking Team’s website and then their team would do a reconstruction of the problem in a laboratory and found a solution, which can be another reason why the maintenance price is relatively high.
Users of RCS software are mostly governments or government agencies. The system works on the basis of proxy servers which “launder” the traffic through several countries, so it is virtually impossible to technically determine who performs surveillance and where is the surveilling operator located.
During the past several years, Hacking Team, a manufacturer of surveillance software and equipment, has been targeted by civic organisations because of its active role in the global development of the surveillance industry without civilian control, as well as selling the software to countries known for heavy human rights abuses, even when it represents a violation of UN sanctions, in case of Sudan.
Hacking Team was a key actor in the research carried out by CitizenLab at the start of last year, because of the sale of RCS to various governments. Their product was used for tracking the award-winning Moroccan news portal “Mamfakinch“ in 2012, as well as human rights activists from the United Arab Emirates.
Last year, Privacy International warned of the possibility that this company had received million and a half euros from funds connected to the Region of Lombardy in 2007. From the leaked financial databases it can be seen that Mexico, Italy and Morocco are the biggest Hacking Team clients, with “orders” valued at several million euros in total.
Share Foundation wrote about the legal framework for import of this kind of software in Serbia back in 2013 because of the “Trovicor” case, stating that rules for dual use goods must be applied and that a permit from the Ministry of Trade, Tourism and Telecommunications is obligatory. In October 2014, the European Commission updated the list of dual use goods, inter alia because of the need to control IT intrusion software (‘spyware’) and telecommunication and internet surveillance equipment. In accordance with this, the Government of the Republic of Serbia has also adopted aDecision in May 2015 to fully comply the national control list of dual use goods with the European Commission’s list.
On the other hand, use of equipment such as the one being sold by Hacking Team is not explicitly prescribed as a measure that state bodies can use. If we assume that certain organisations can be authorised to use this equipment, in our legal system that wouldn’t be possible without a court decision in accordance with the law. Using it in any other way would be an obvious violation of human rights which are guaranteed by the Constitution of the Republic of Serbia and numerous international conventions.