One of the reasons we seldom discuss the issues of this invisible infrastructure is the fact that the speed of the packets traveling through the network is so big and unnoticeable to us, in most cases we don’t feel a significant difference in whether our packets are traveling just around the corner or to around the world and back.
The fact that we are not able to perceive this difference does not change the fact that those packets, during just a little fragment of a second, travel through thousands of kilometers of cables, myriad of routers and switches, different national territories and a number of potential spots where they can be retained, slowed down, stored, copied or examined.
Unlike the telephone network, which for many years was a monopoly run by a single company in most countries, the global Internet consists of tens of thousands of interconnected networks run by telecommunication companies, Internet service providers, individual companies, universities, governments, and others 1 . Those entities have different legal regimes, business and technical relationships, privacy policies and ownership models. Even our most frequent and most sensitive communication relies on those entities. But even so, in most cases, our knowledge of how those networks are interconnected and how they deal with our data is left in the dark.
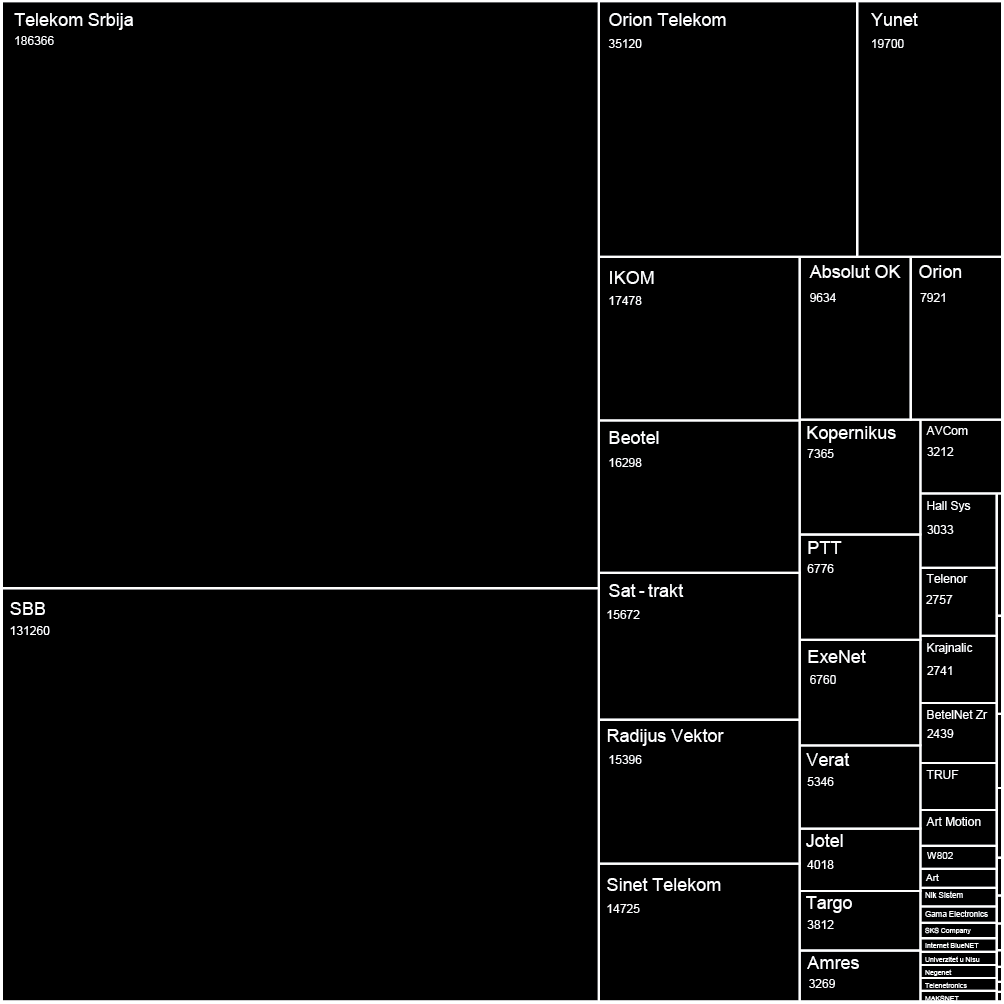
Our first step of understanding this invisible network is to try to understand the structure of our nearest network, network runed and owned by our Internet service provider. Every ISP is a story for itself, they have a different number of users, a different number of interconnected routers organized in different structures.
Every device that is connected to the Internet (your computer, routers, servers) have an IP address. The IP address is a logical Internet Protocol address which allows data to flow over the Internet. IANA (Internet Assigned Numbers Authority) through the RIRs (Regional Internet Registries2) assigns the ranges of IP addresses to entities interested to buy them, and they keep a database of which range belongs to whom and other data, including which range is assigned to which country . So, every ISP has a limited and defined range of IP addresses that they further assign to their users and infrastructure that they own.
This set, range of all IP addresses that one ISP owns, was the starting point of our research.
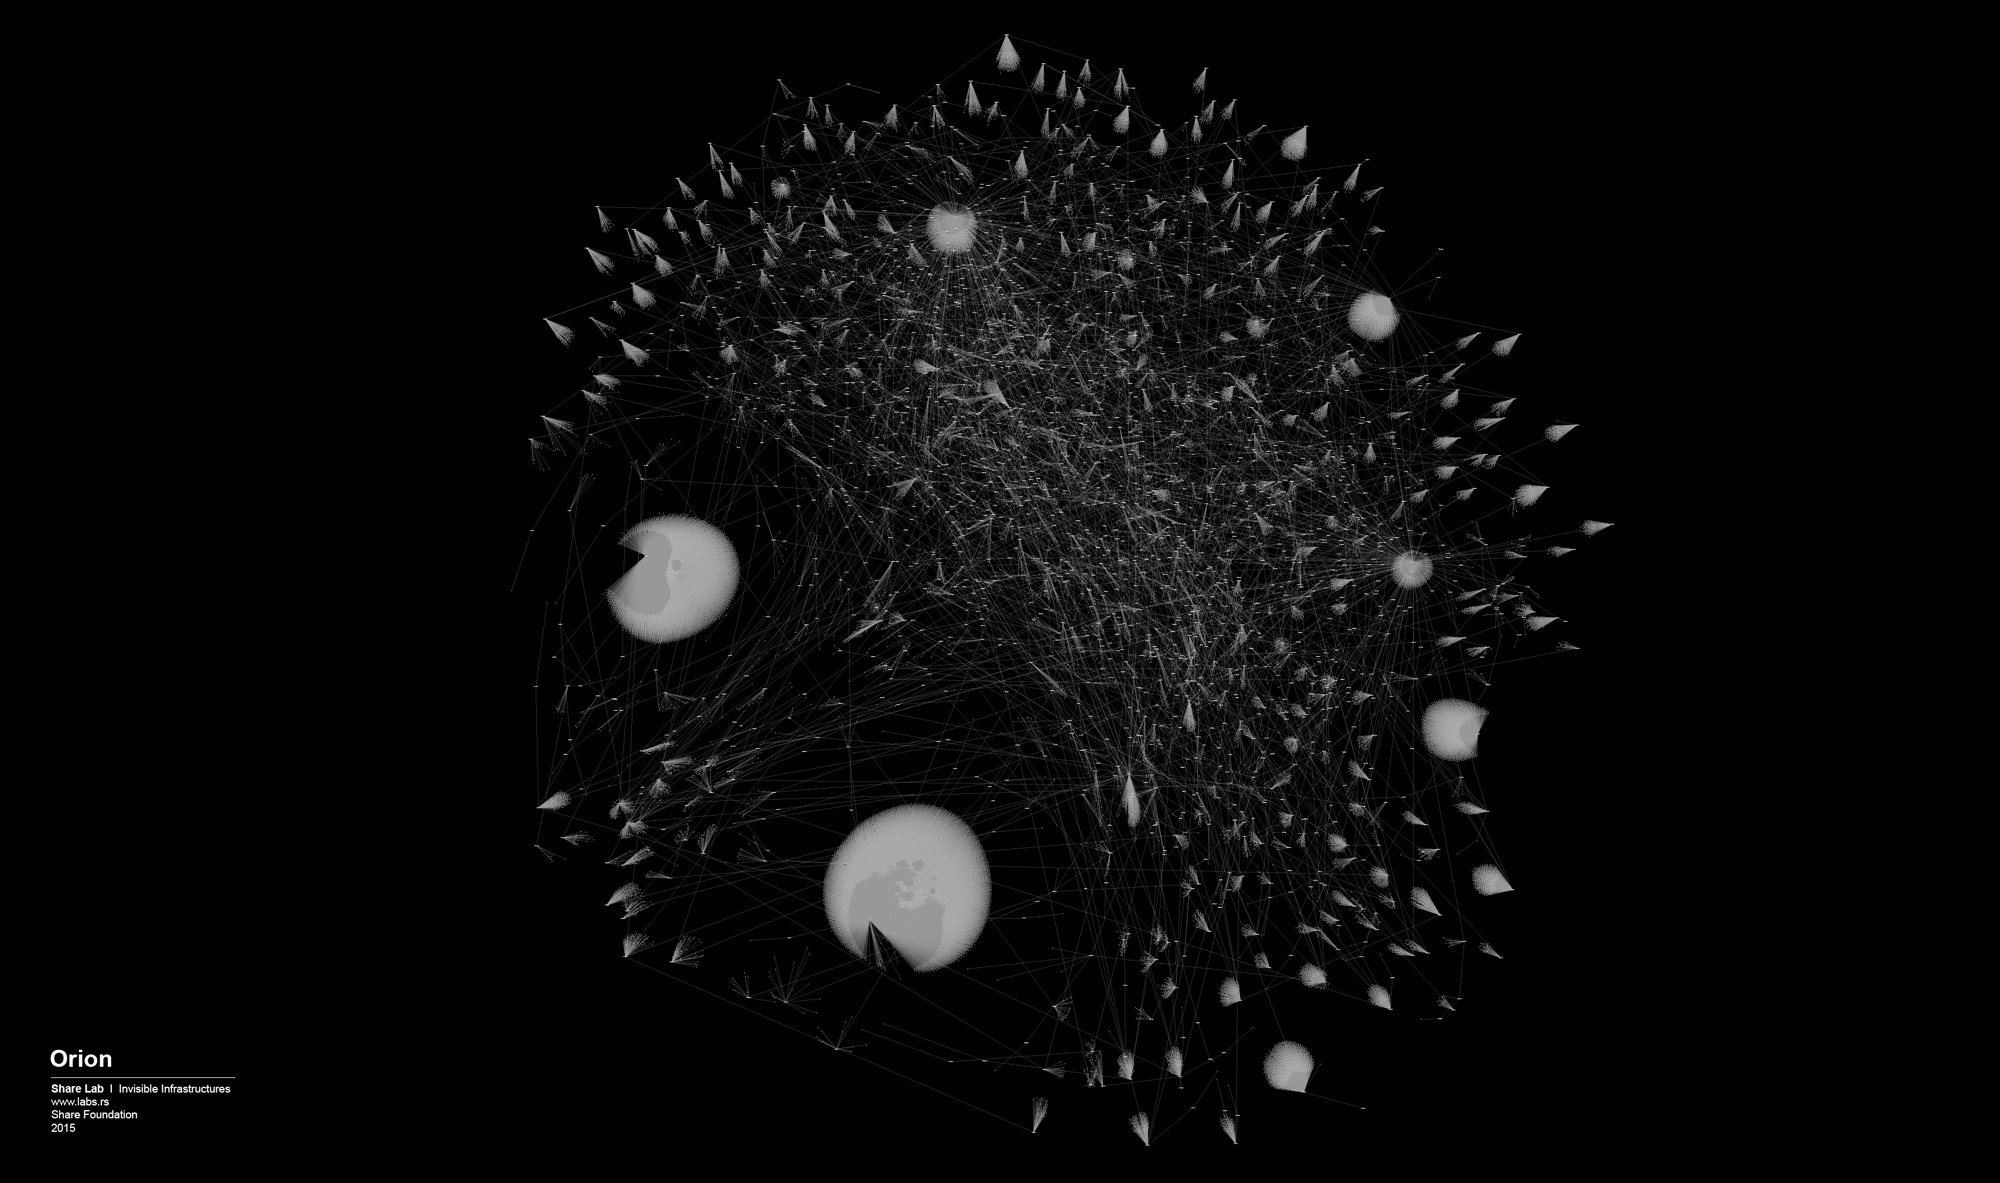
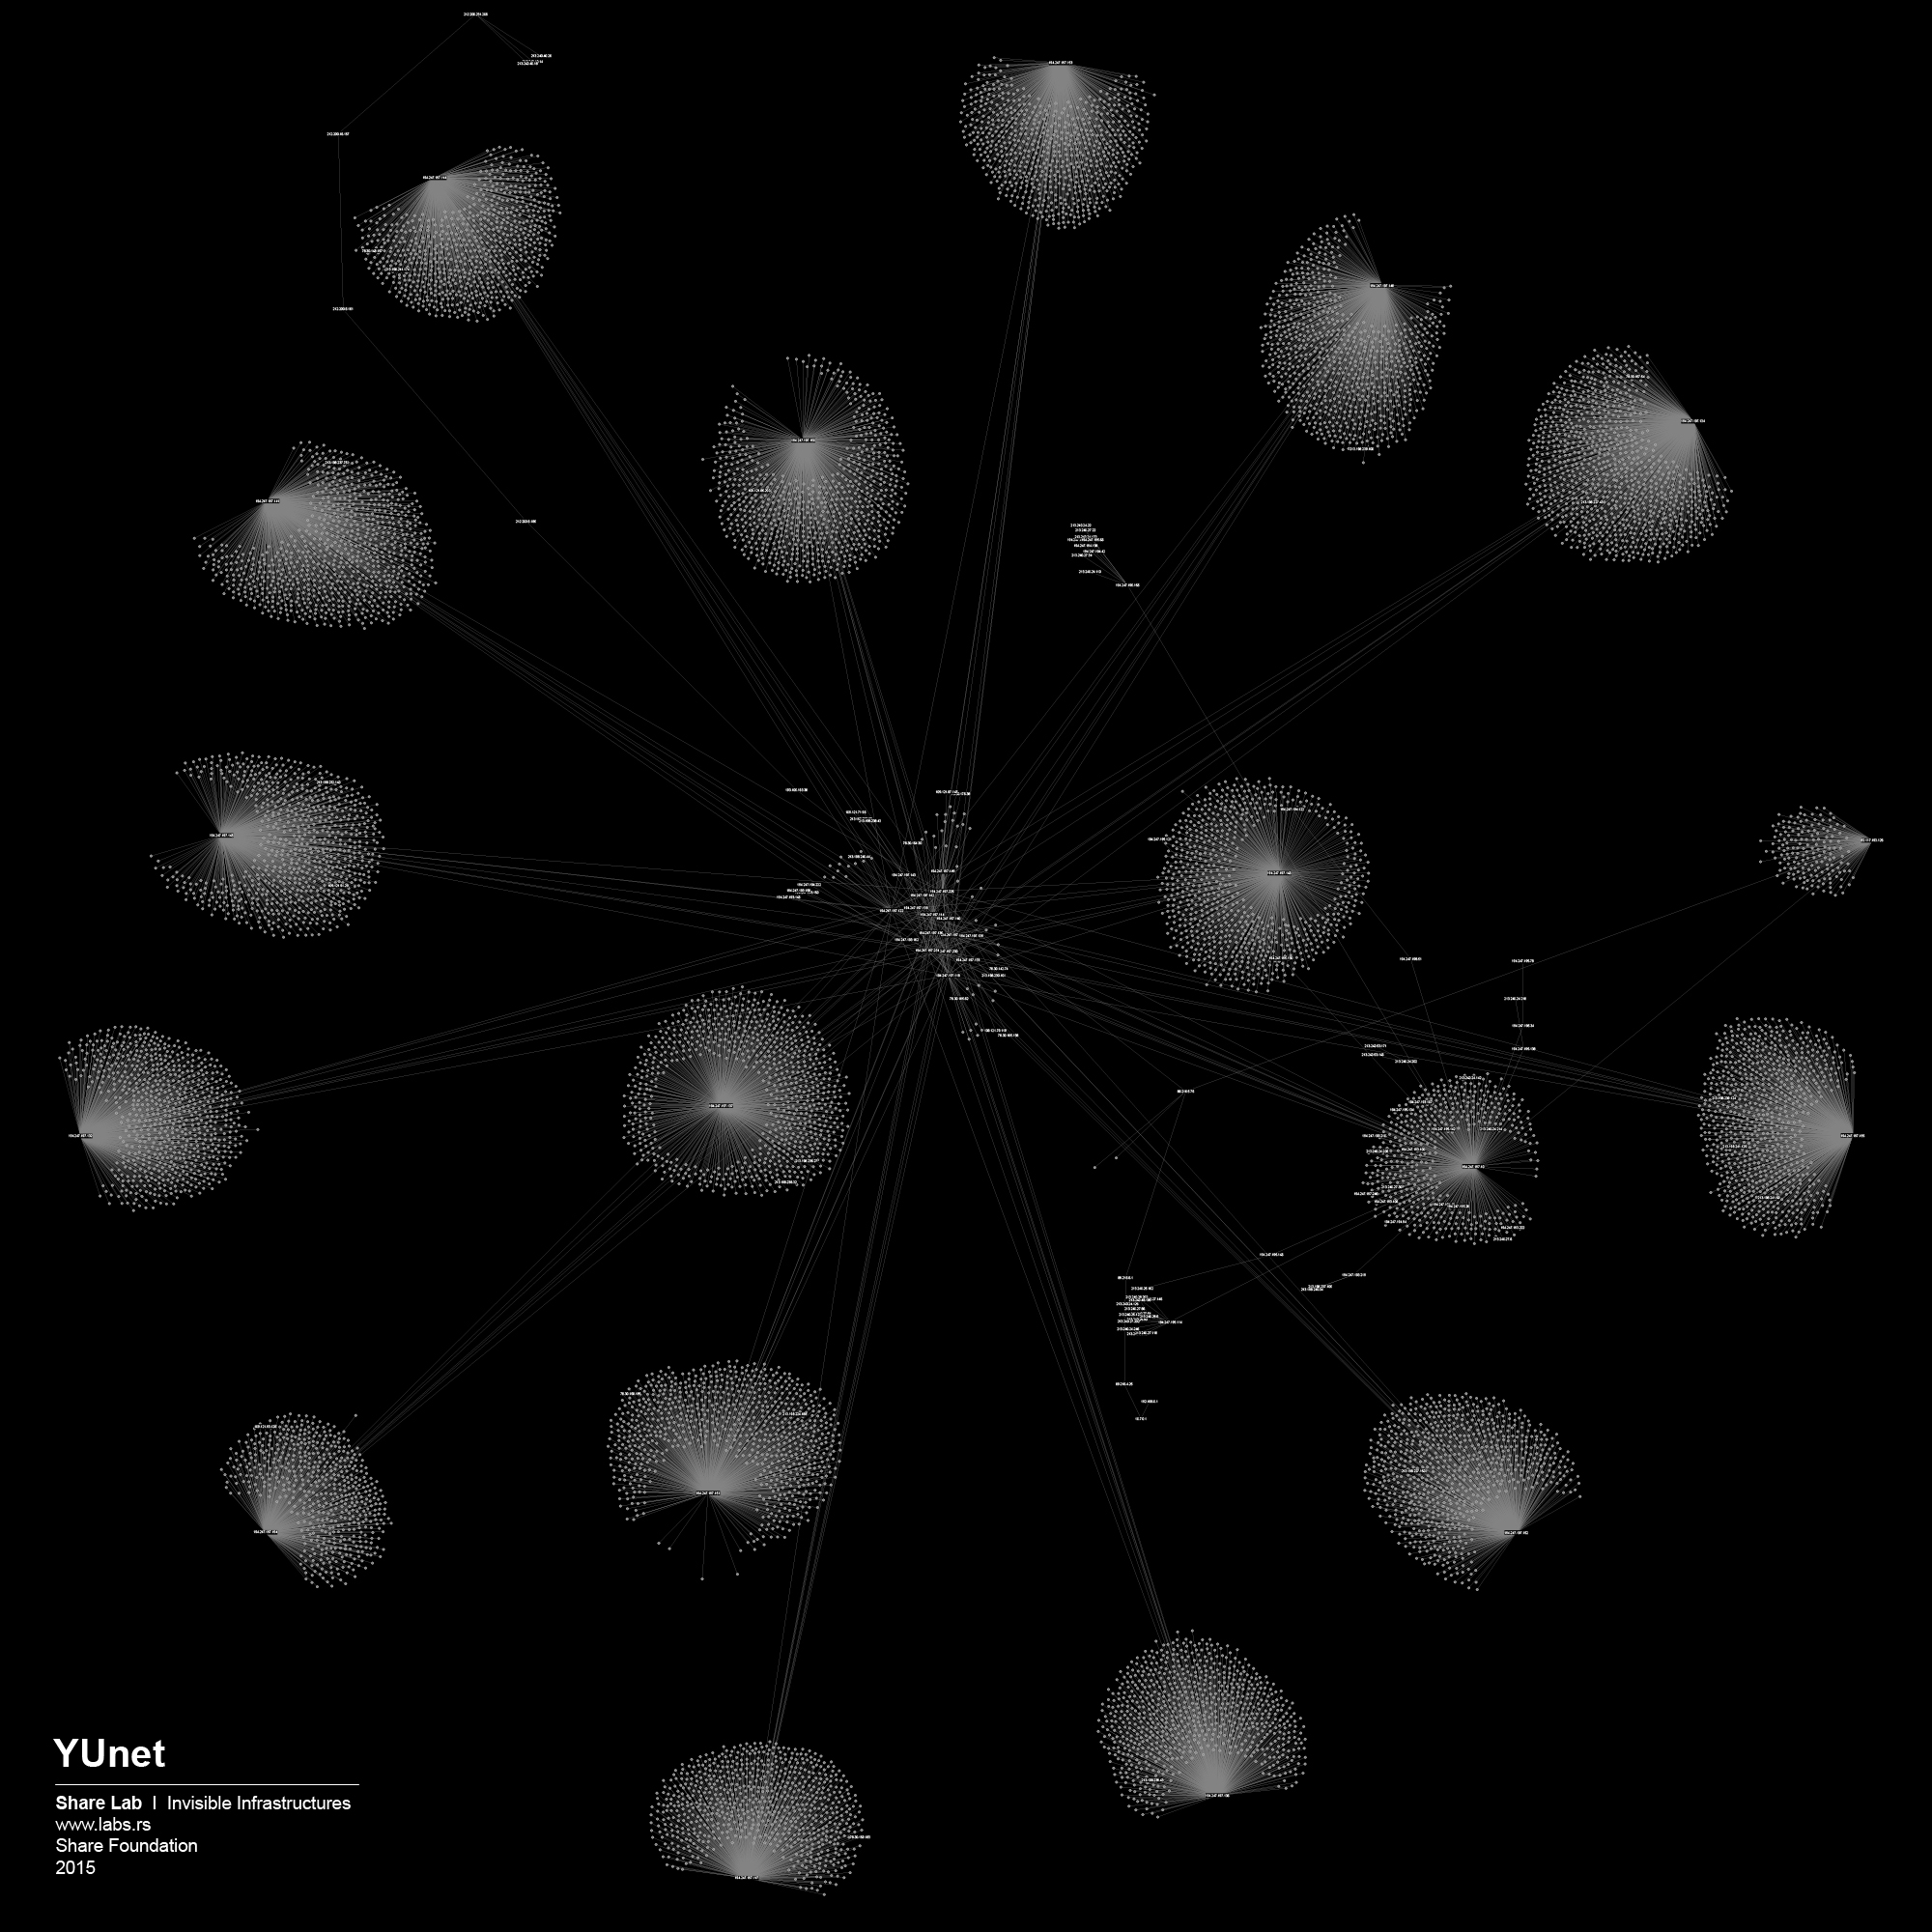
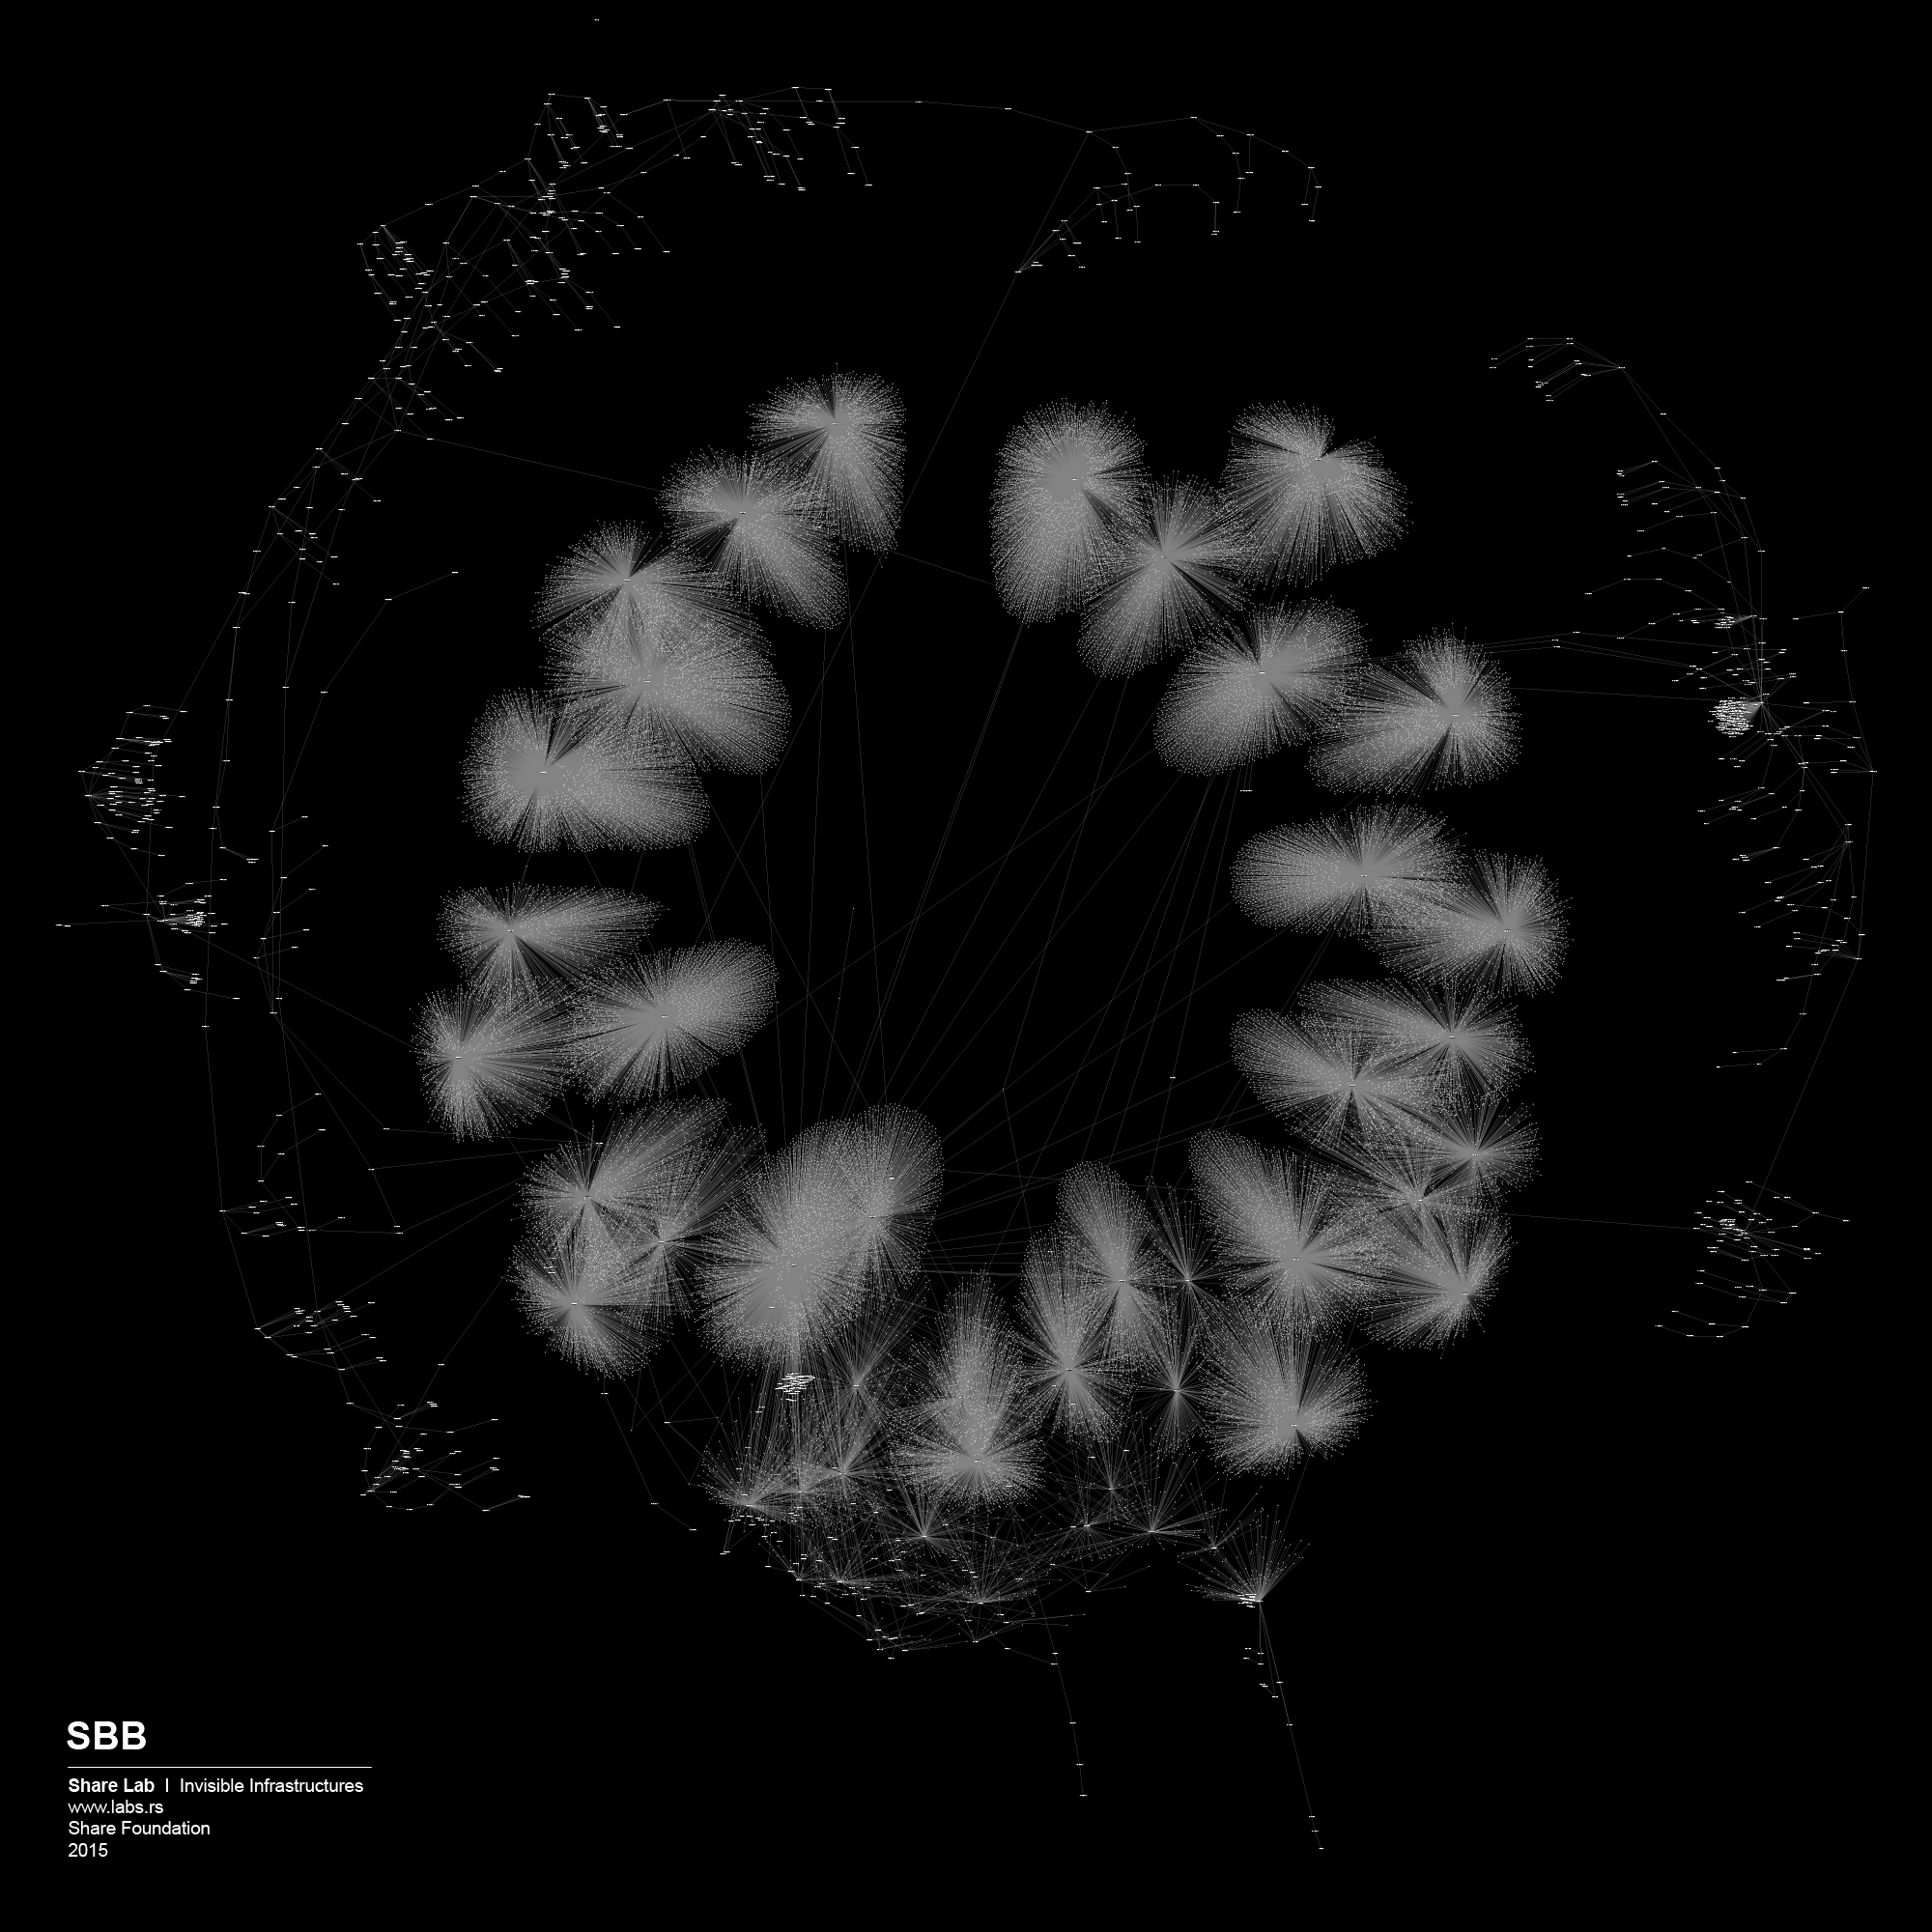
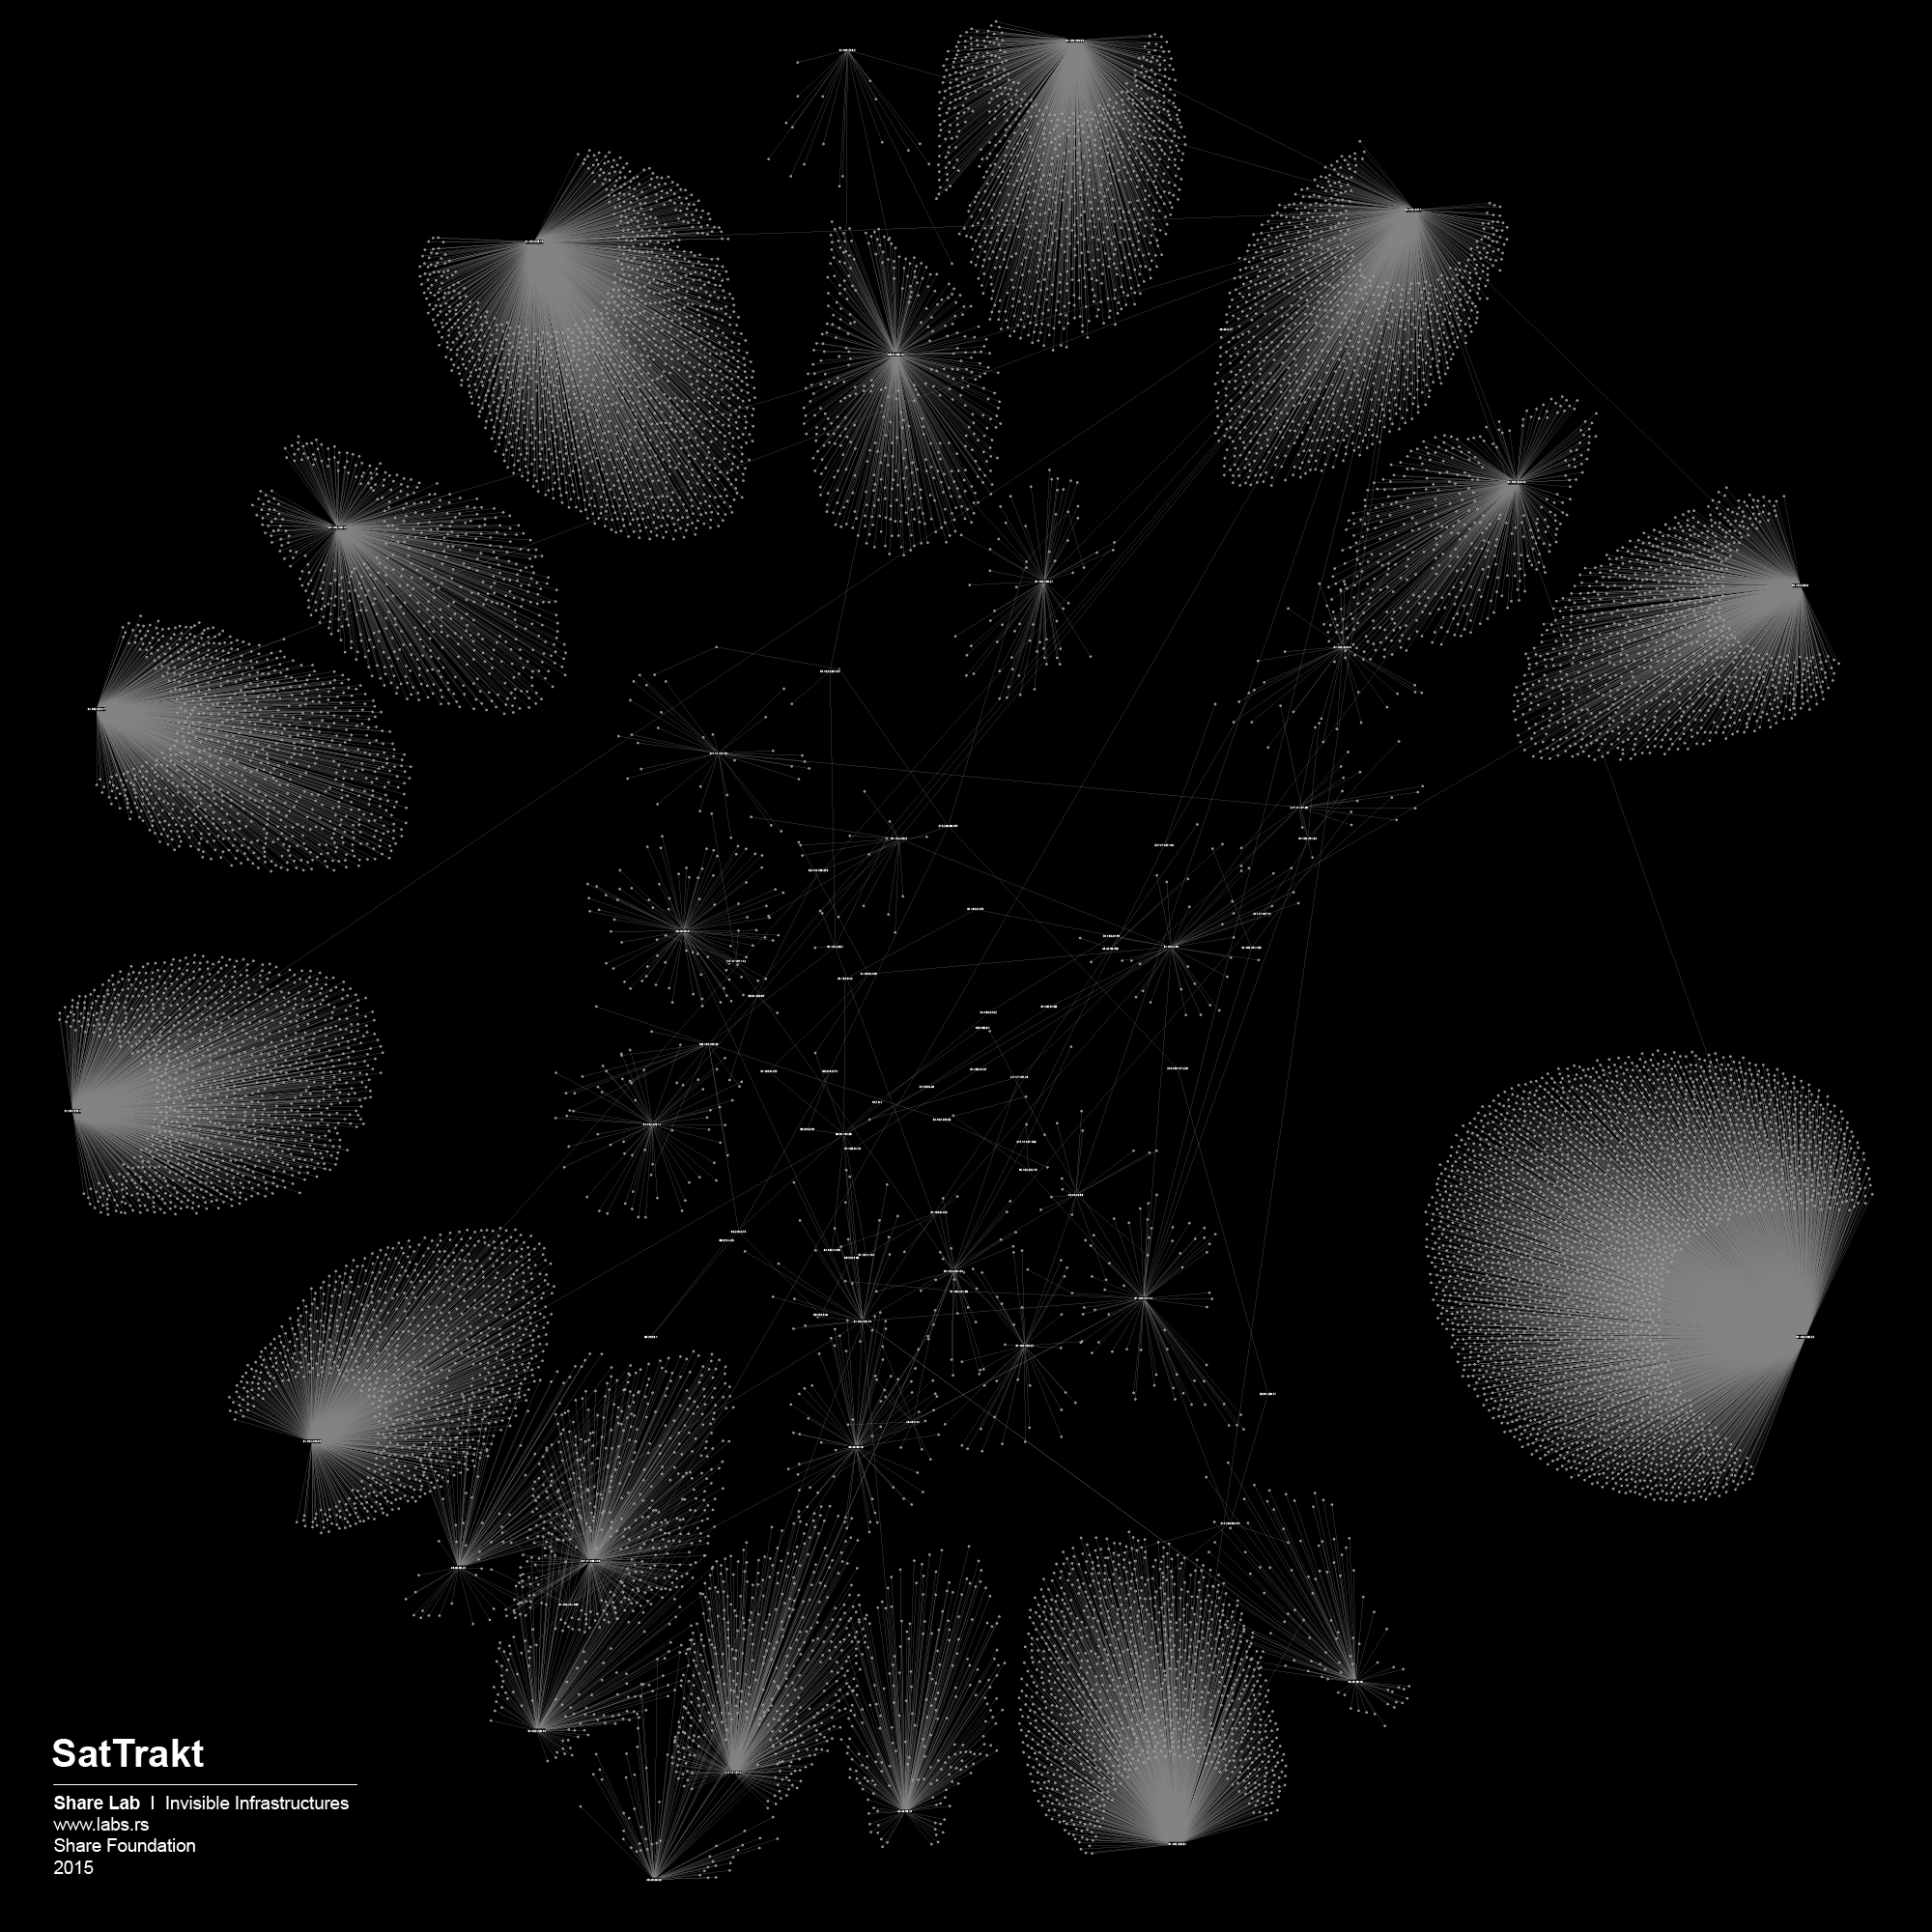
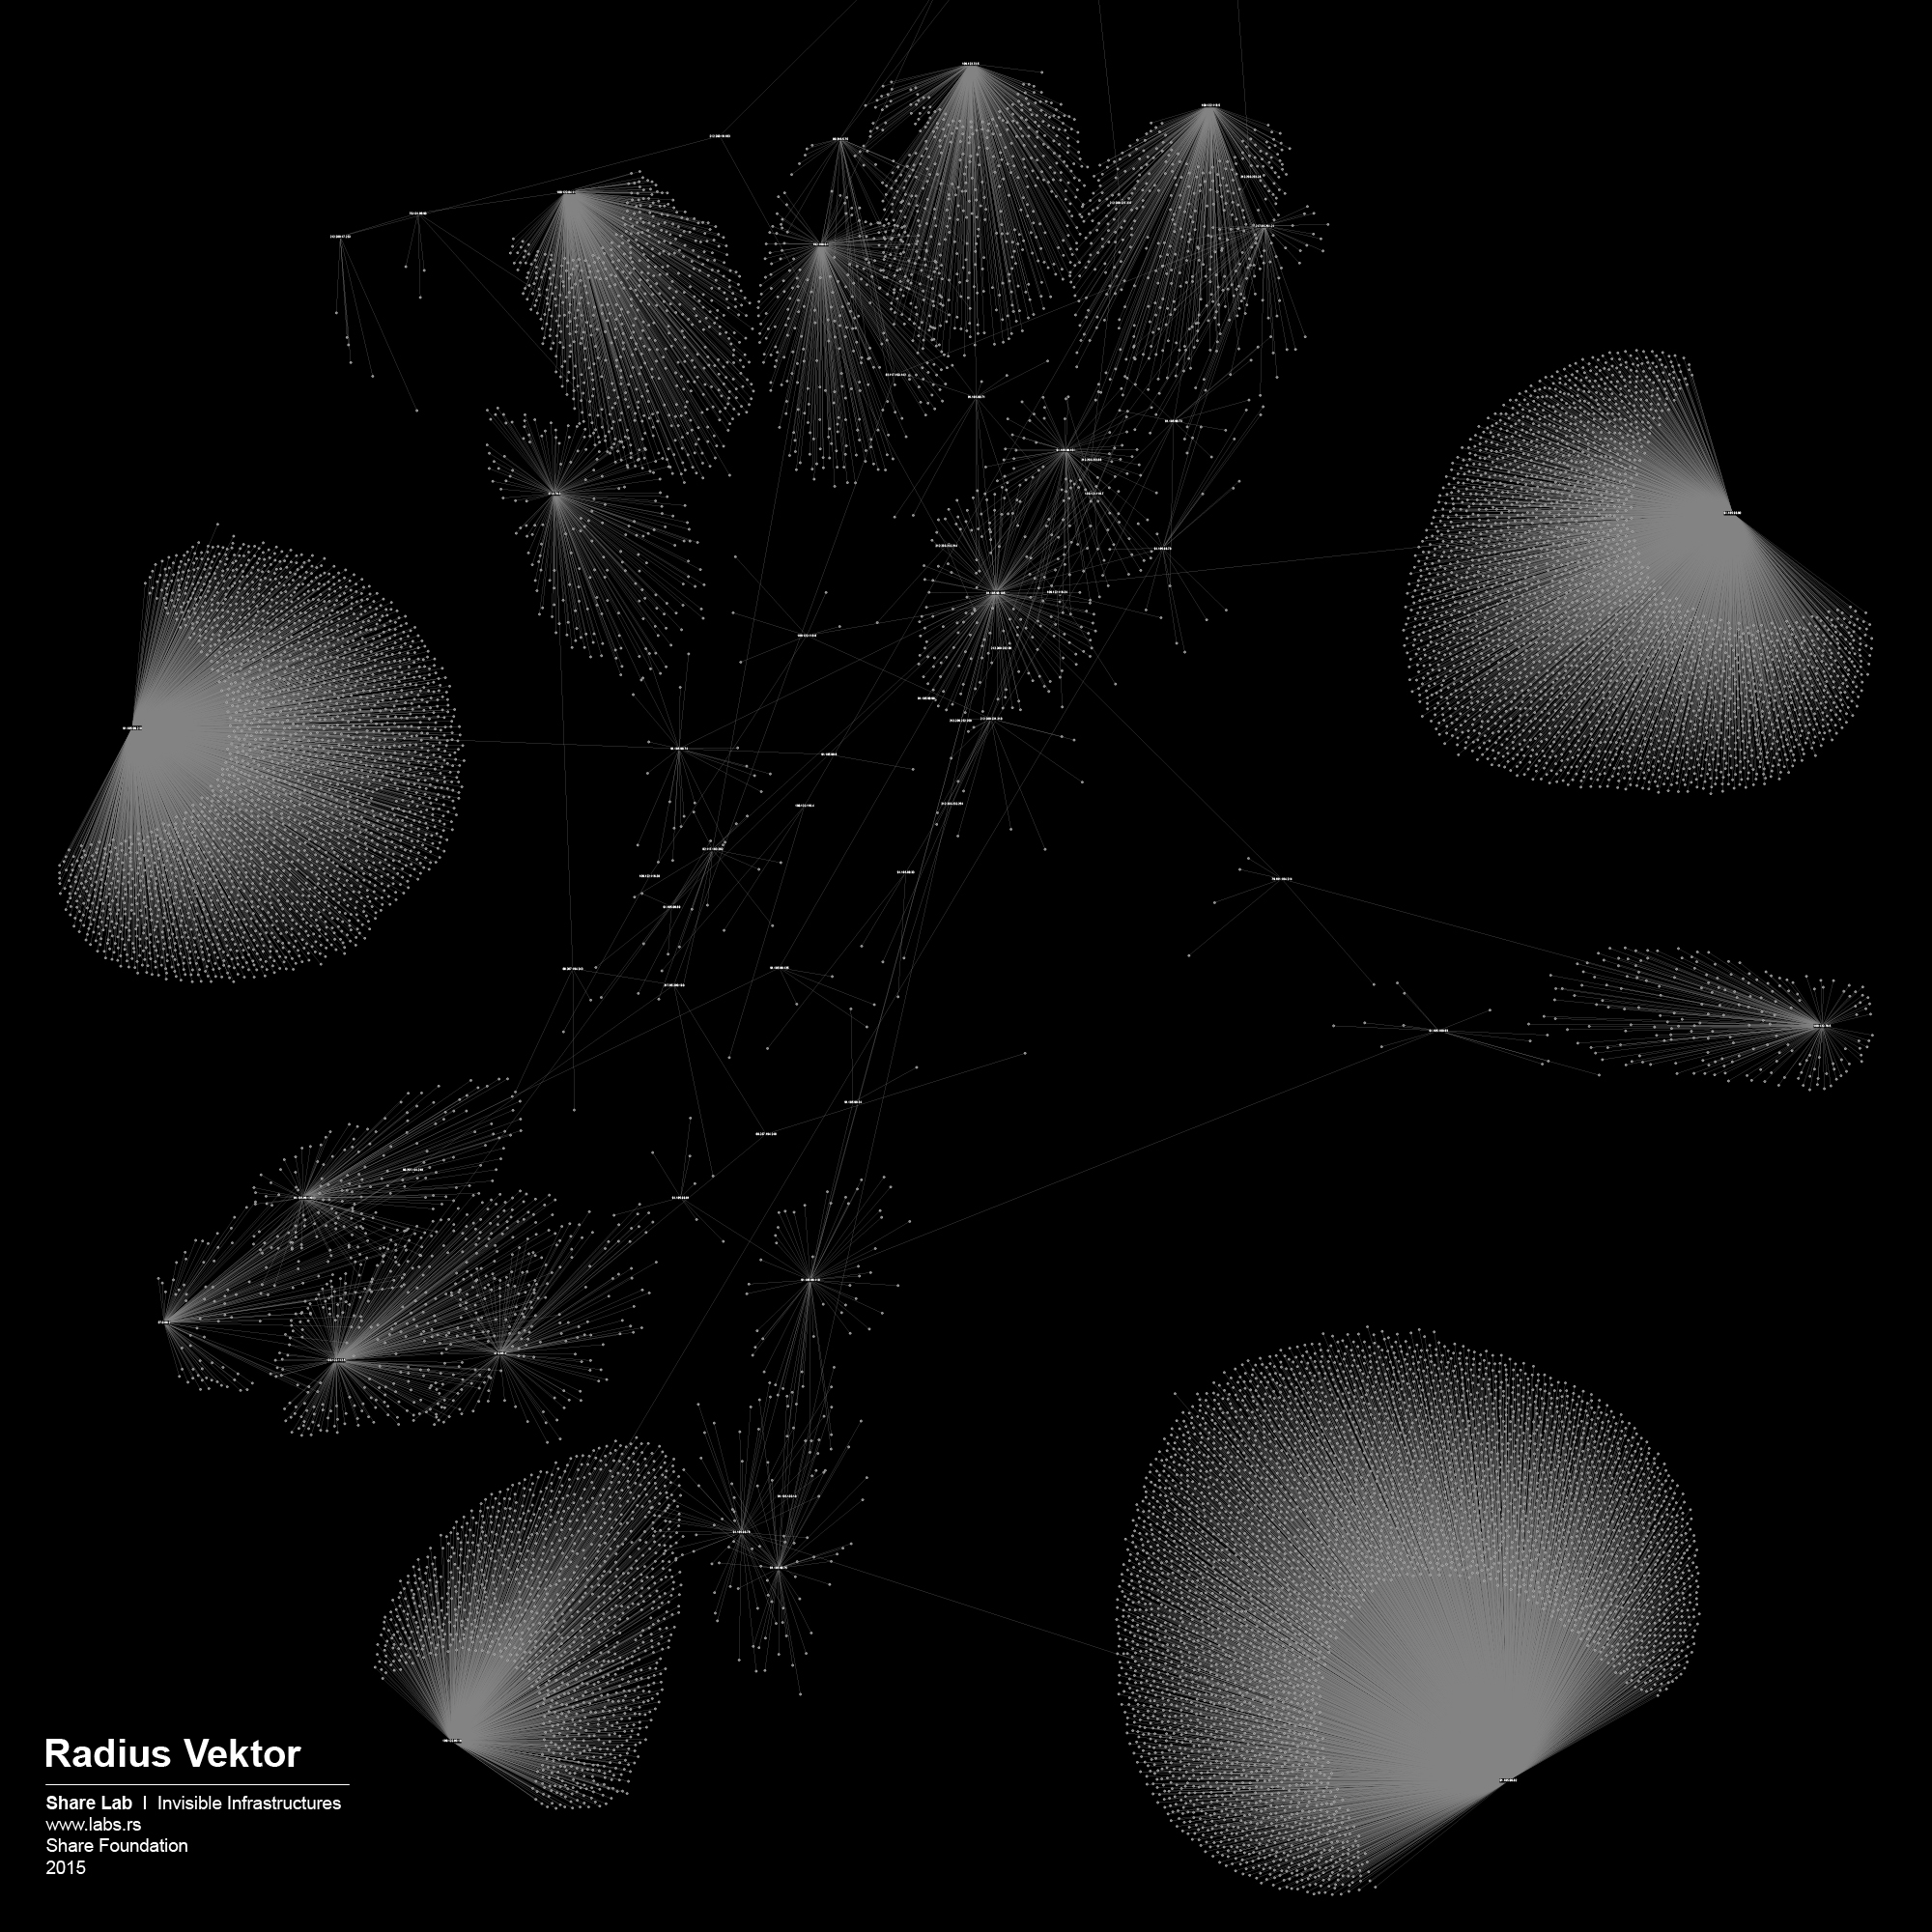
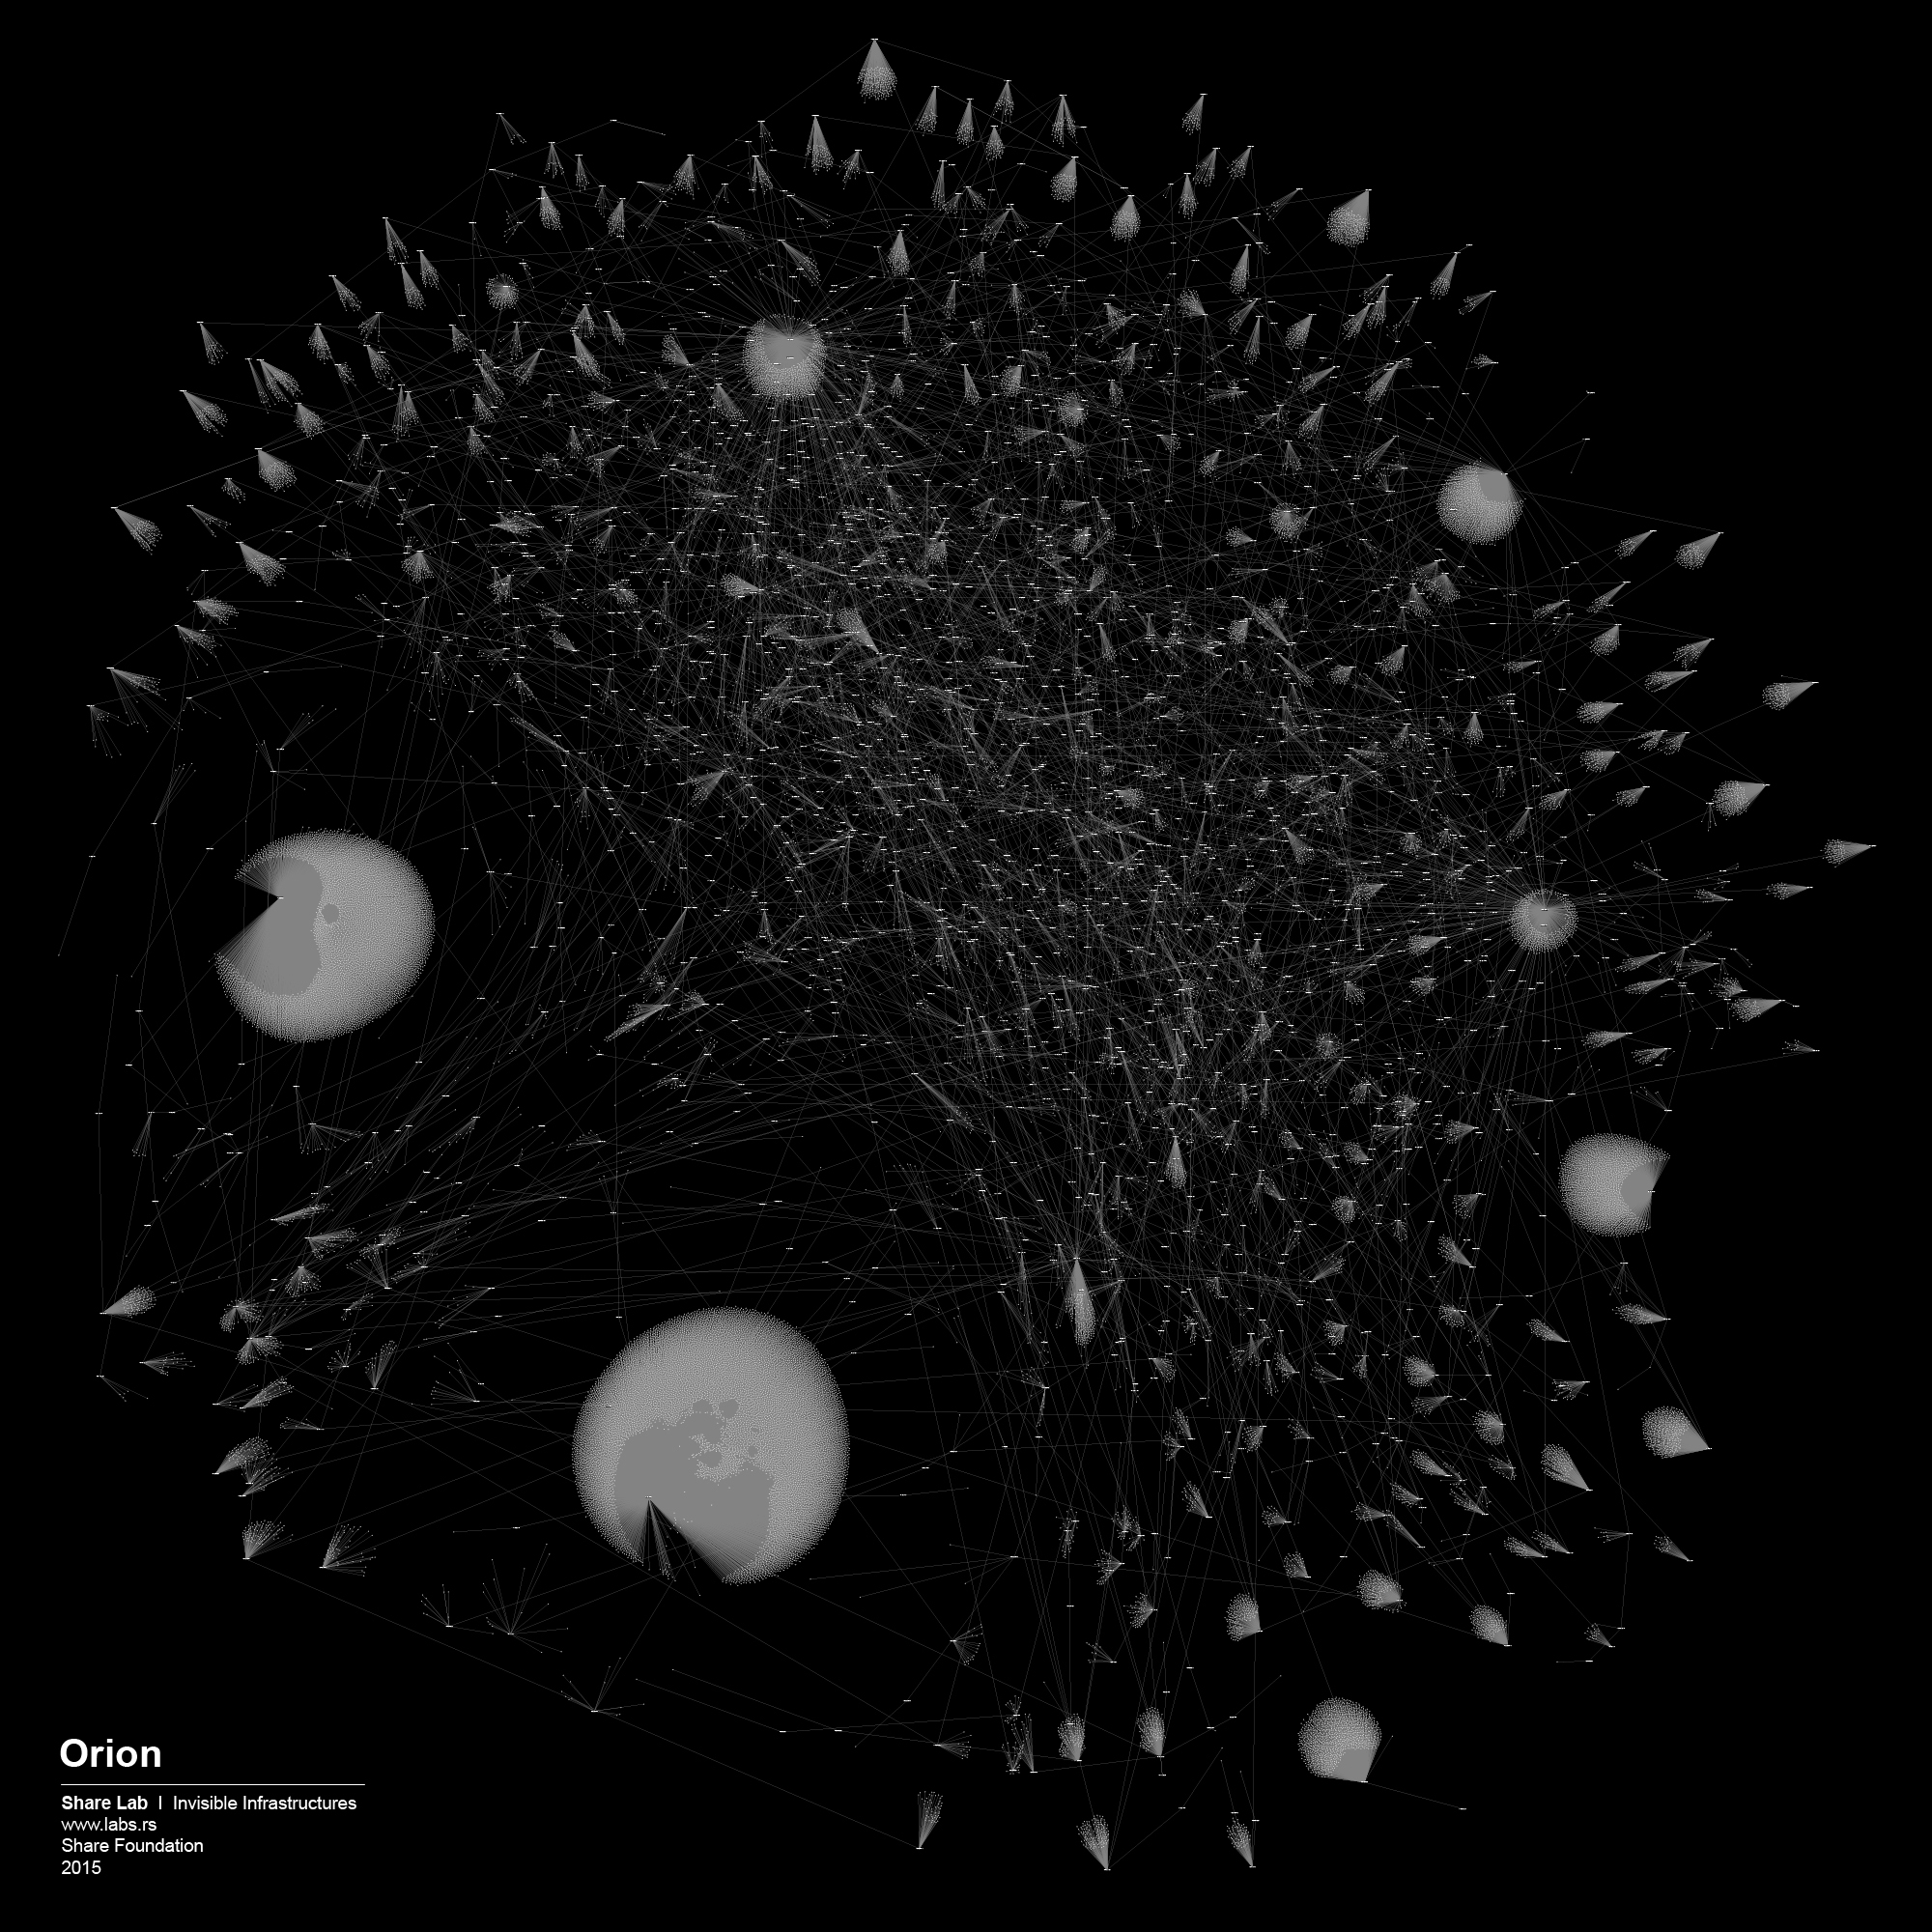
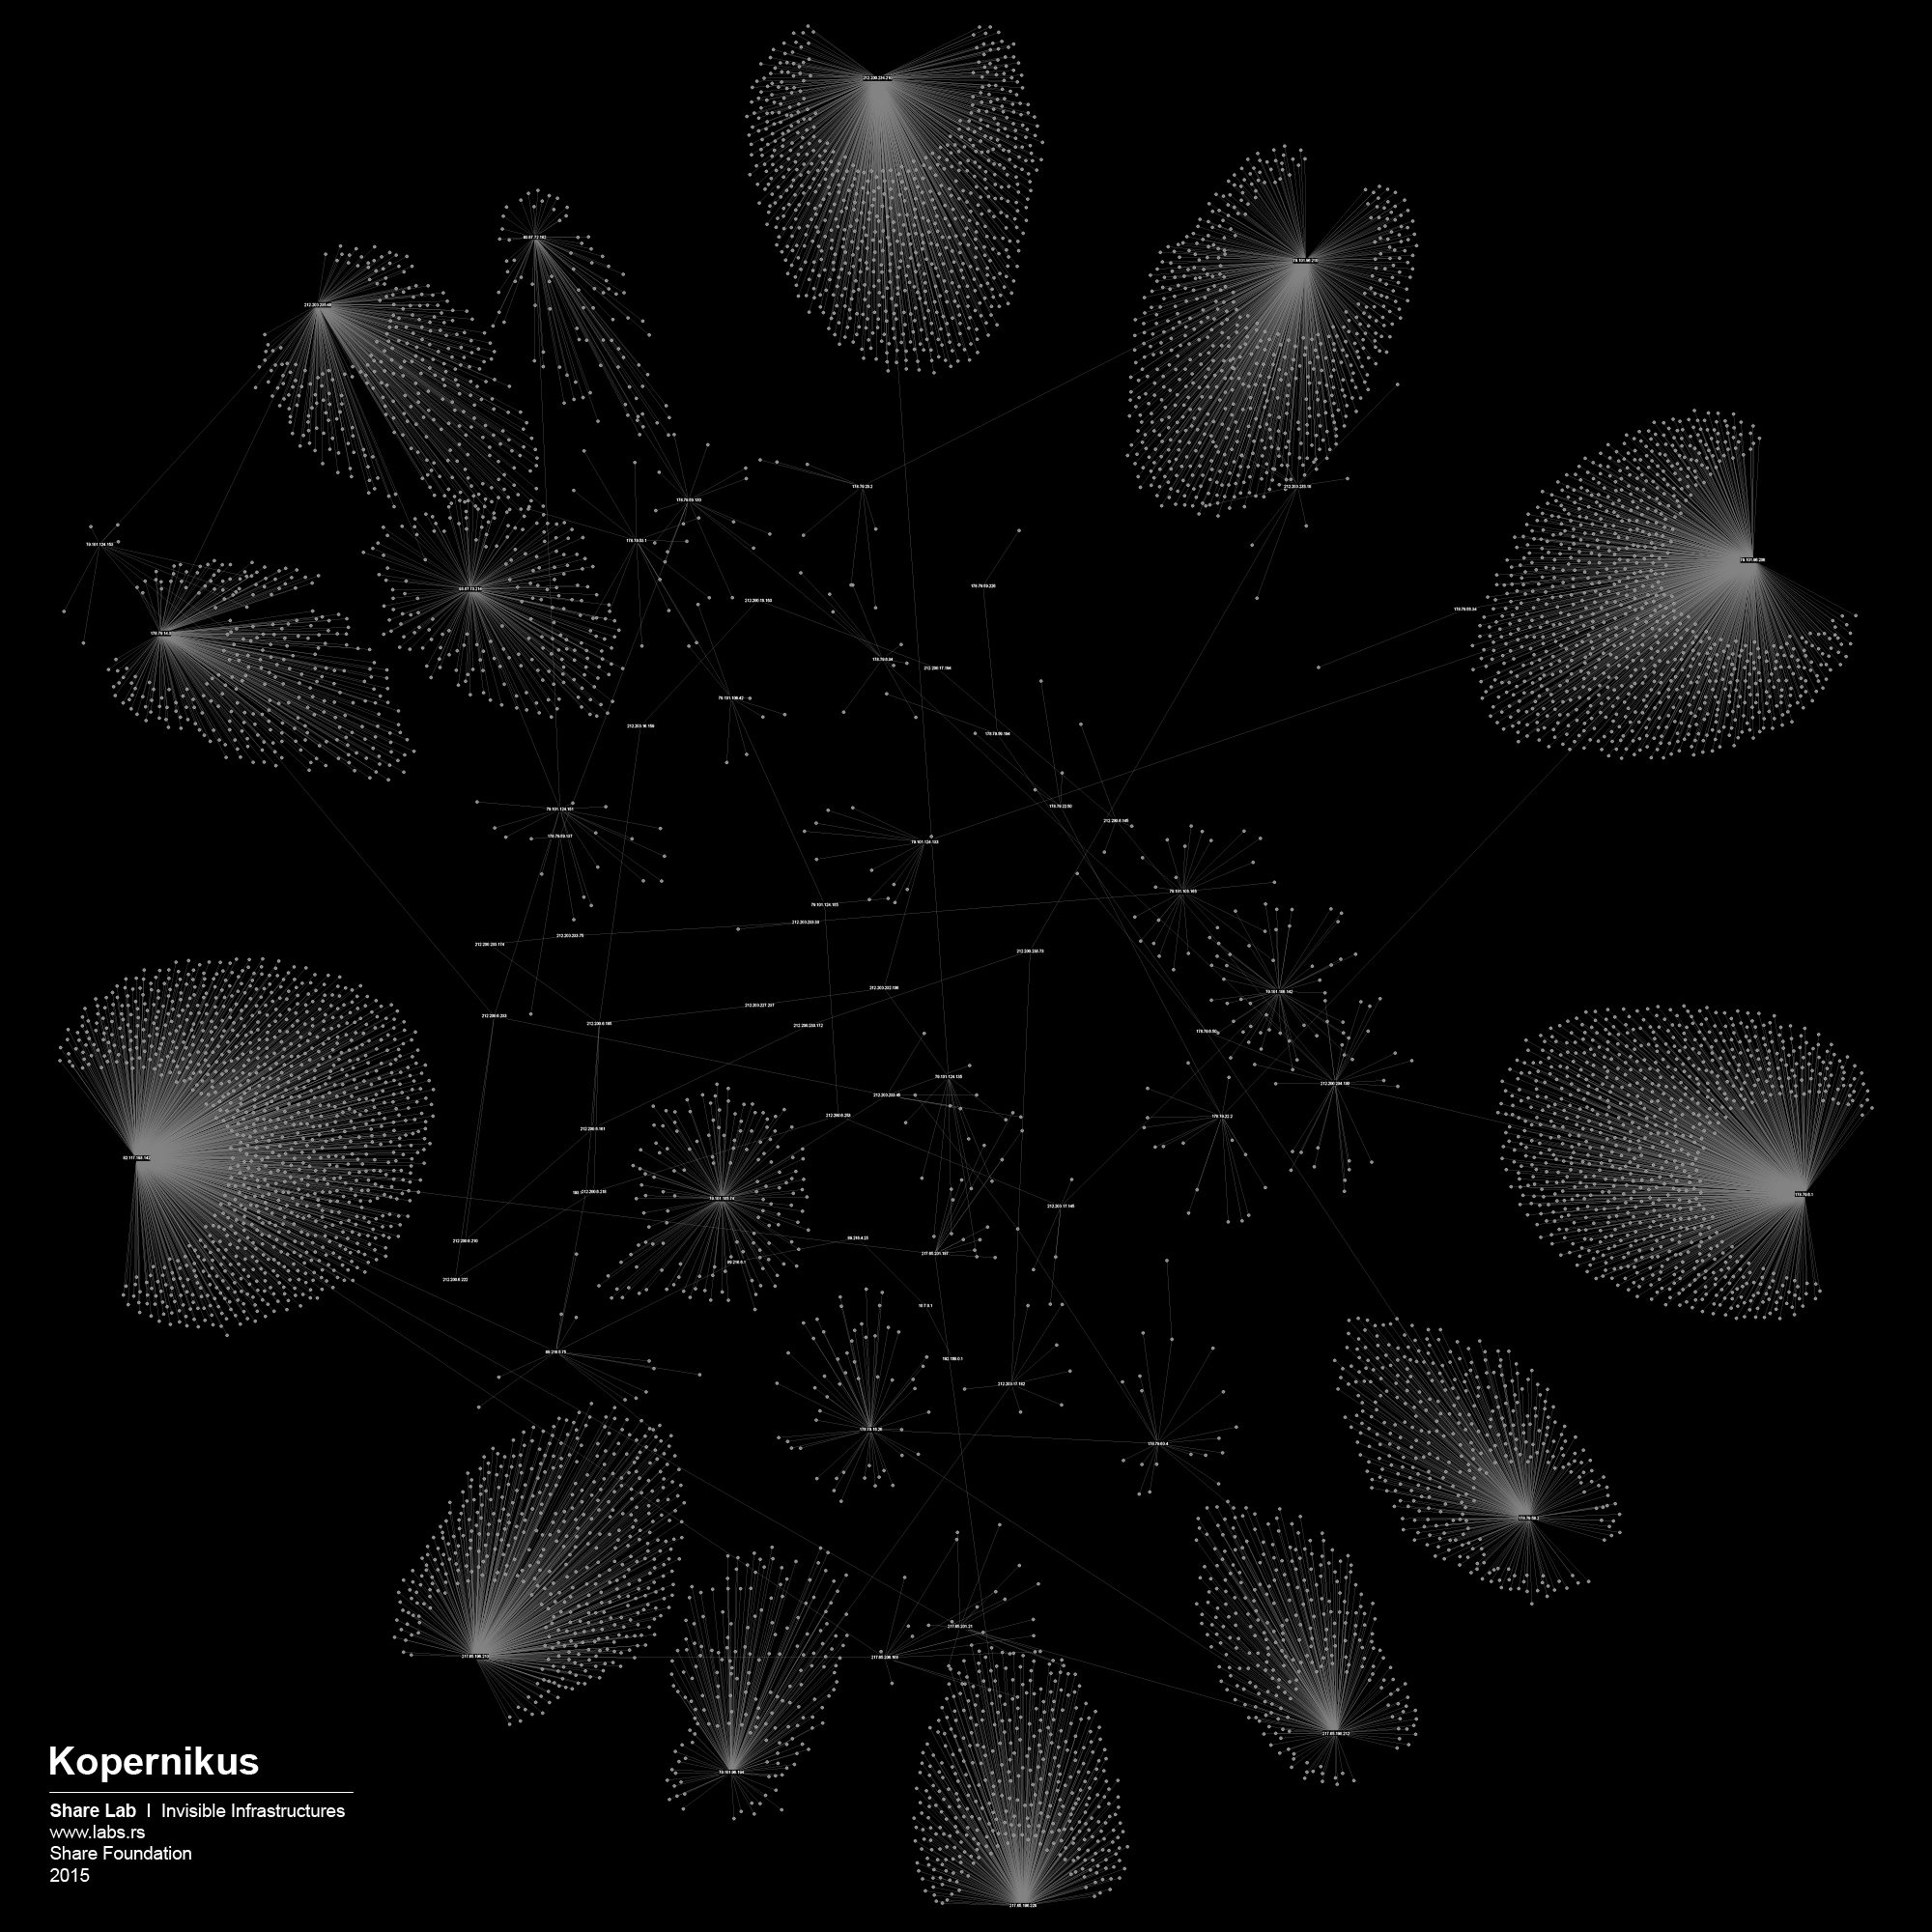
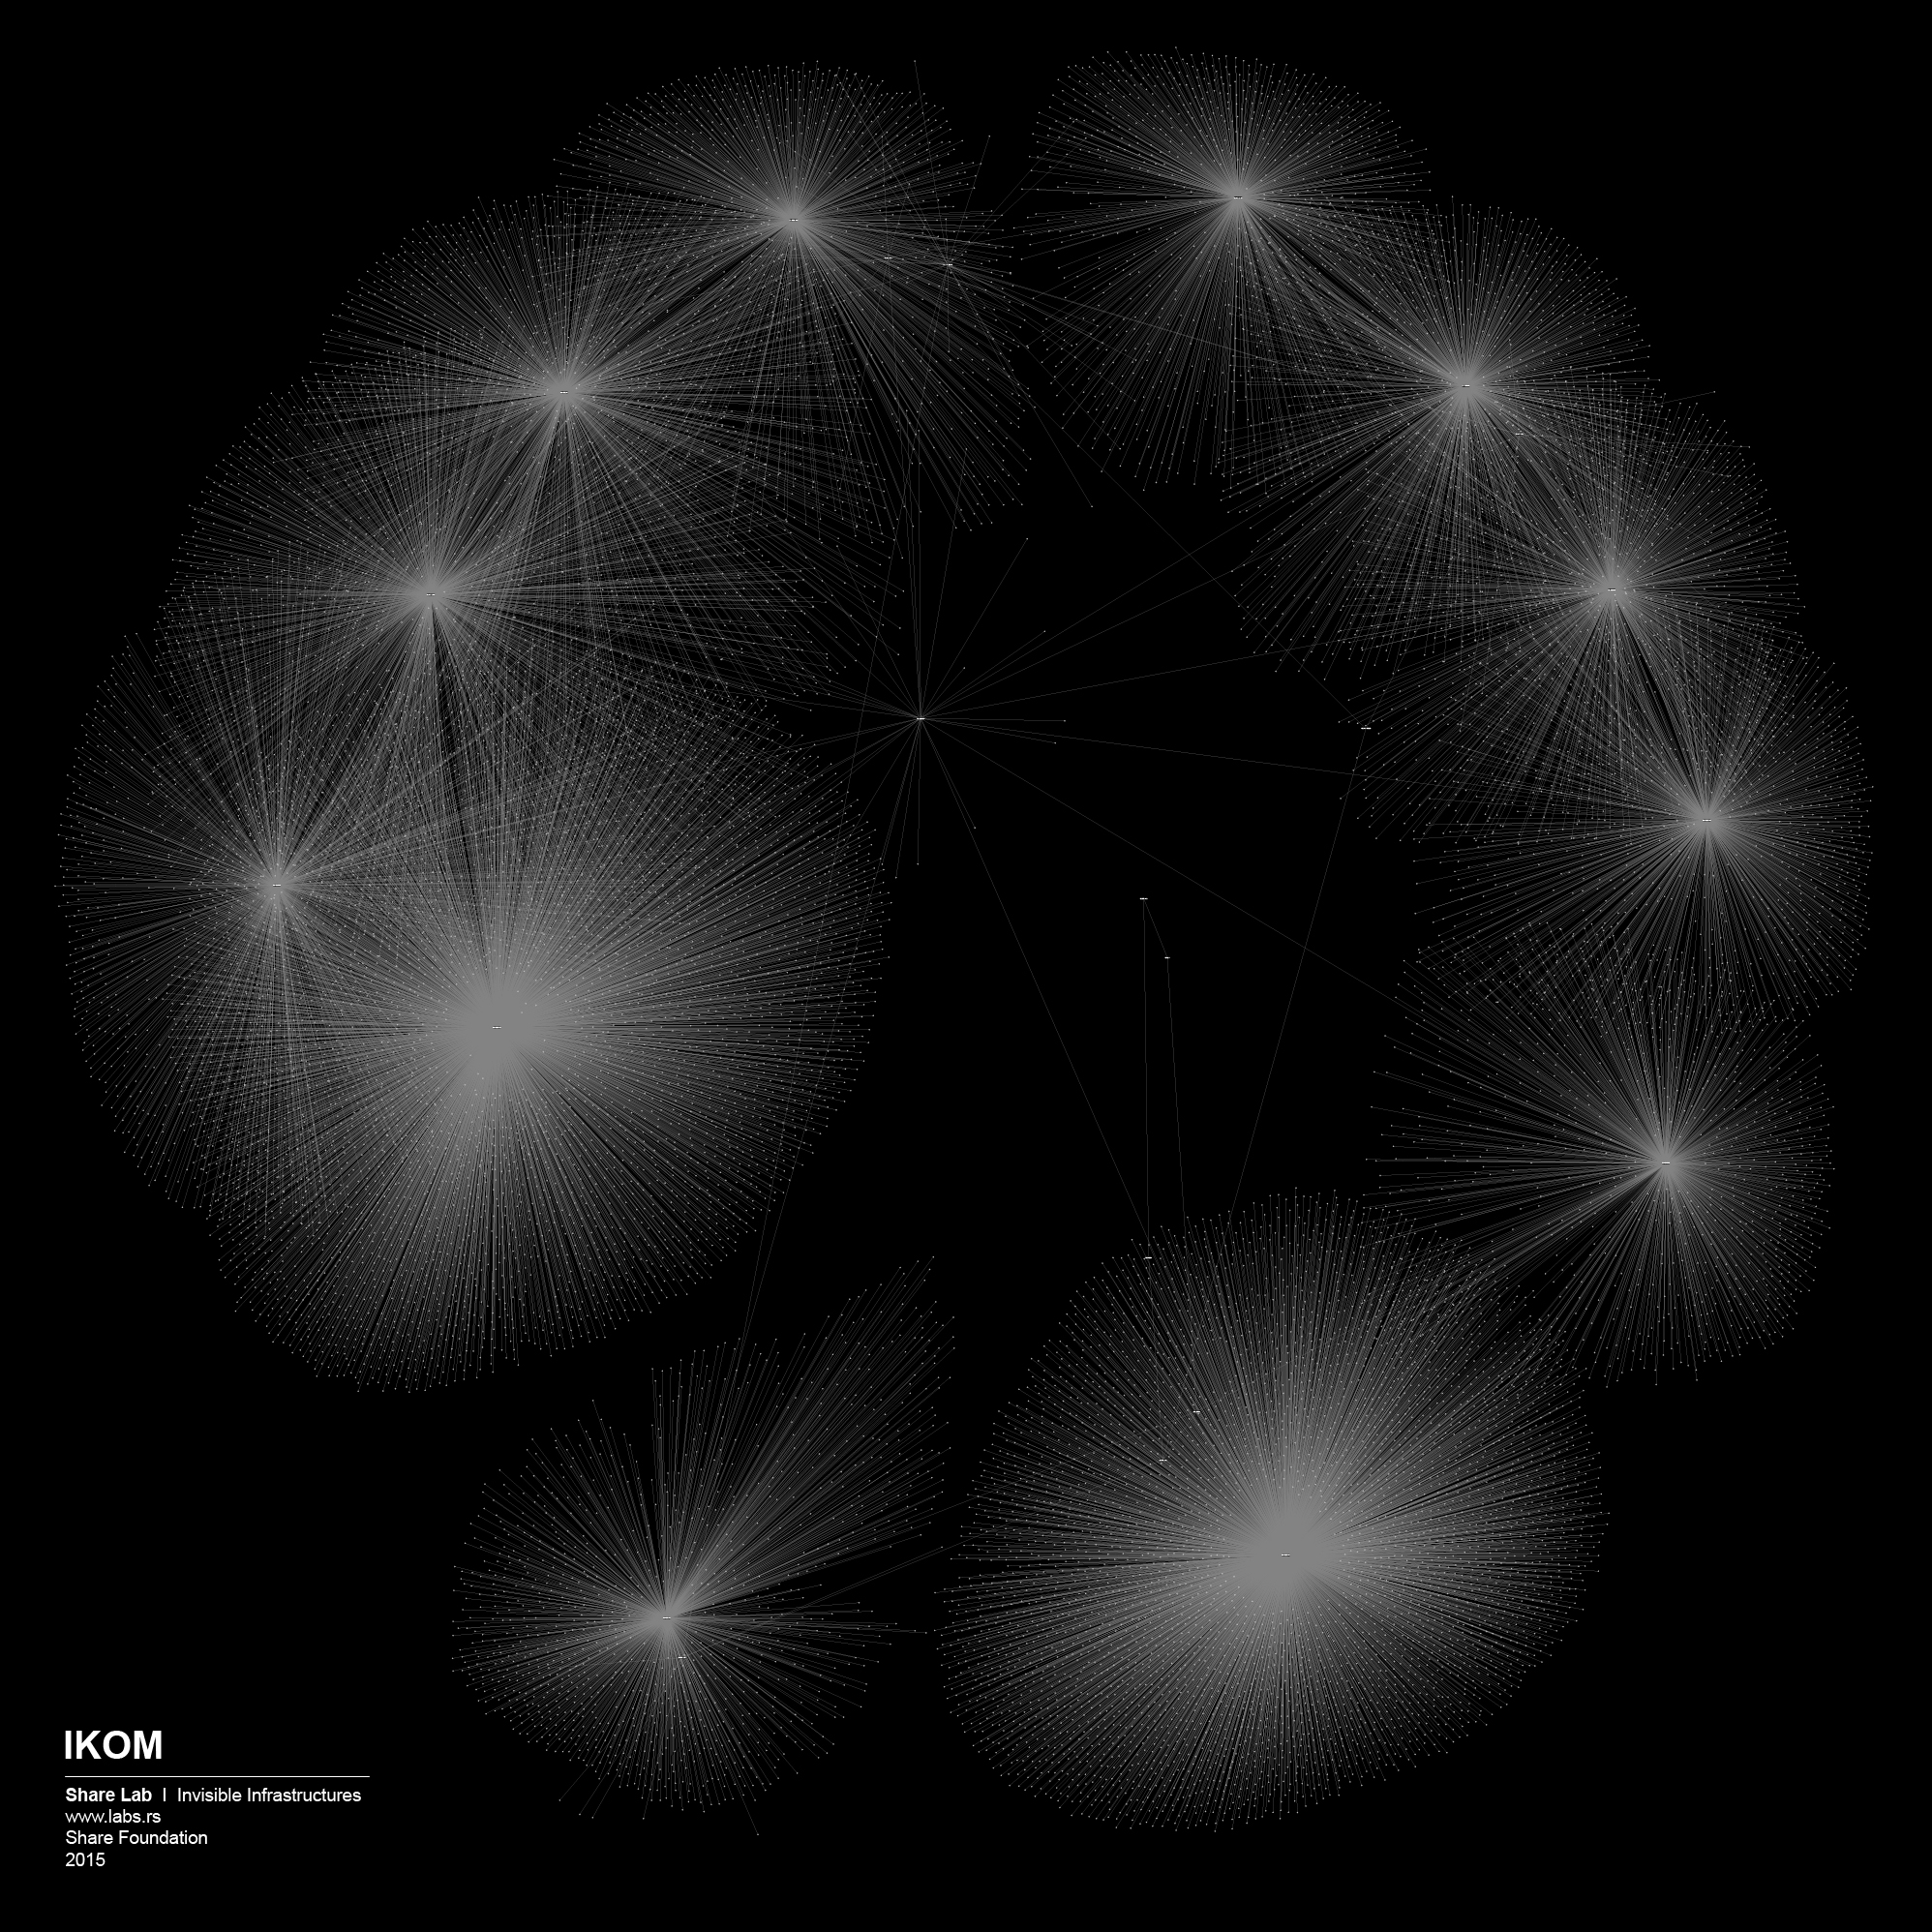
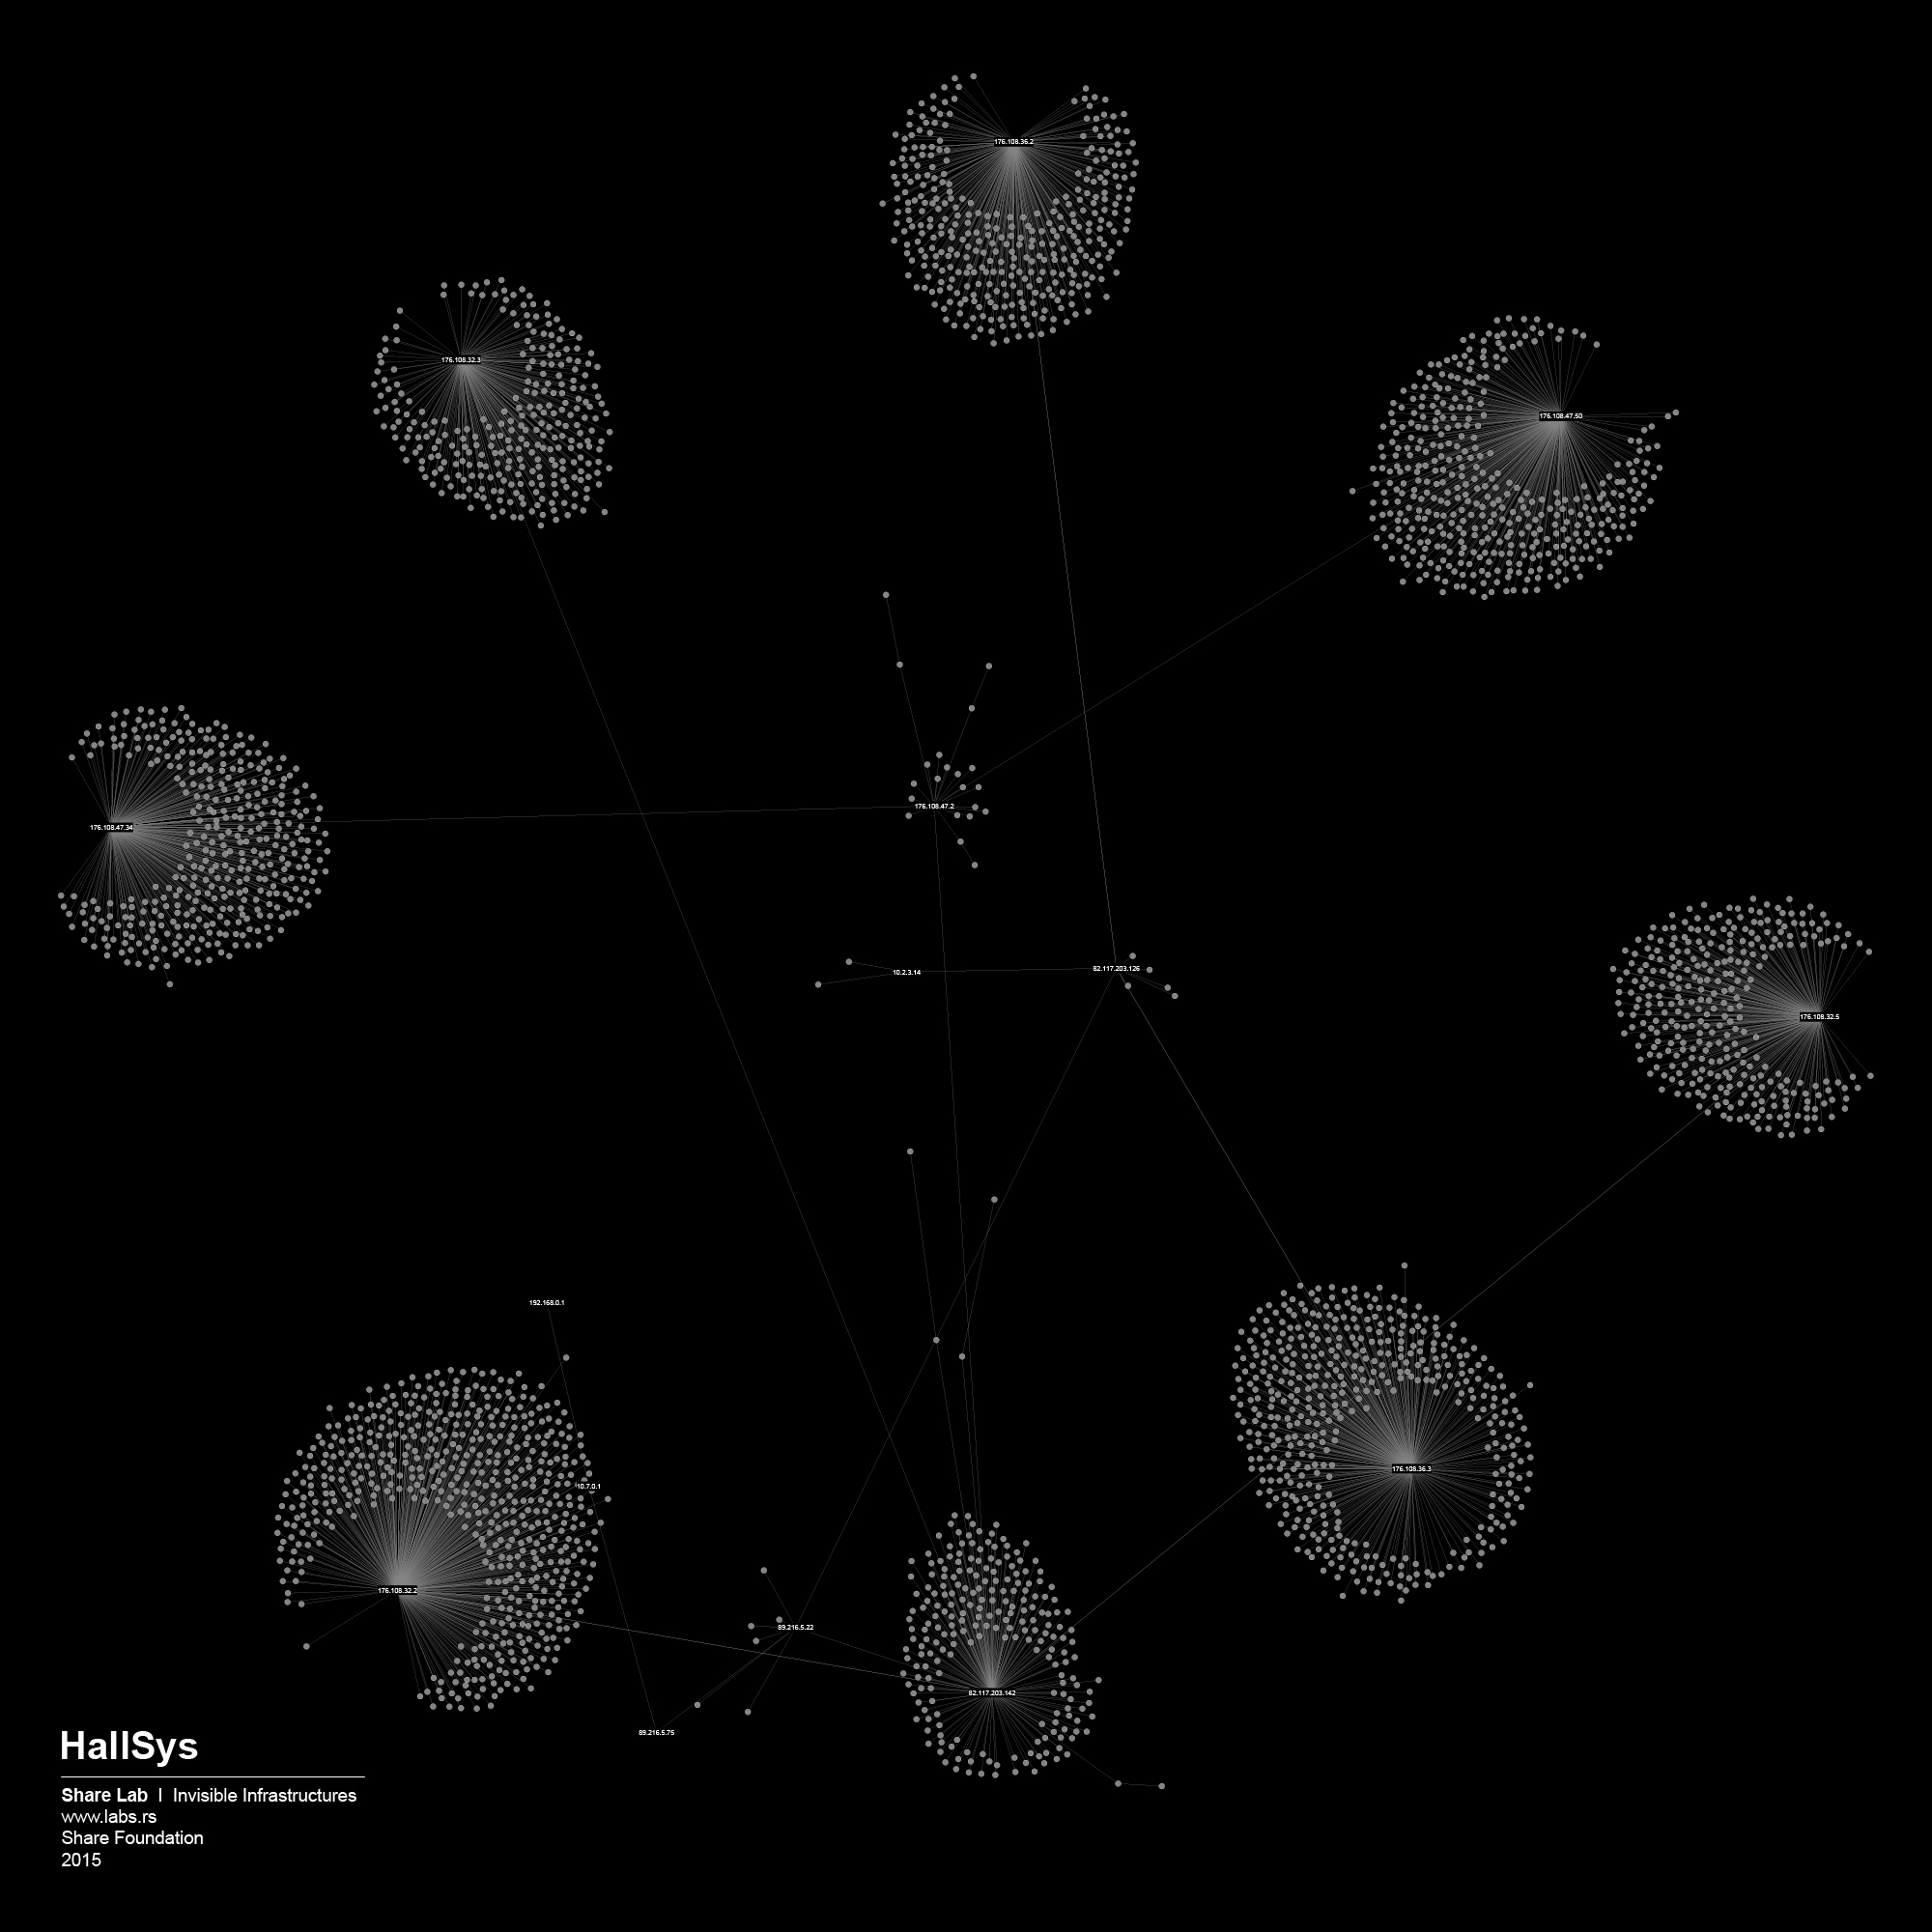
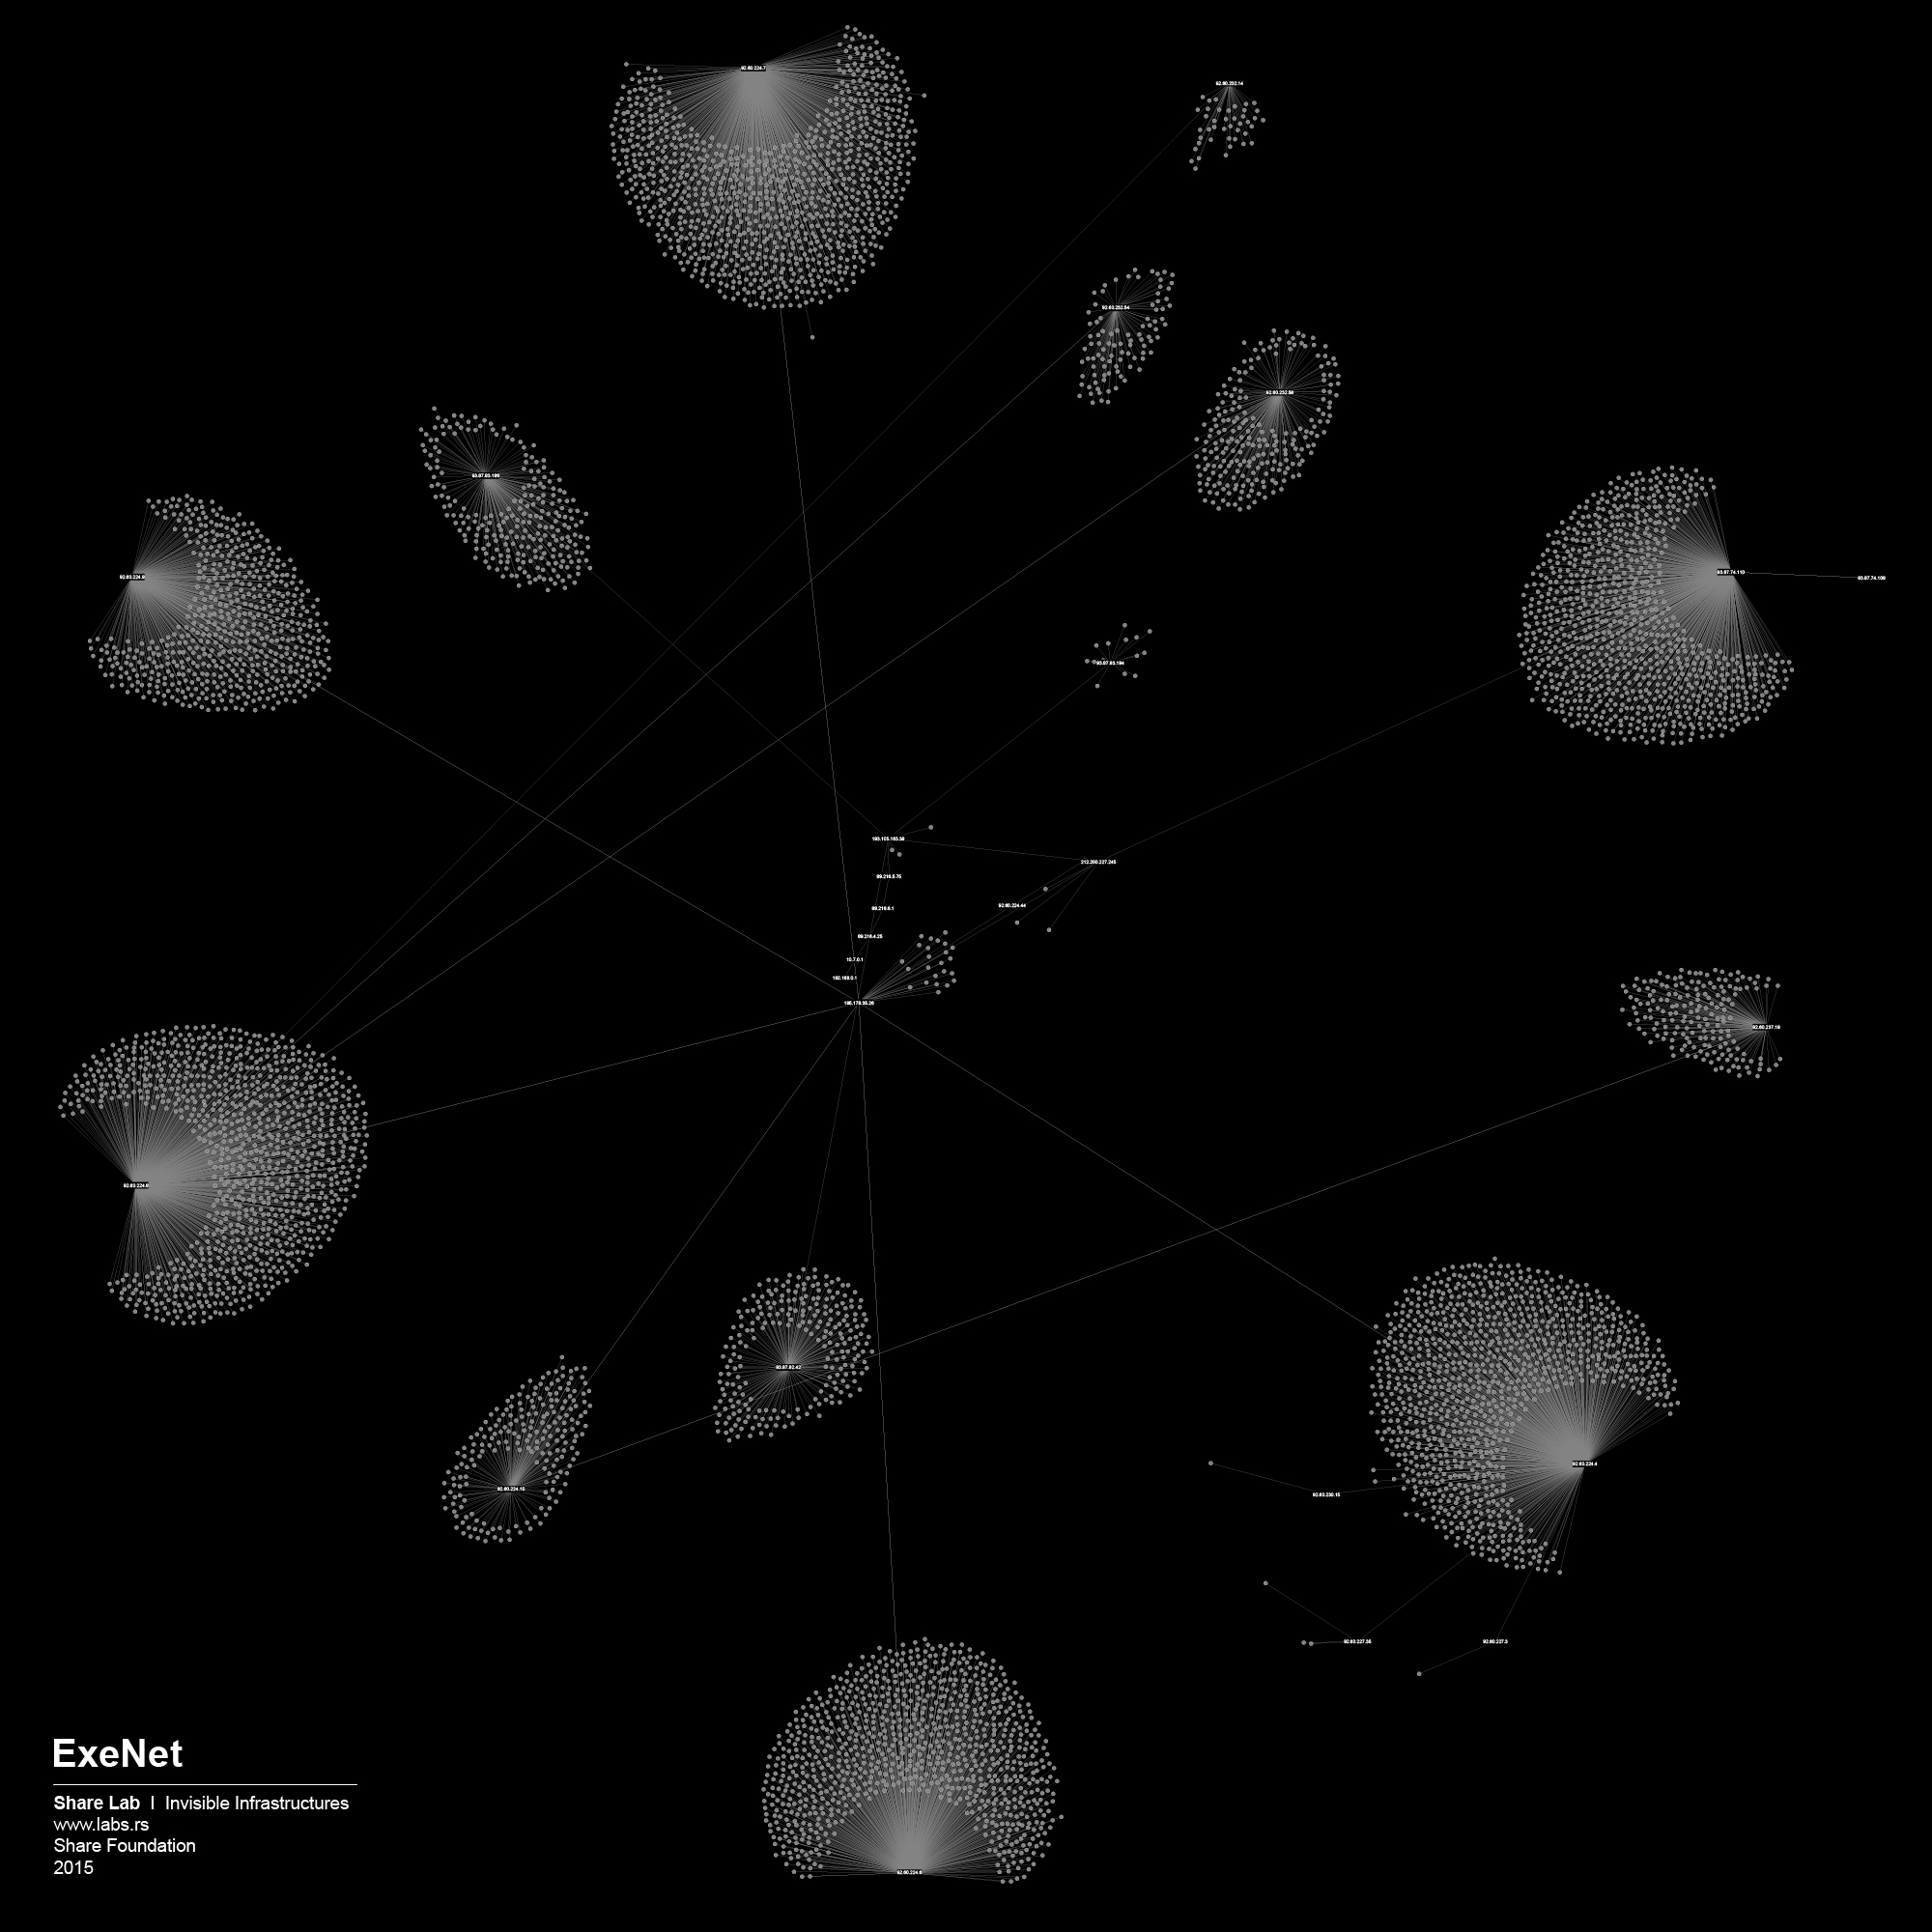
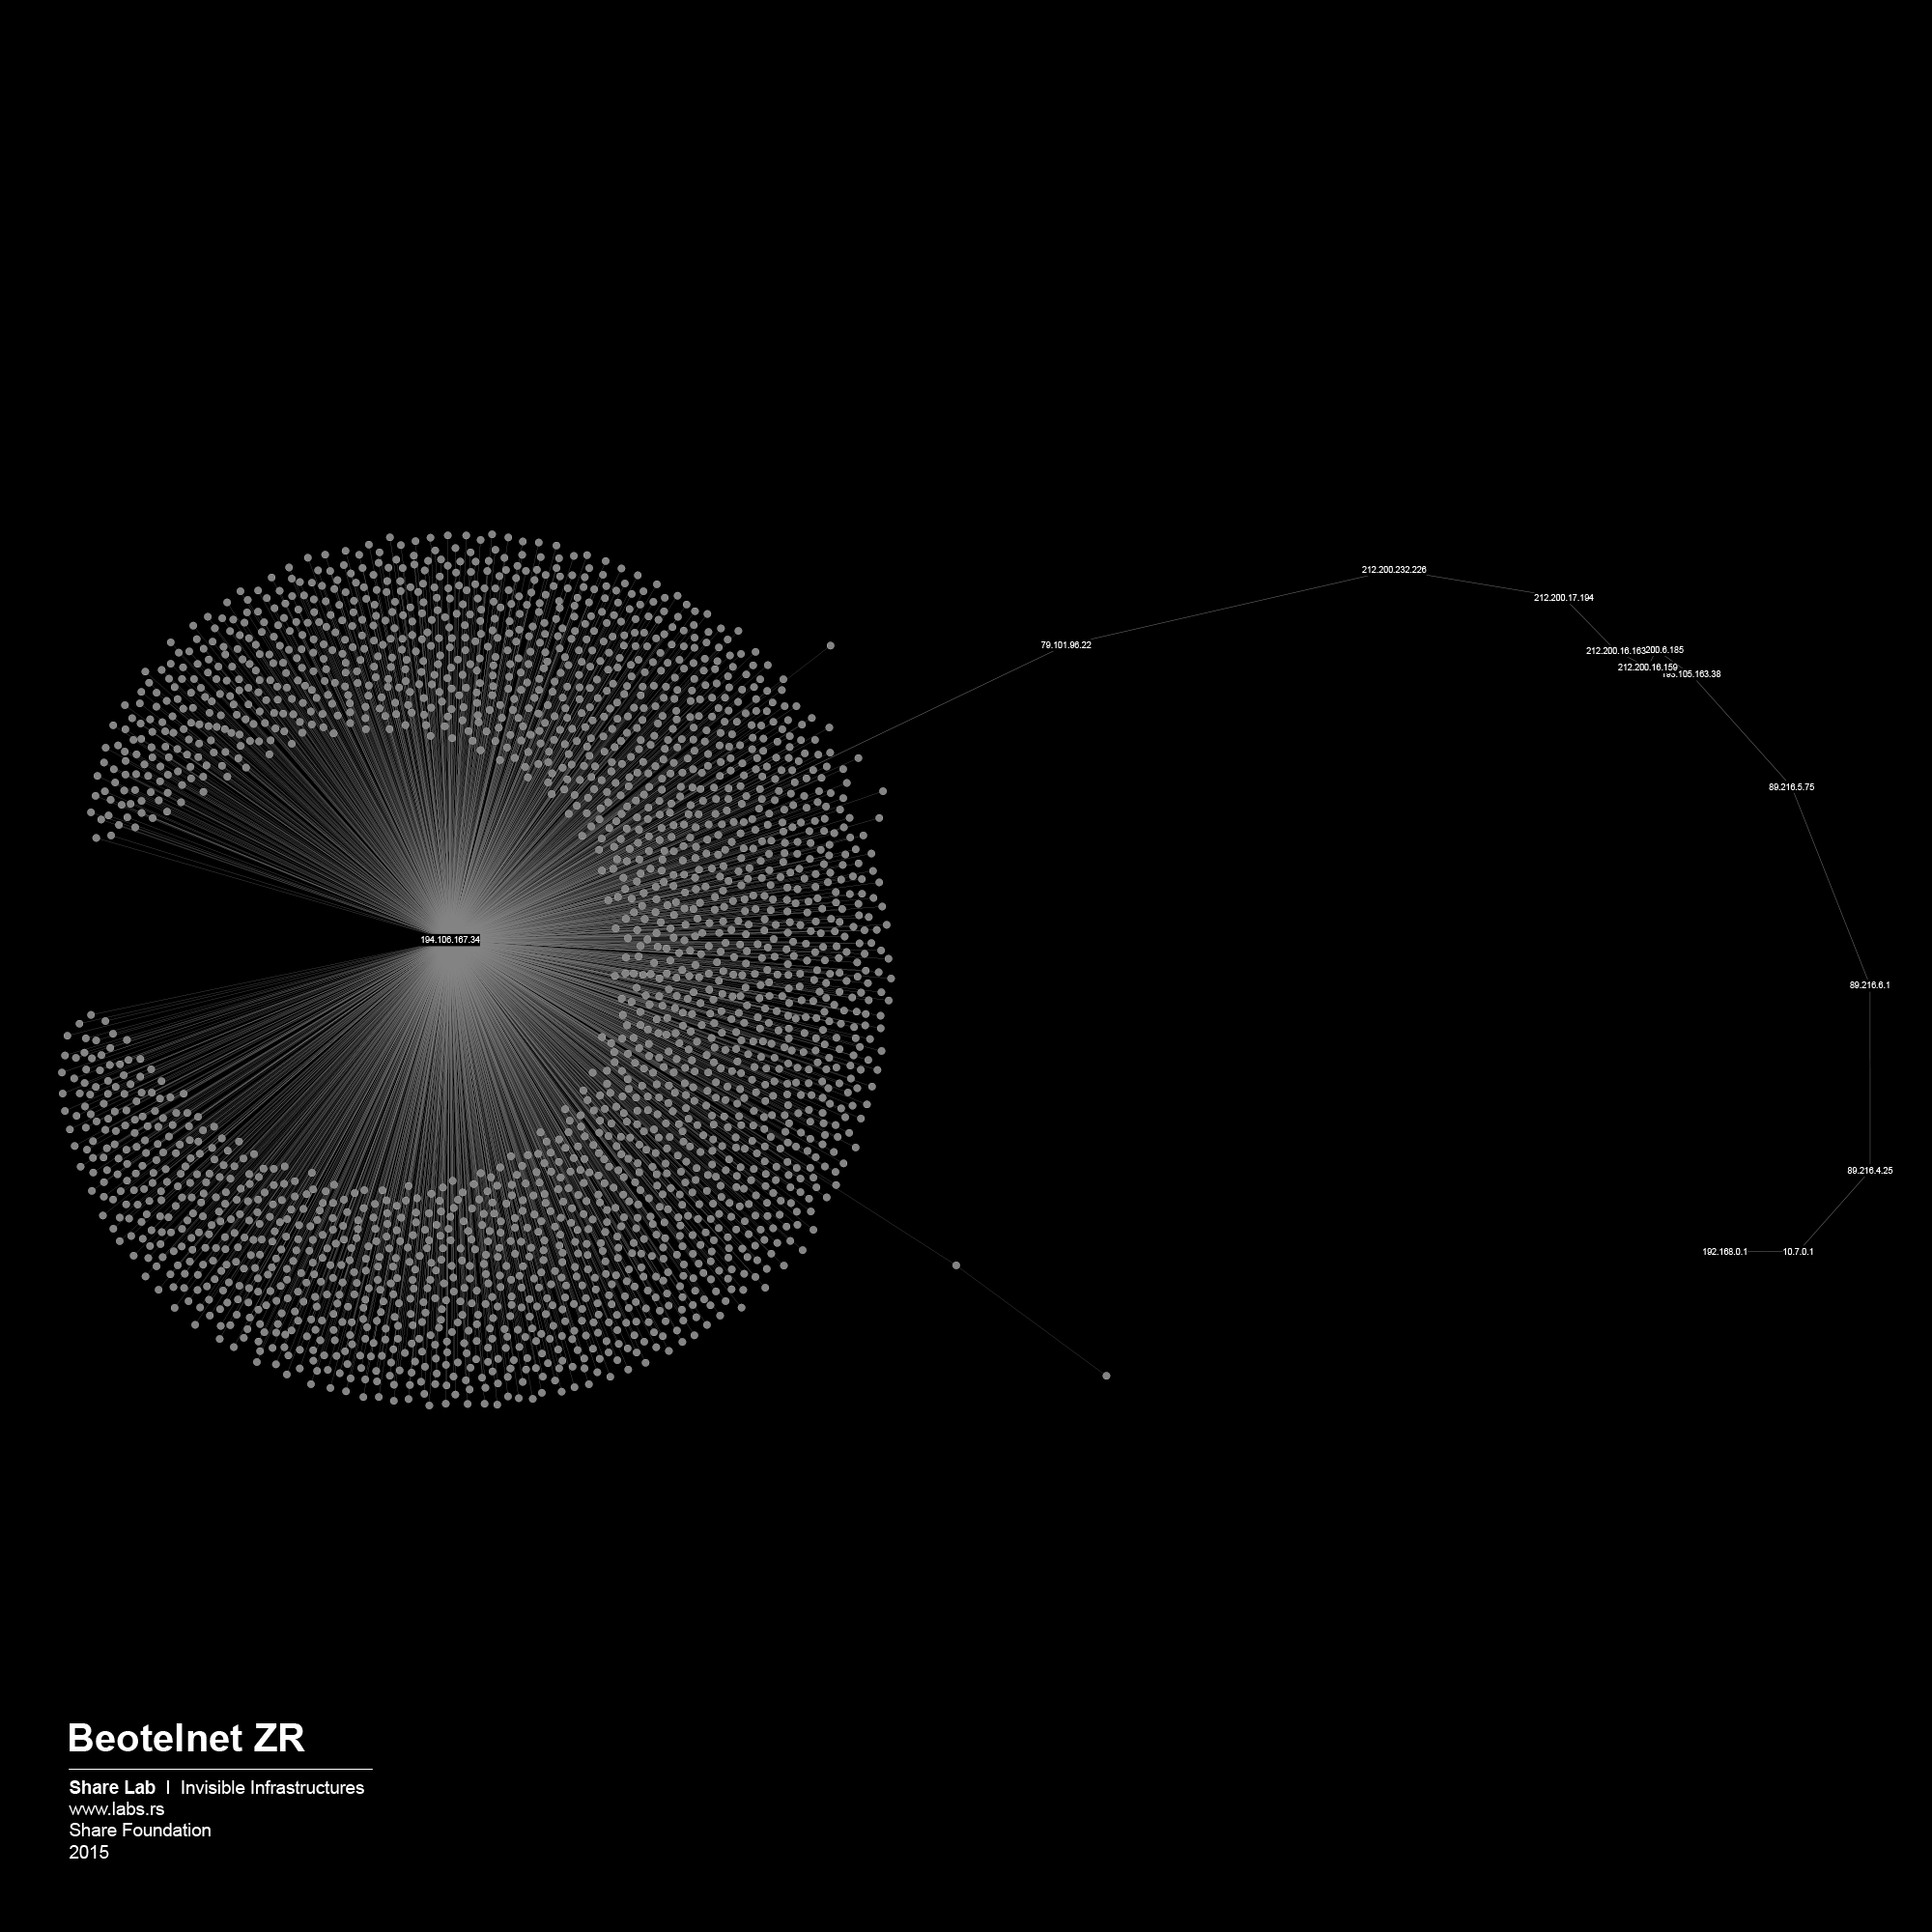
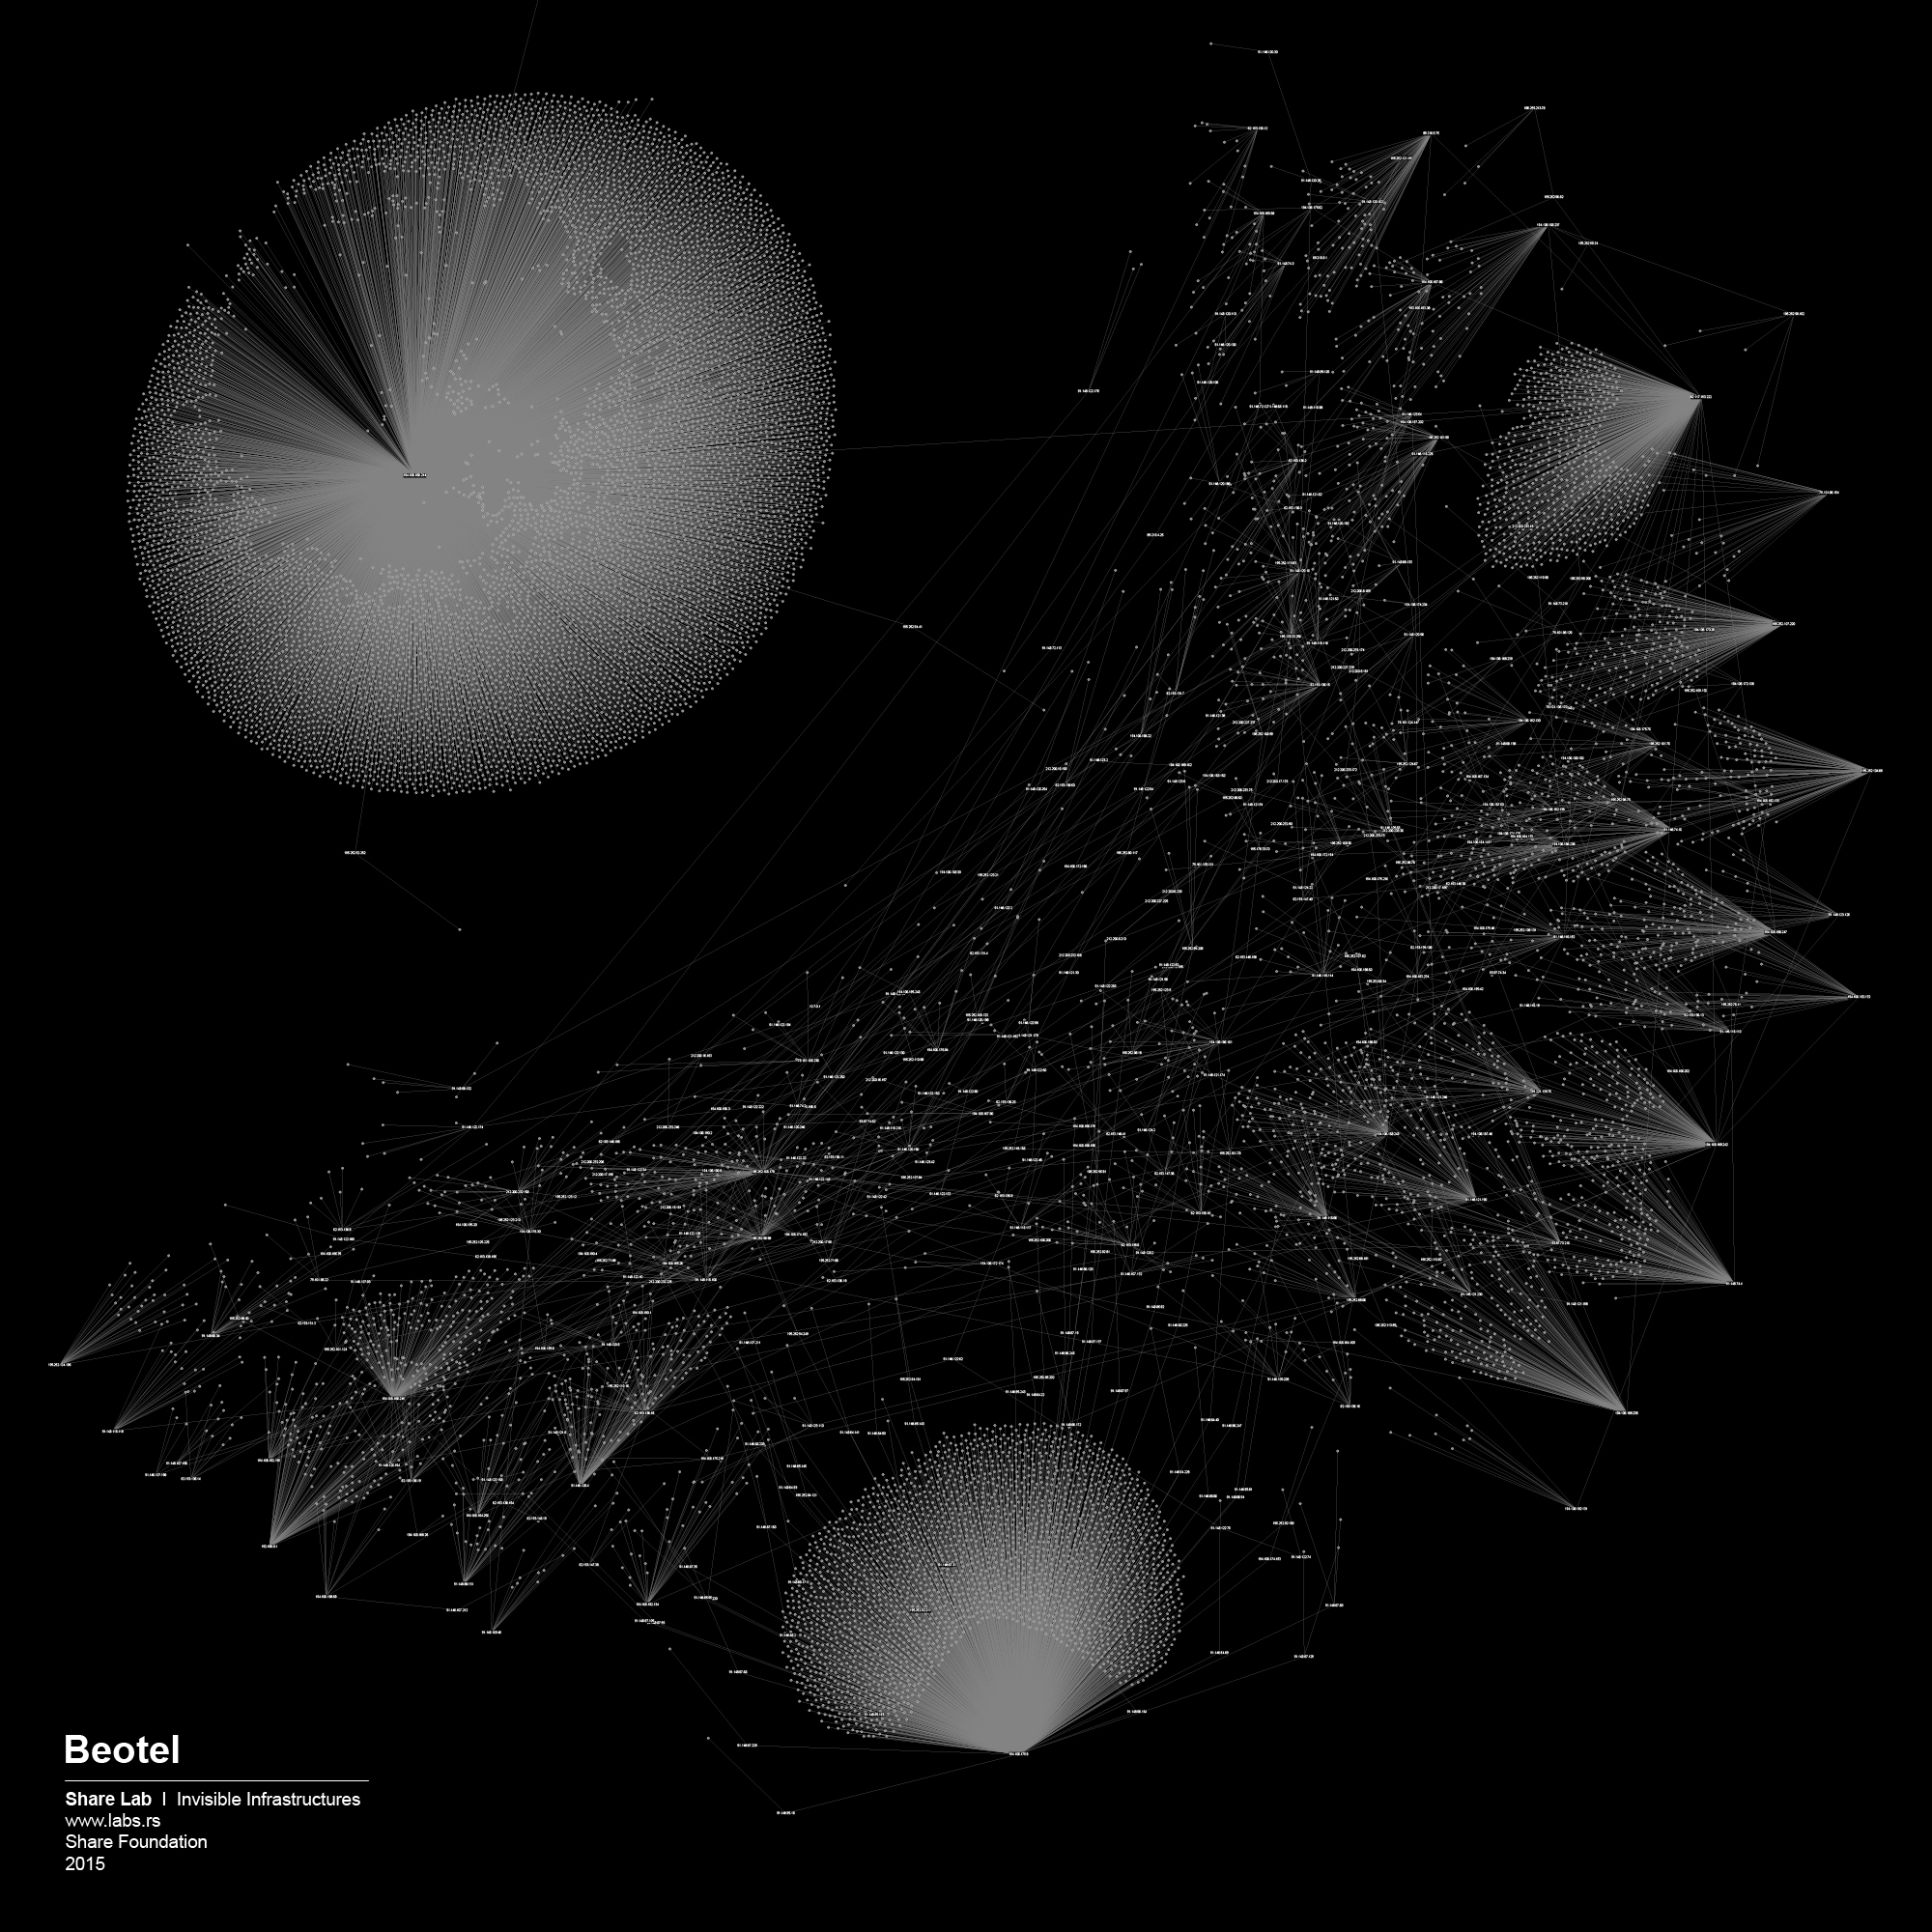
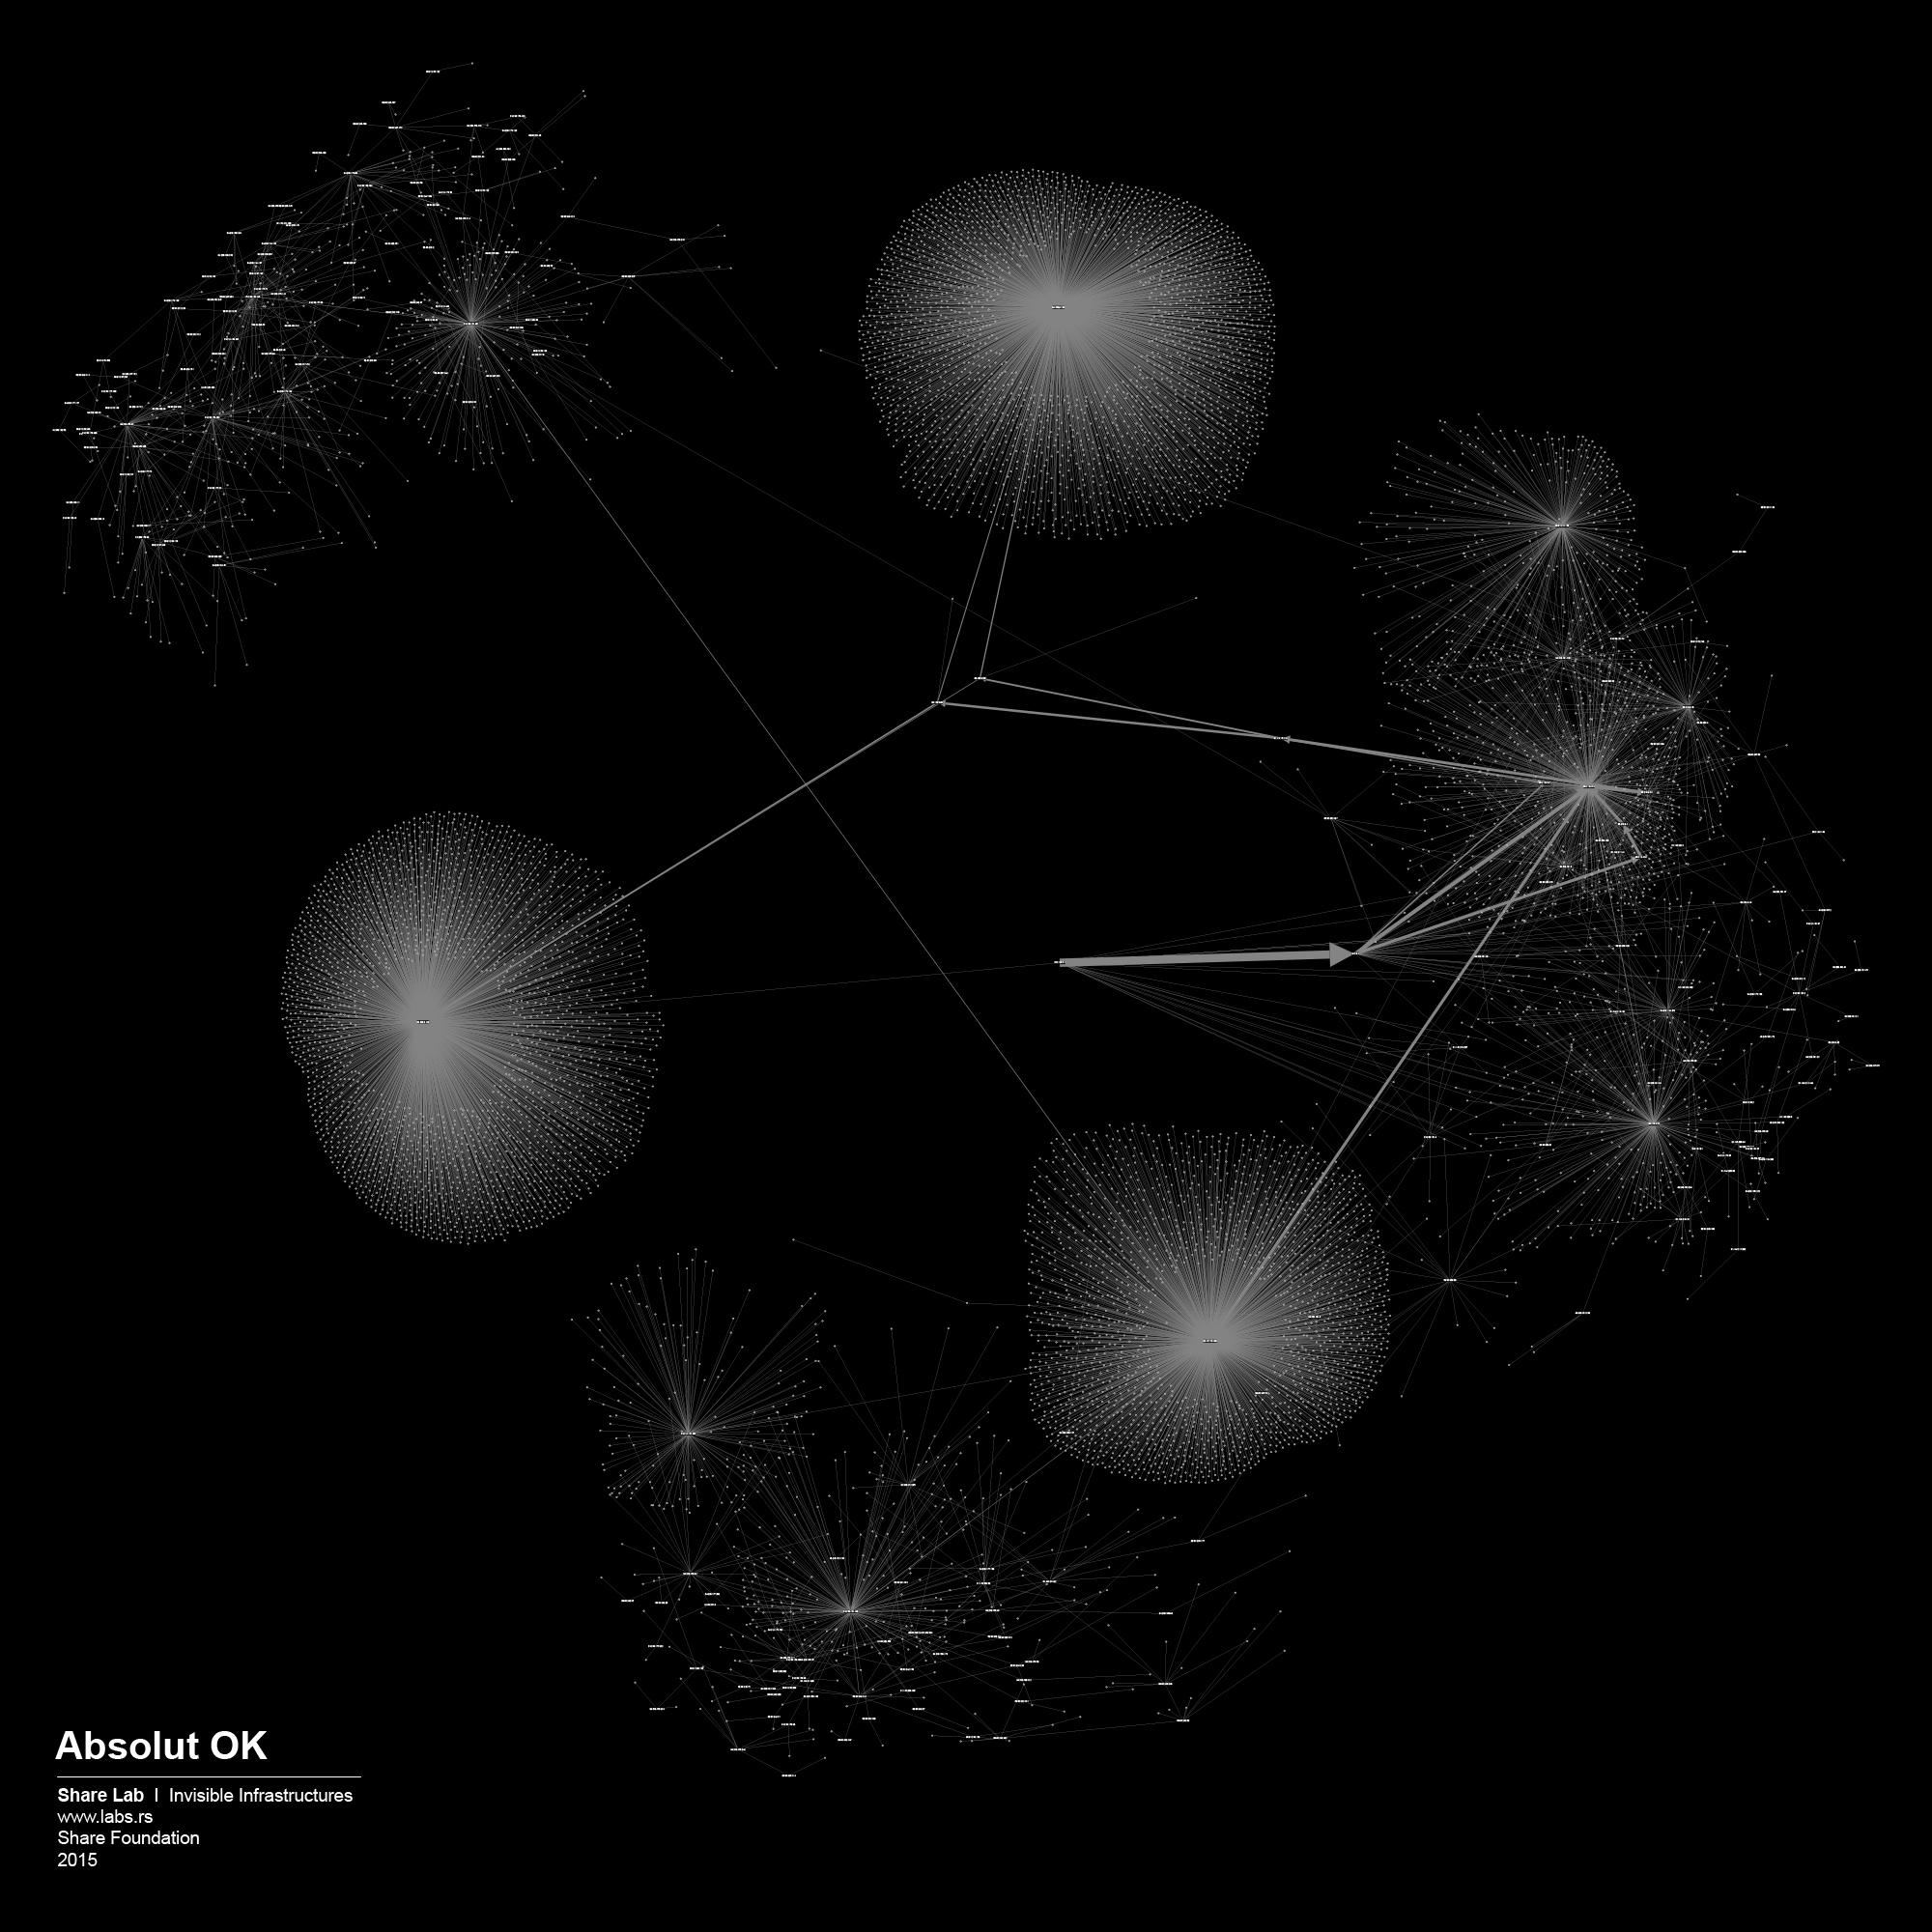
We used IP ranges of every ISP and created a Network Topology map for every one of them. In order to visualize large sets of data, in our case more than 300.000 different IP addresses and links between them, we had to find a tool that is able to display, manipulate and transform the network into a map. We used Gephi 3, an interactive visualization and exploration platform for different kinds of networks and complex systems, dynamic and hierarchical graphs. The obtained results are showed below in form of 30 different maps of ISPs in Serbia.
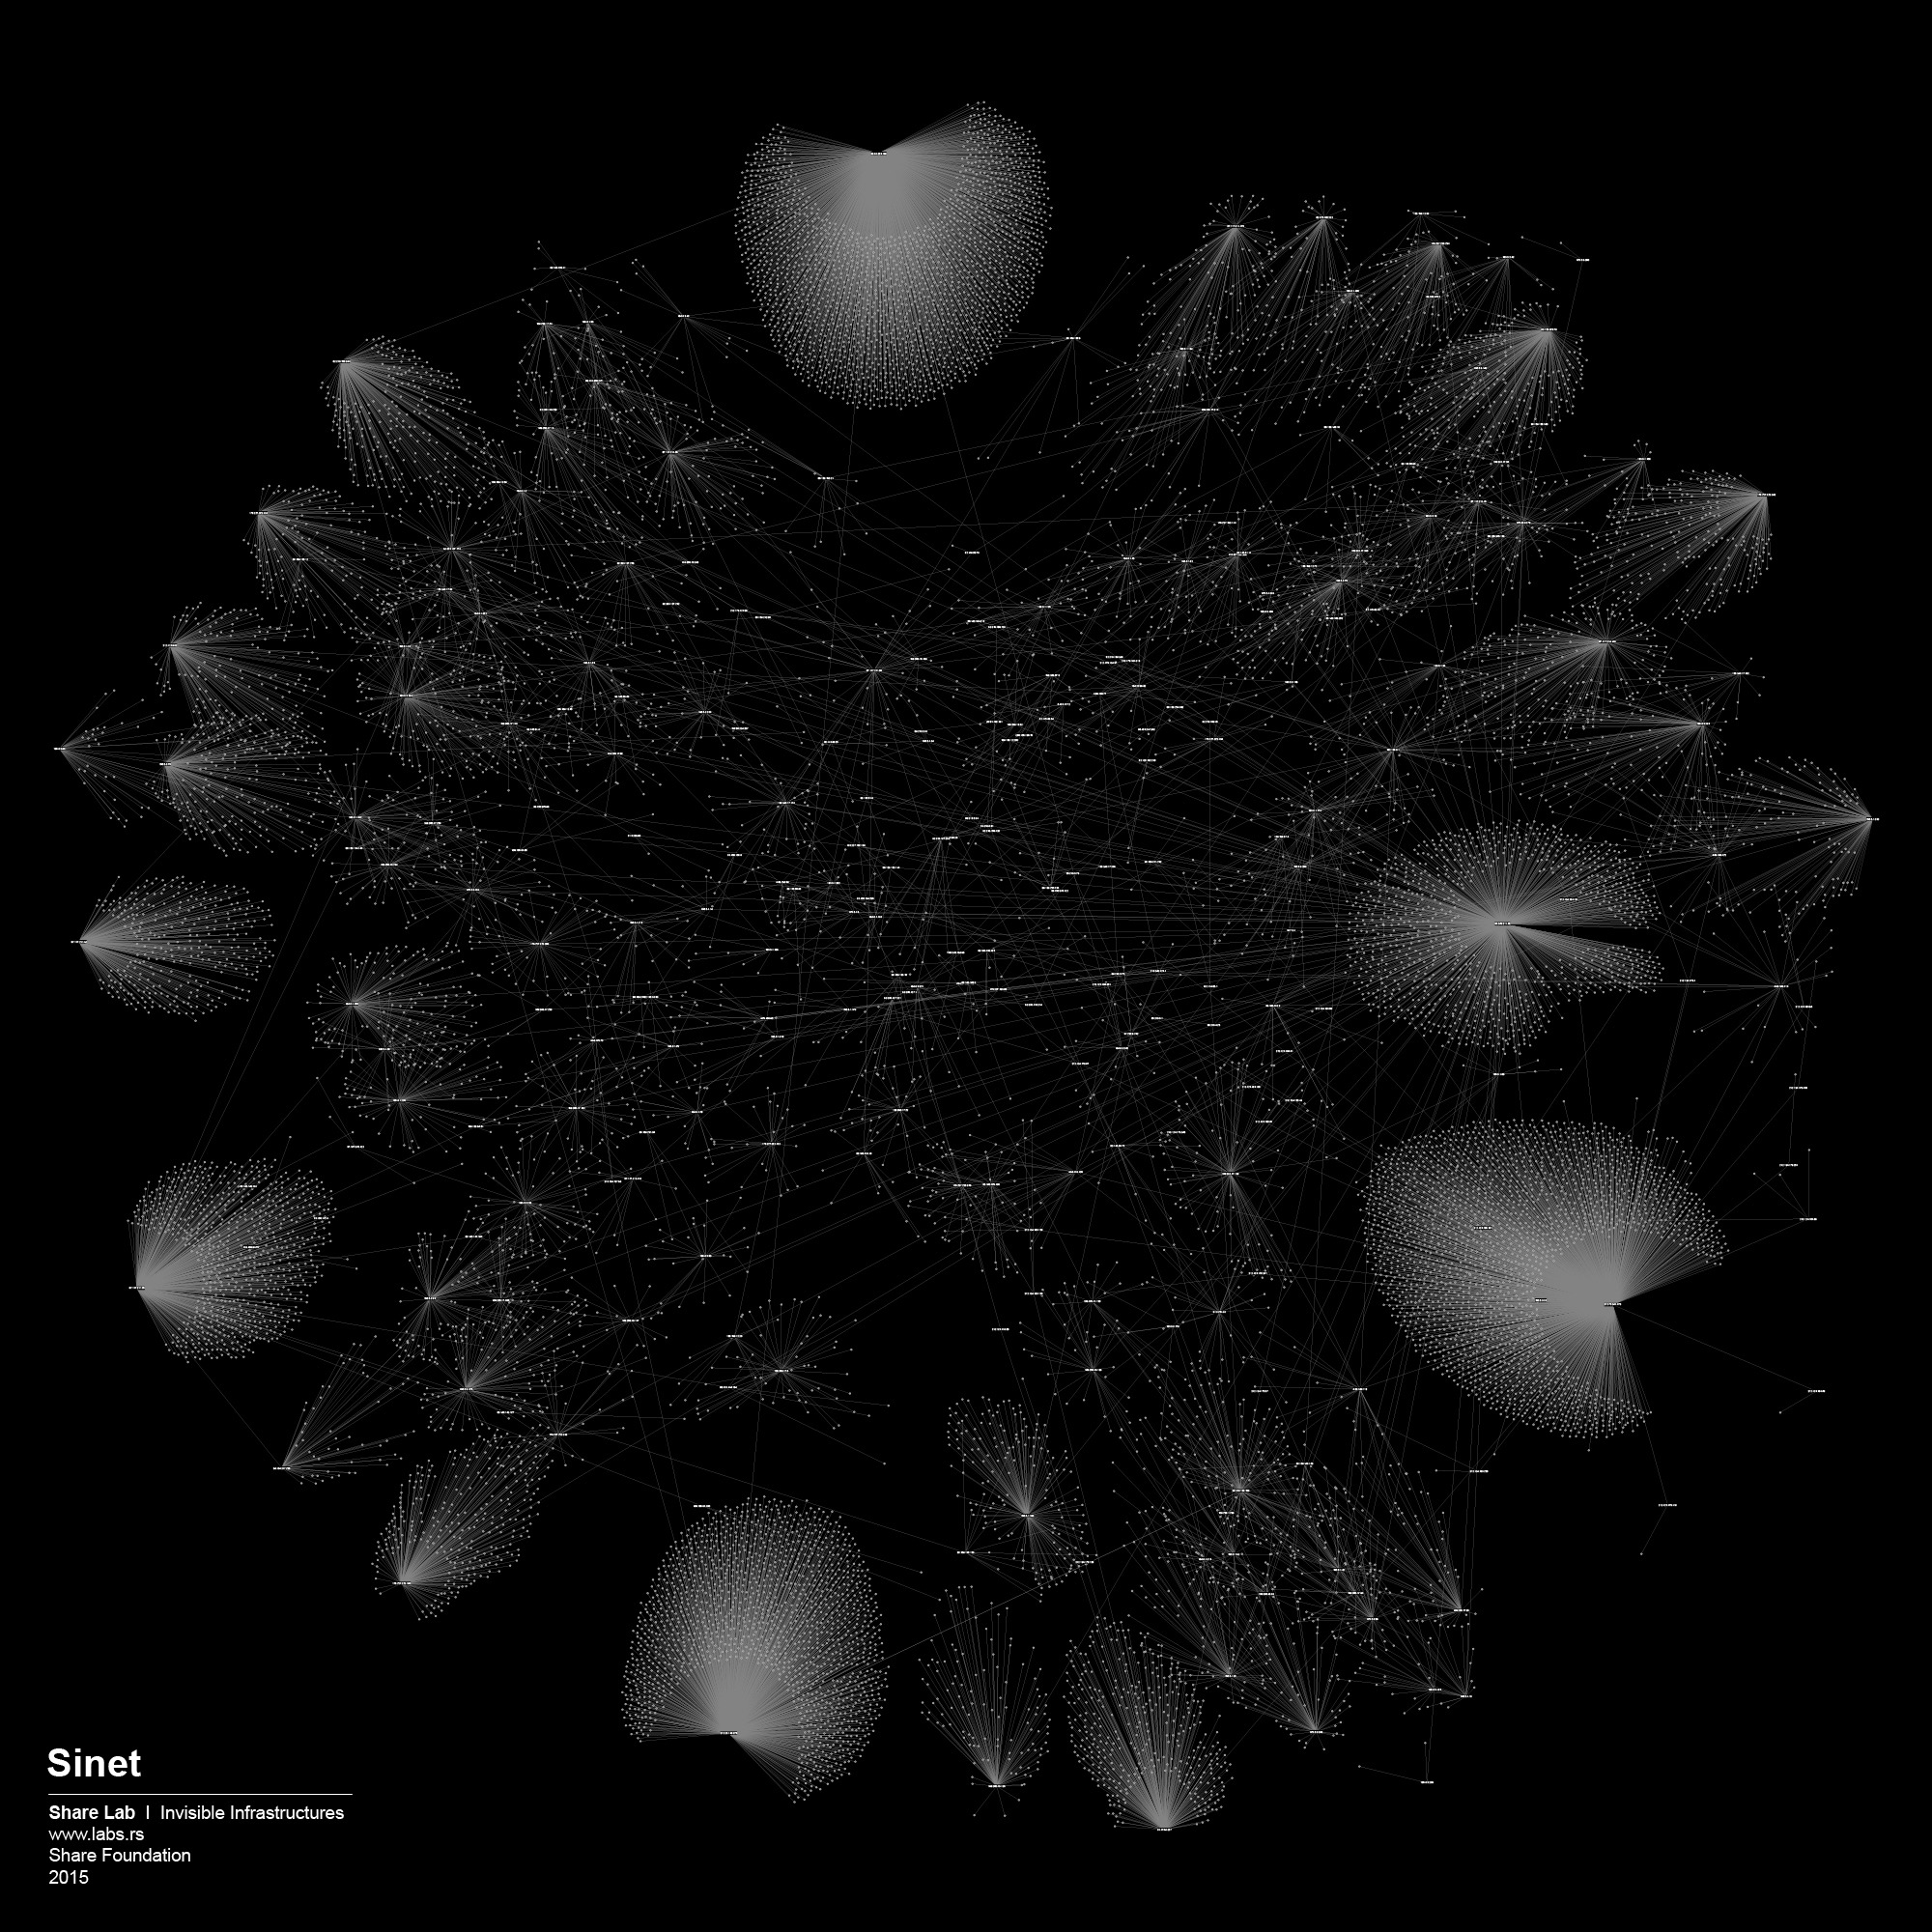
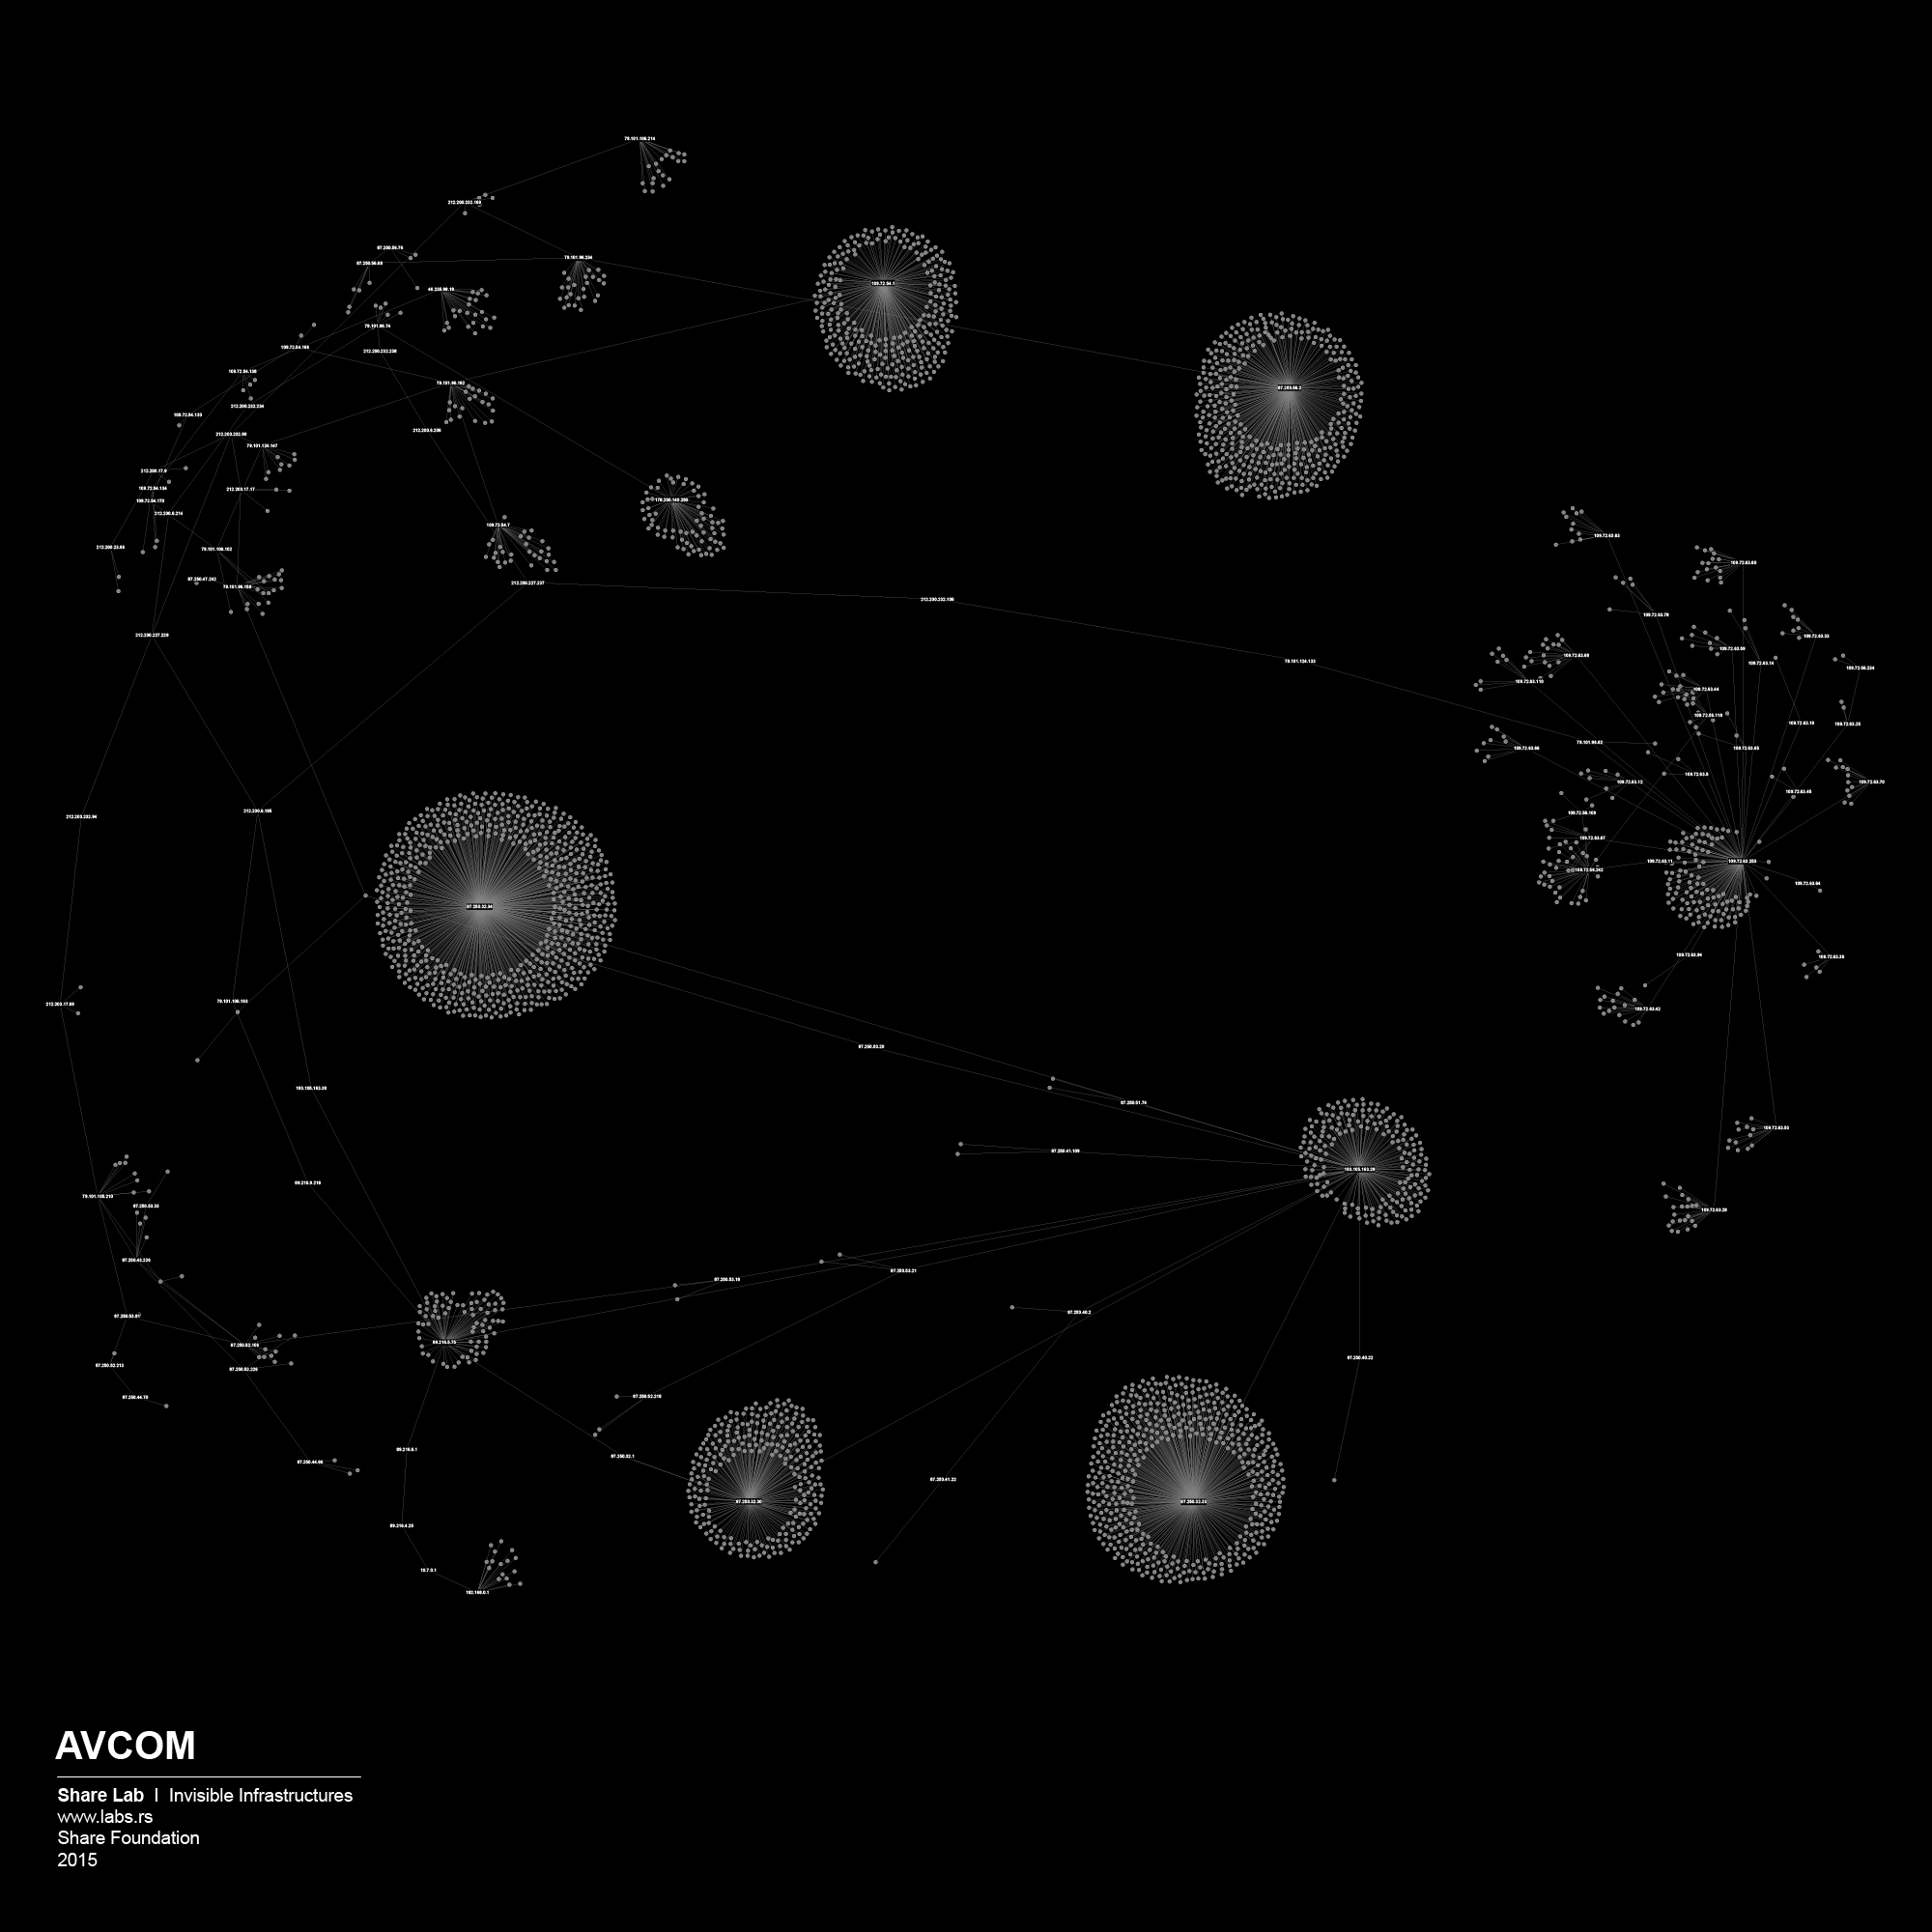
Different structures, and what we can learn from them
Network Structure analysis can be useful for different aspects of network security and efficiency of the network, but our main interests as researchers in this case are related to possible privacy related misuse of the network, digital surveillance and data retention, and different forms of Internet filtering, content control and censorship.
There is three basic network structures:
Centralized. All the devices are connected to one center. This center has privileged accessibility and thus represents the dominant element of the network.
Decentralized. Although the center is still the point of highest accessibility, the network is structured so that sub-centers also have significant levels of accessibility.
Distributed. No center has a level of accessibility that significantly differs to the others.
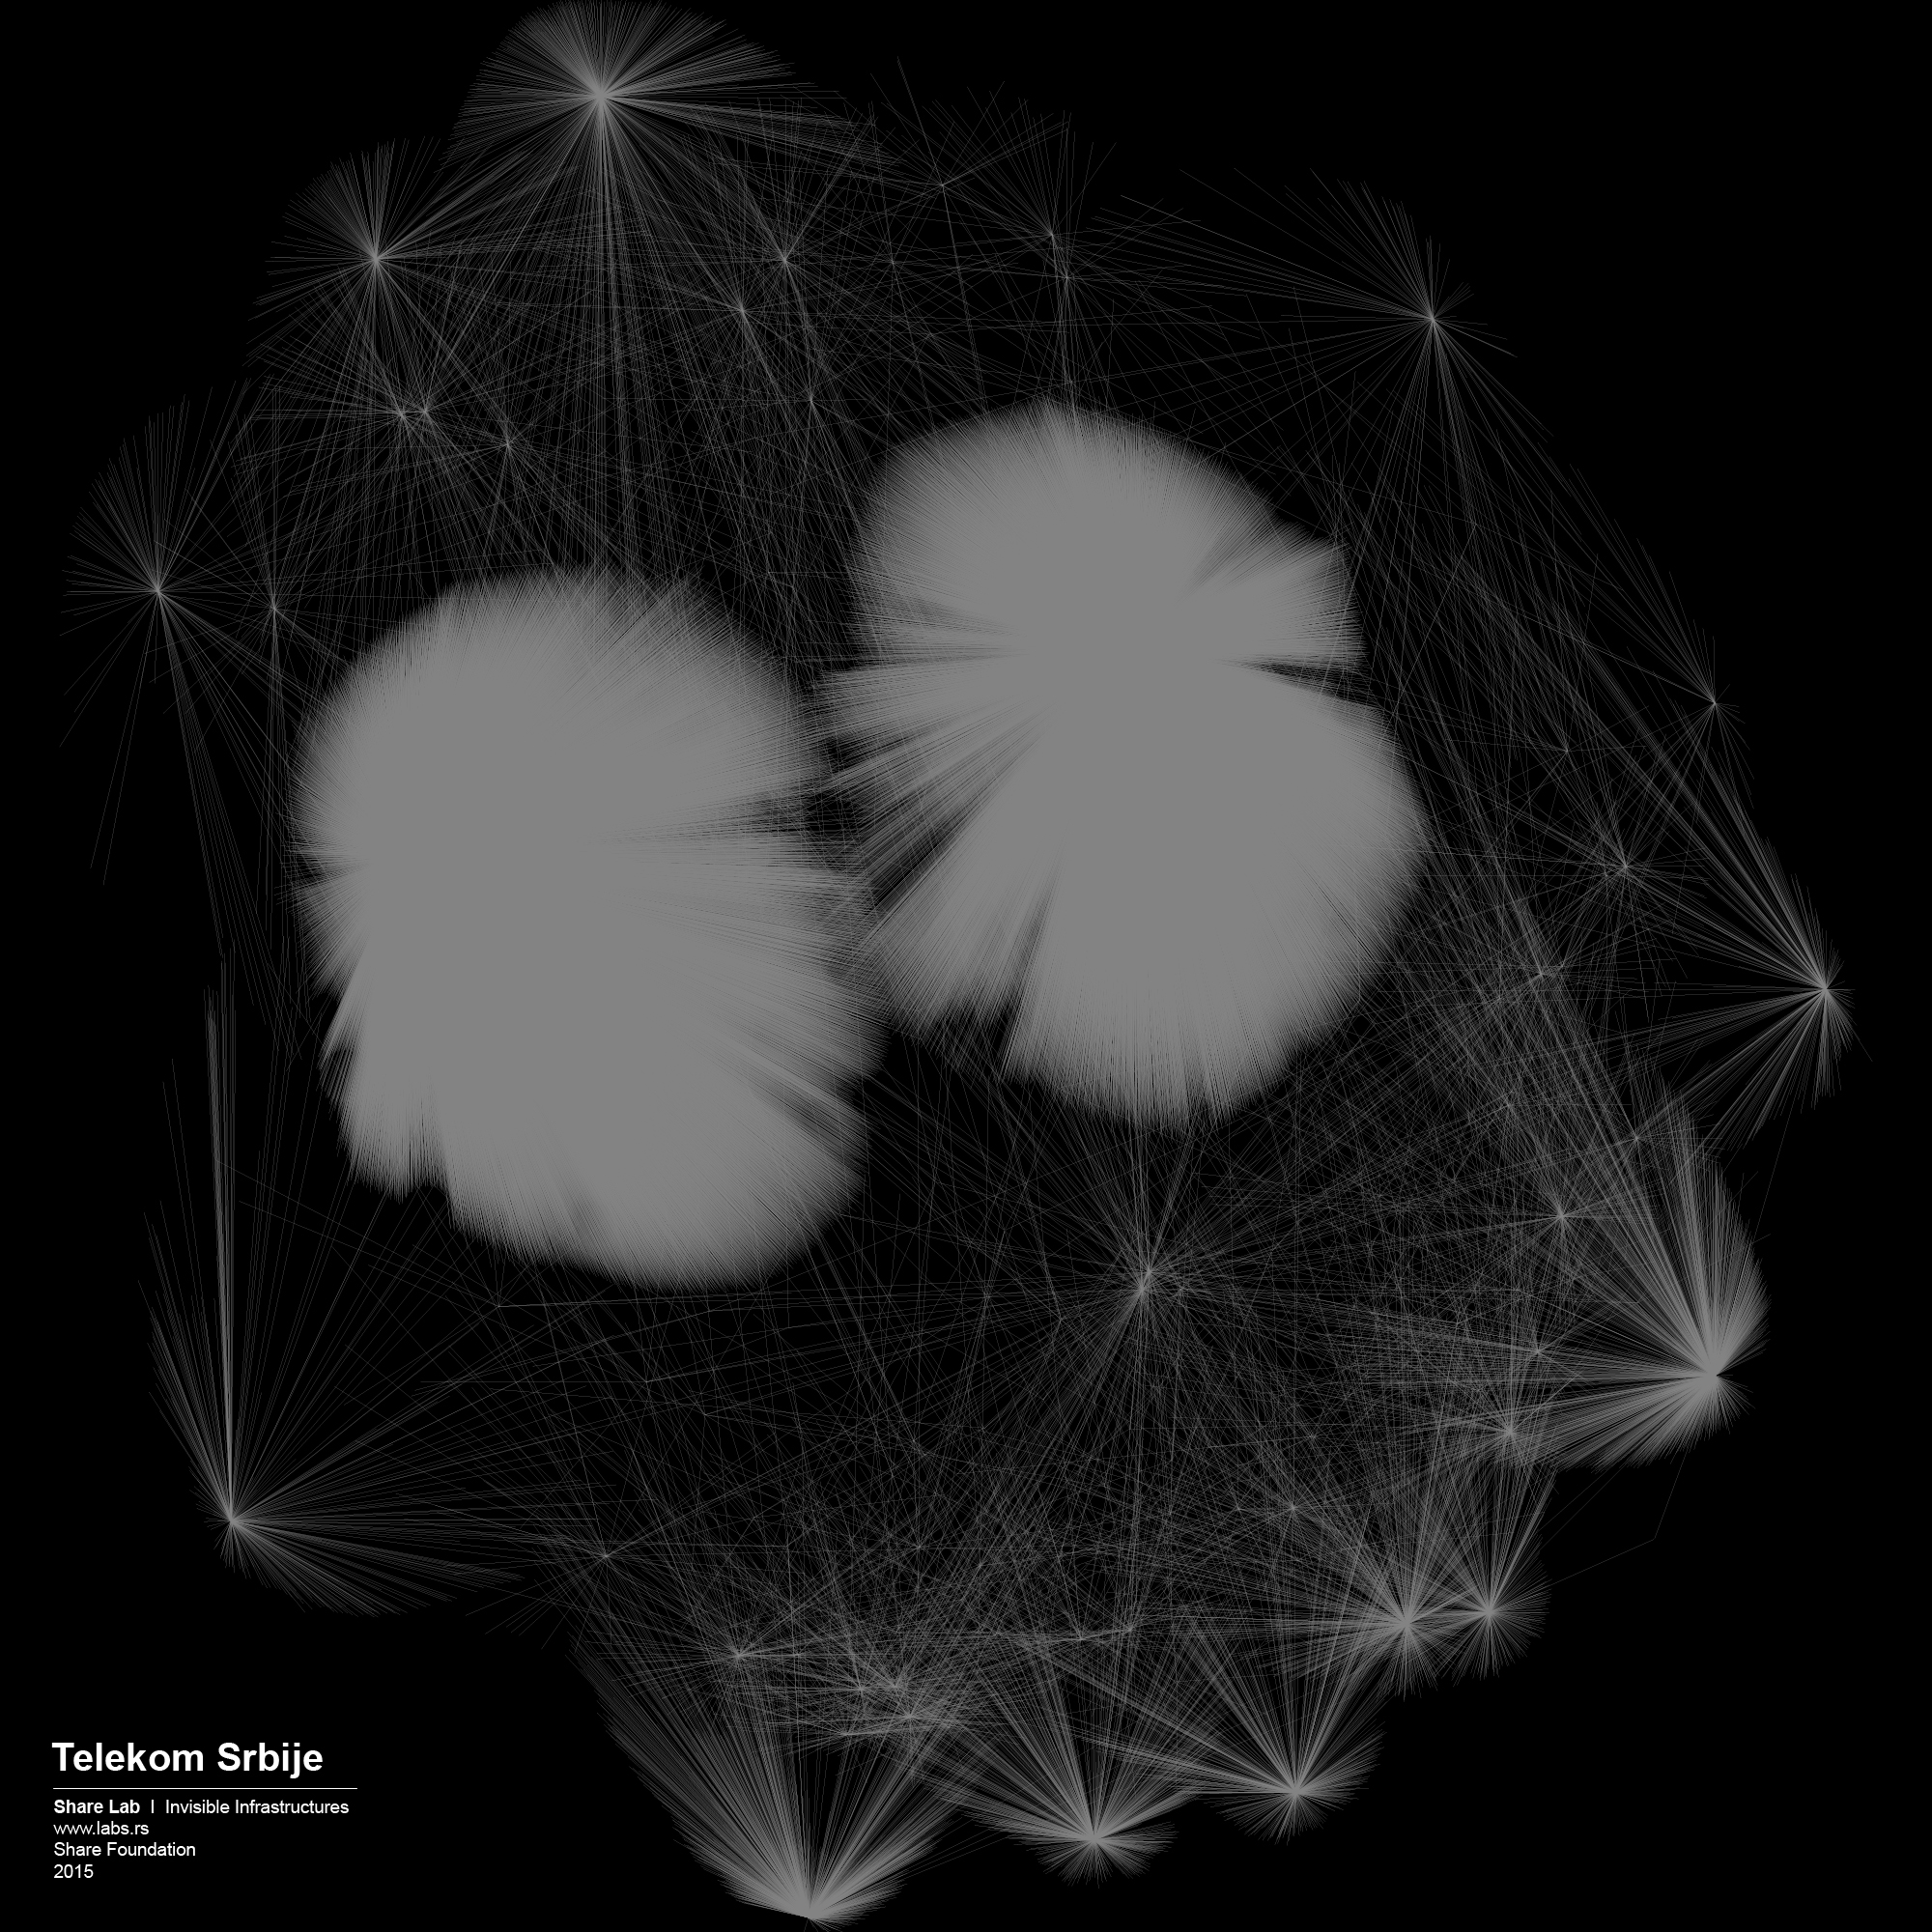
By analysing our visualizations of ISPs in Serbia we have noted that both centralized and decentralized models are present. The centralized model can be associated with the network of the state owned Telekom Serbia and an example of a decentralized model can be seen in the case of the University network – Amres.
But, except feeding our curiosity for deeper understanding of our technological environment and passion for visualizing big sets of data, can we have a practical use of those maps in the field of internet freedom and user privacy?
The Game of Filtering
Internet filtering (or Internet Censorship) is one of the most widespread forms of government approach to internet control. Internet freedom around the world has declined for the fourth consecutive year, with a growing number of countries introducing online censorship and monitoring practices that are simultaneously more aggressive and more sophisticated in their targeting of individual users 4 .
There are three commonly used techniques to block access to Internet sites: IP blocking, DNS tampering, and URL blocking using a proxy. These techniques are used to block access to specific Web Pages, domains, or IP addresses. When the targeted websites are outside the legal jurisdiction of the government (in a foreign country) this is the most effective way to block access to their citizens. There are more advance techniques, (blocking searches involving blacklisted terms, keywords analysis, dynamic content analyses) but they are more rare and we will discuss them in other parts of our research.
What we find most interesting, related to our ISP mapping efforts is the question: Where will internet filtering take place in our ISP network topology? According to the OpenNet Initiative study, Internet filtration can occur at any or all of the following four nodes in network:
1) INDIVIDUAL COMPUTERS
2) INSTITUTIONS Filtering the network on an institutional level using technical blocking
3) INTERNET SERVICE PROVIDERS Government-mandated filtering is most commonly implemented by Internet Service Providers (ISPs) using any one or combination of the technical filtering techniques mentioned above.
4) INTERNET BACKBONE State-directed implementation of national content filtering schemes and blocking technologies may be carried out at the backbone level, affecting Internet access throughout an entire country. This is often carried out at the international gateway.
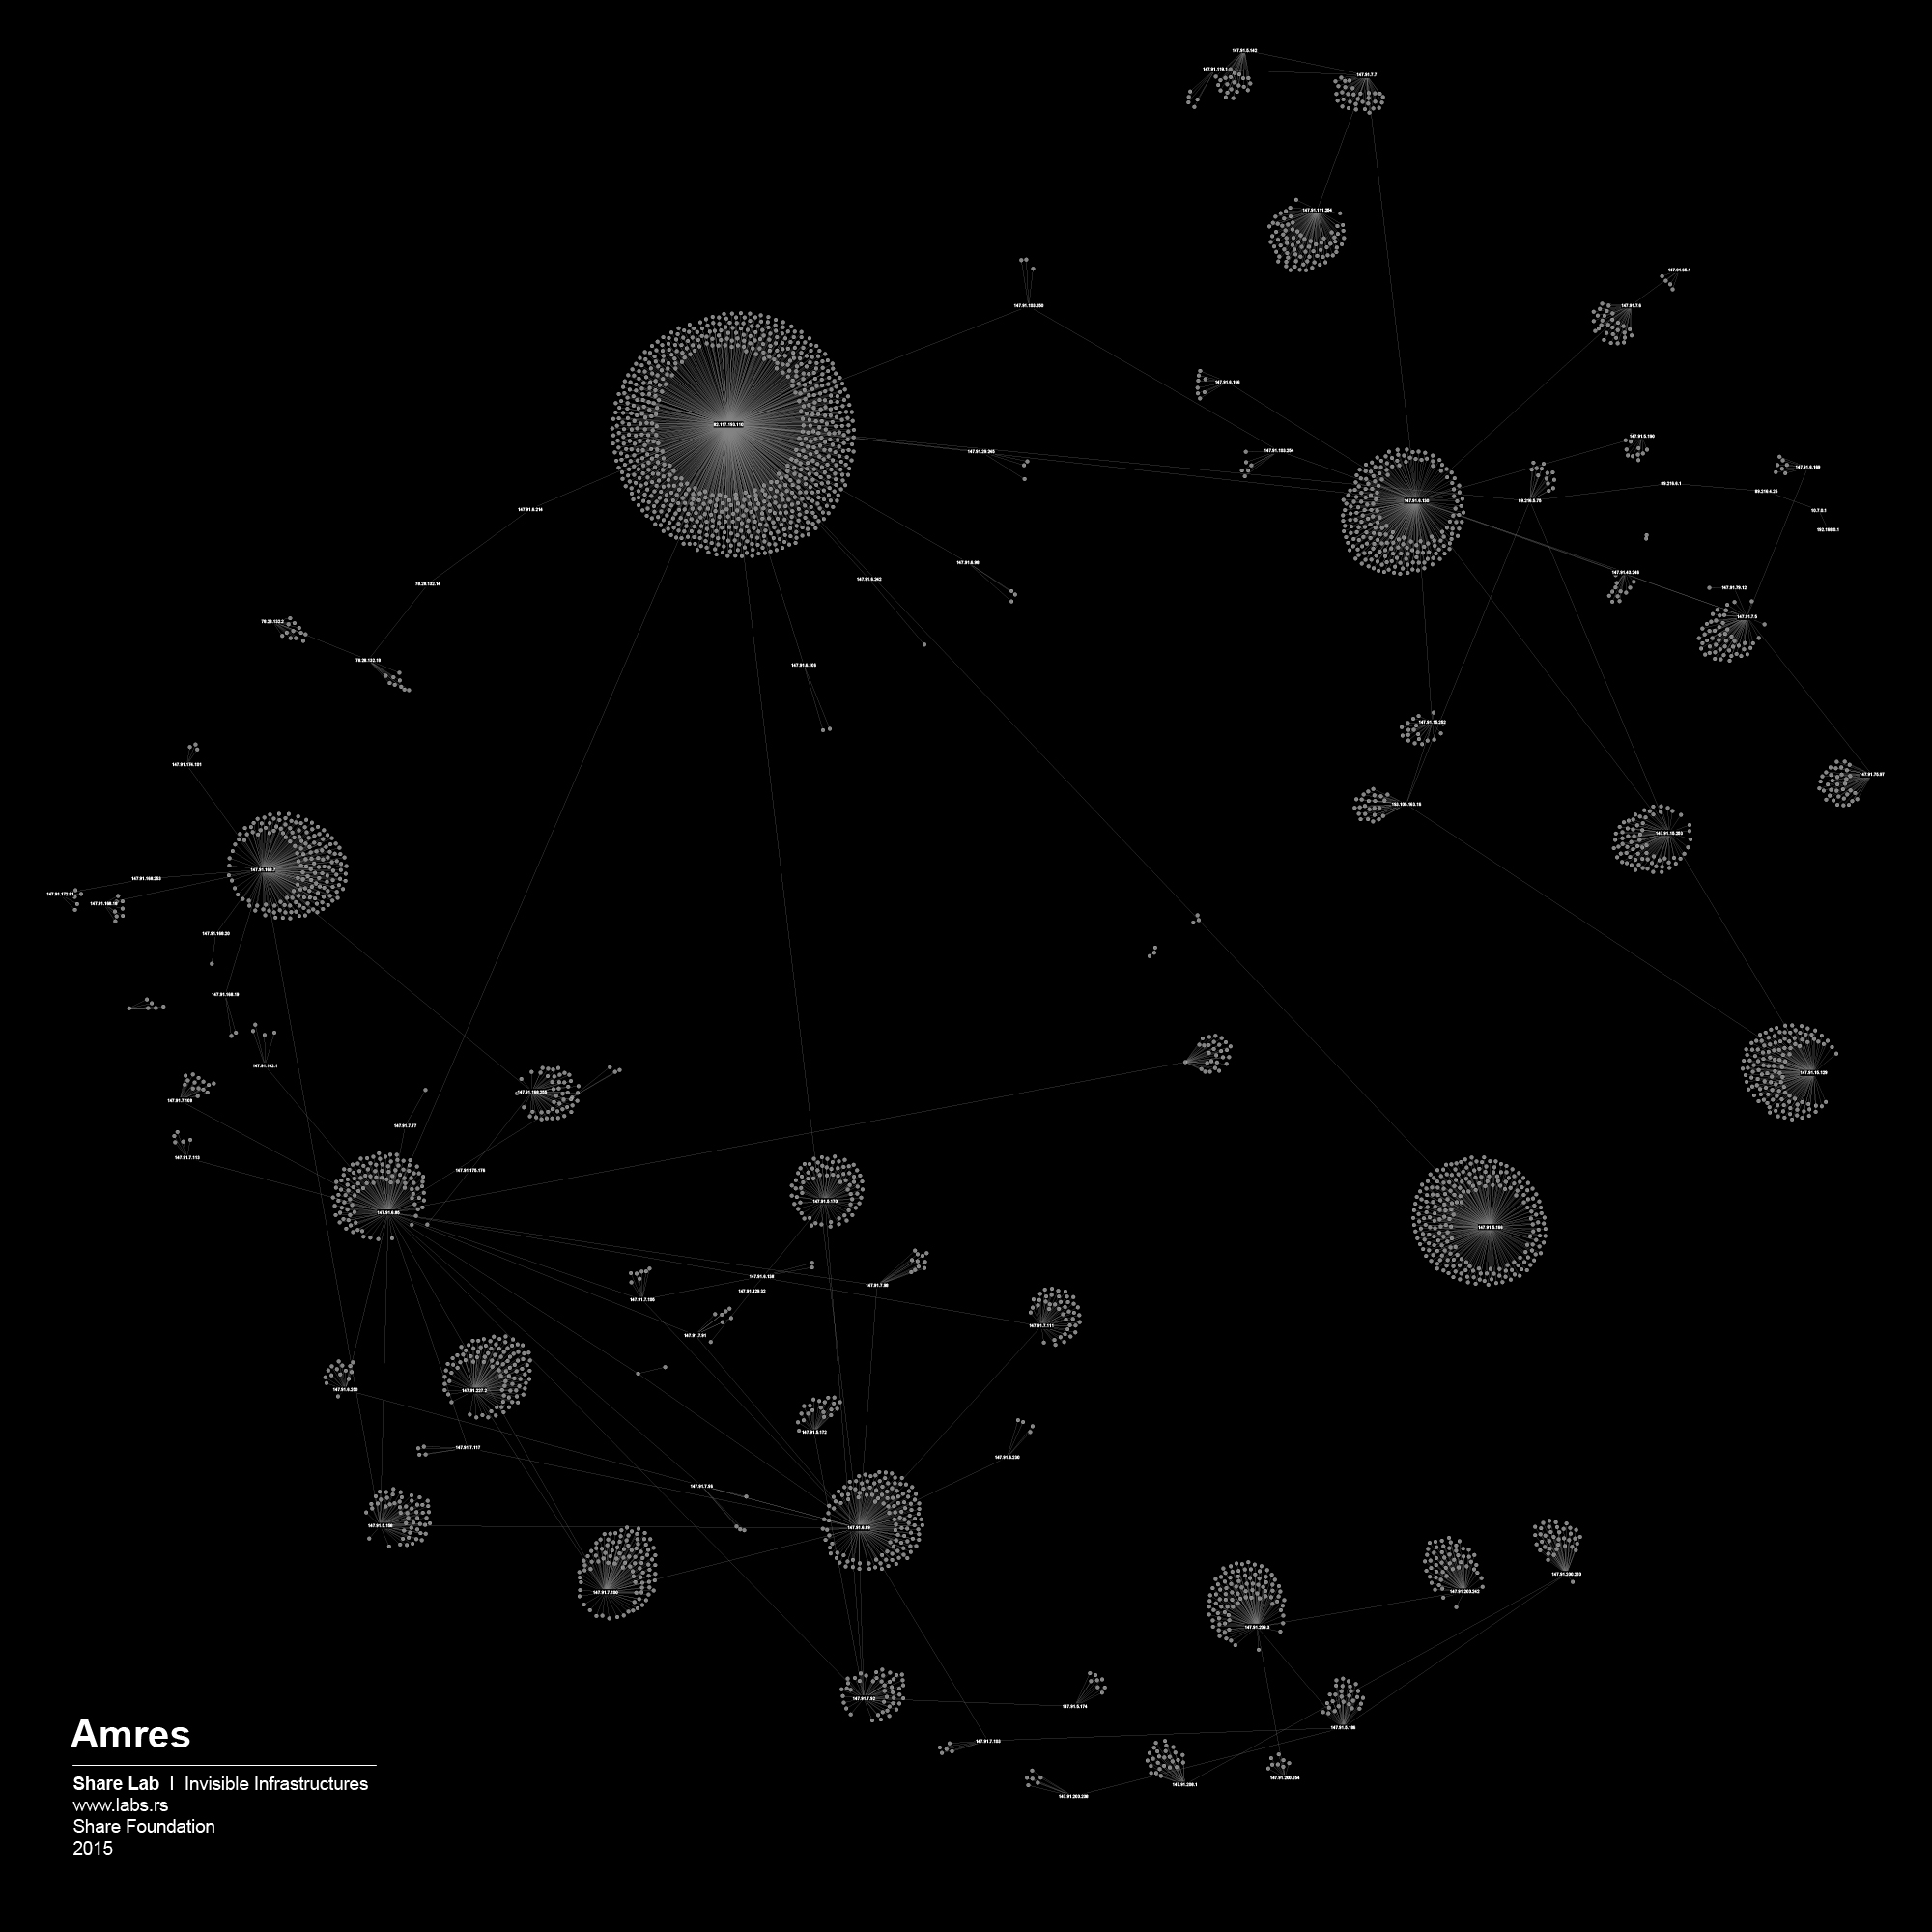
In one of our previous researches 5 related to the case of the national research and education network of Serbia – AMRES’ internet filtering practice, we discovered a decentralized method of content filtering, delegated and executed through local administrators and routers at every University in Serbia. Each local administrator is responsible for his own black list of sites and ports. The AMRES network is one of the oldest ISPs in Serbia, established in the early 1990s, and its method of Internet filtering presented here is filtering on institutional level. If we take a look at the visualization of the AMRES network, we can clearly see why this method of Internet filtering was the most applicable one – the decentralized structure of the AMRES network somehow imposes this kind of filtering strategy.
In our view, that type and complexity of a network structure and topology, ownership model & management needs, have a crucial role in defining the model of internet filtering, and the amount and type of equipment that will be used. For us, users or researchers without access to privileged information, the analysis of network topology maps can be a starting point for better understanding infrastructures of control and potential repression.
In December 2014, the Government of the Republic of Serbia sent a Proposal of the Law on Amendments to the Law on Games of Chance 6 to the Parliament. The proposed changes were adopted without a discussion and public insight, even though these provisions would introduce Internet censorship in Serbia through a “back door”. The solution that presented the main problem was the amendment 7 which prohibits “ enabling access to websites by domestic electronic communication network service operators to legal entities or individuals organizing games of chance without the approval or consent of the Administration”.
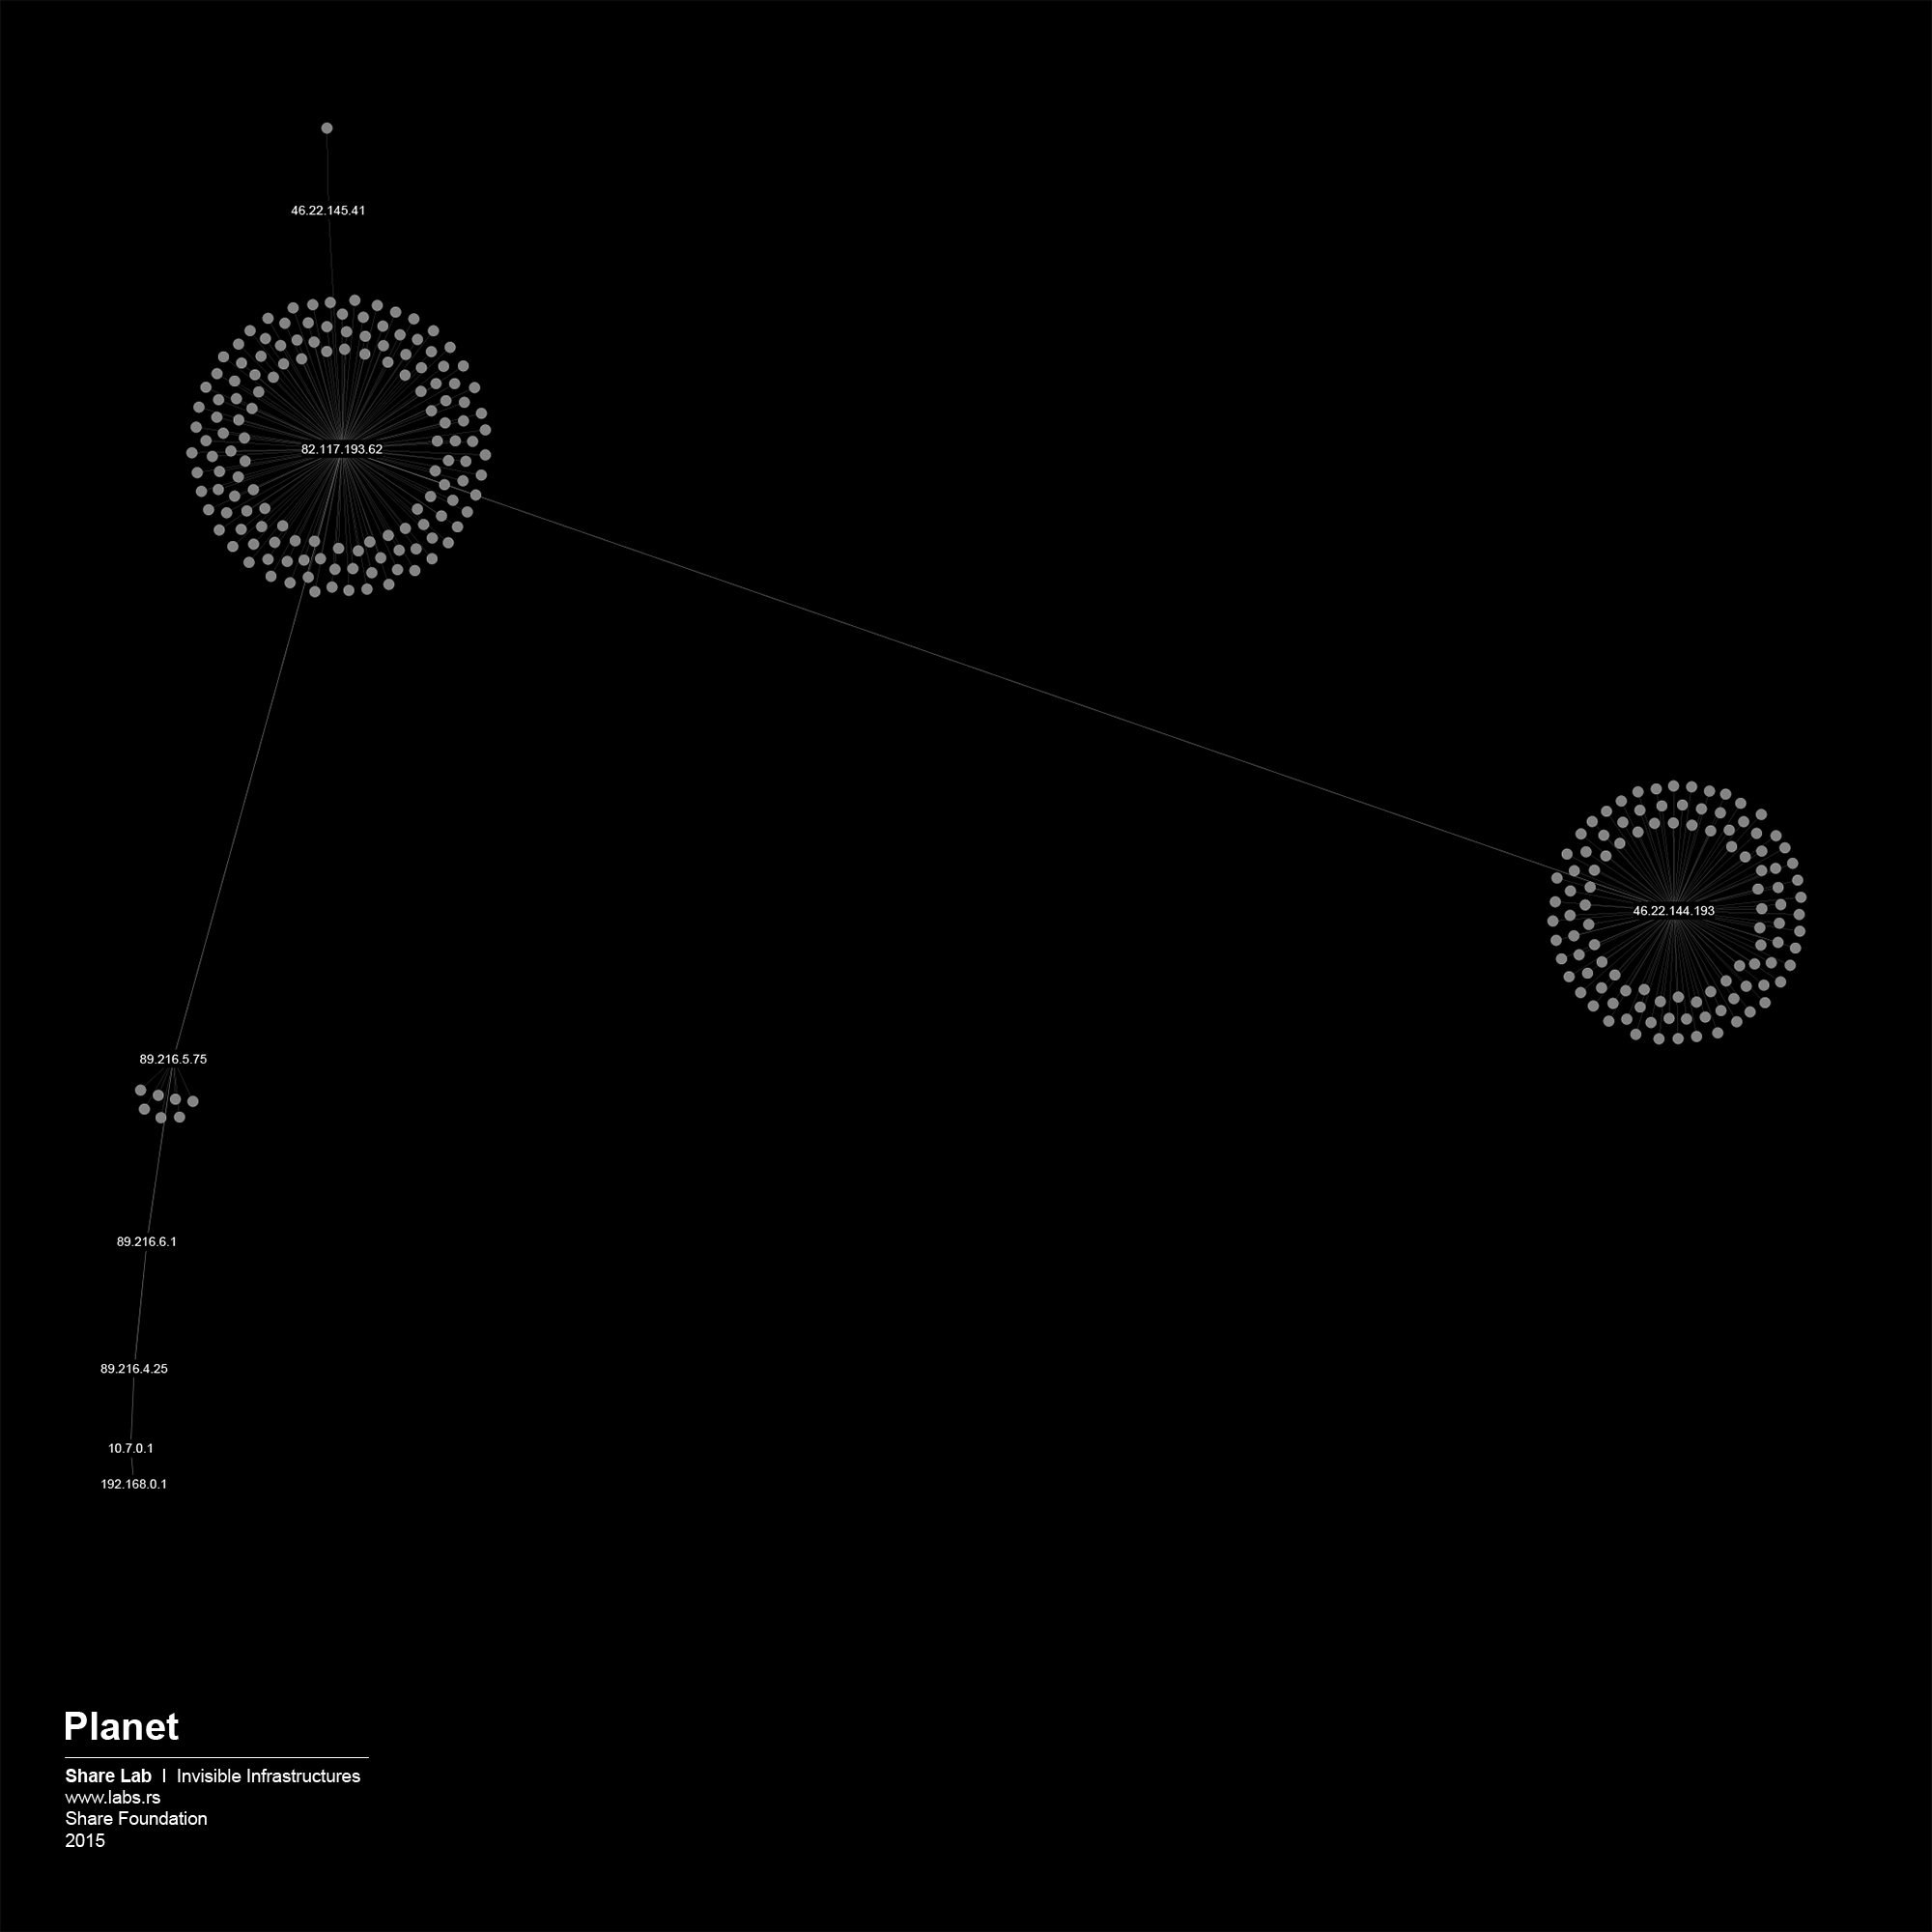
Fortunately, after SHARE Foundation analyzed the Proposal and started a media campaign, the Proposal of the Law was withdrawn from the parliamentary procedure following an intervention of the Government. In one part of the Proposal, it was written that the installation, maintenance and costs of the equipment intended for filtering is a responsibility of the ISPs. In order to create an argument regarding unreasonable costs that every ISP would have, we tried to analyze the network topology maps of every individual ISP in Serbia and try to guess how much and what kind of equipment they would need to purchase. Even though our method is not 100% accurate, we had in our hands something to work with, something that gave us an insight into the unknown and invisible design of the networks. By watching the map of Telekom Serbia’s network, the biggest ISP in Serbia and owner of the biggest share of the infrastructure, we could observe the highly centralized structure where almost all the main nodes, routers were connected to just two main servers. The logical conclusion is that in order to perform real time filtering they would need to instal equipment exactly in those two points. On the other hand, from the number of nodes attached to those two main routers, we can guess that they are able to process huge amounts of traffic, therefore the equipment that they would need to install would probably need to be of high-end performance. We were able to predict the type and cost of the theoretical filtering solution, giving that there are just a few manufacturers of such equipment.
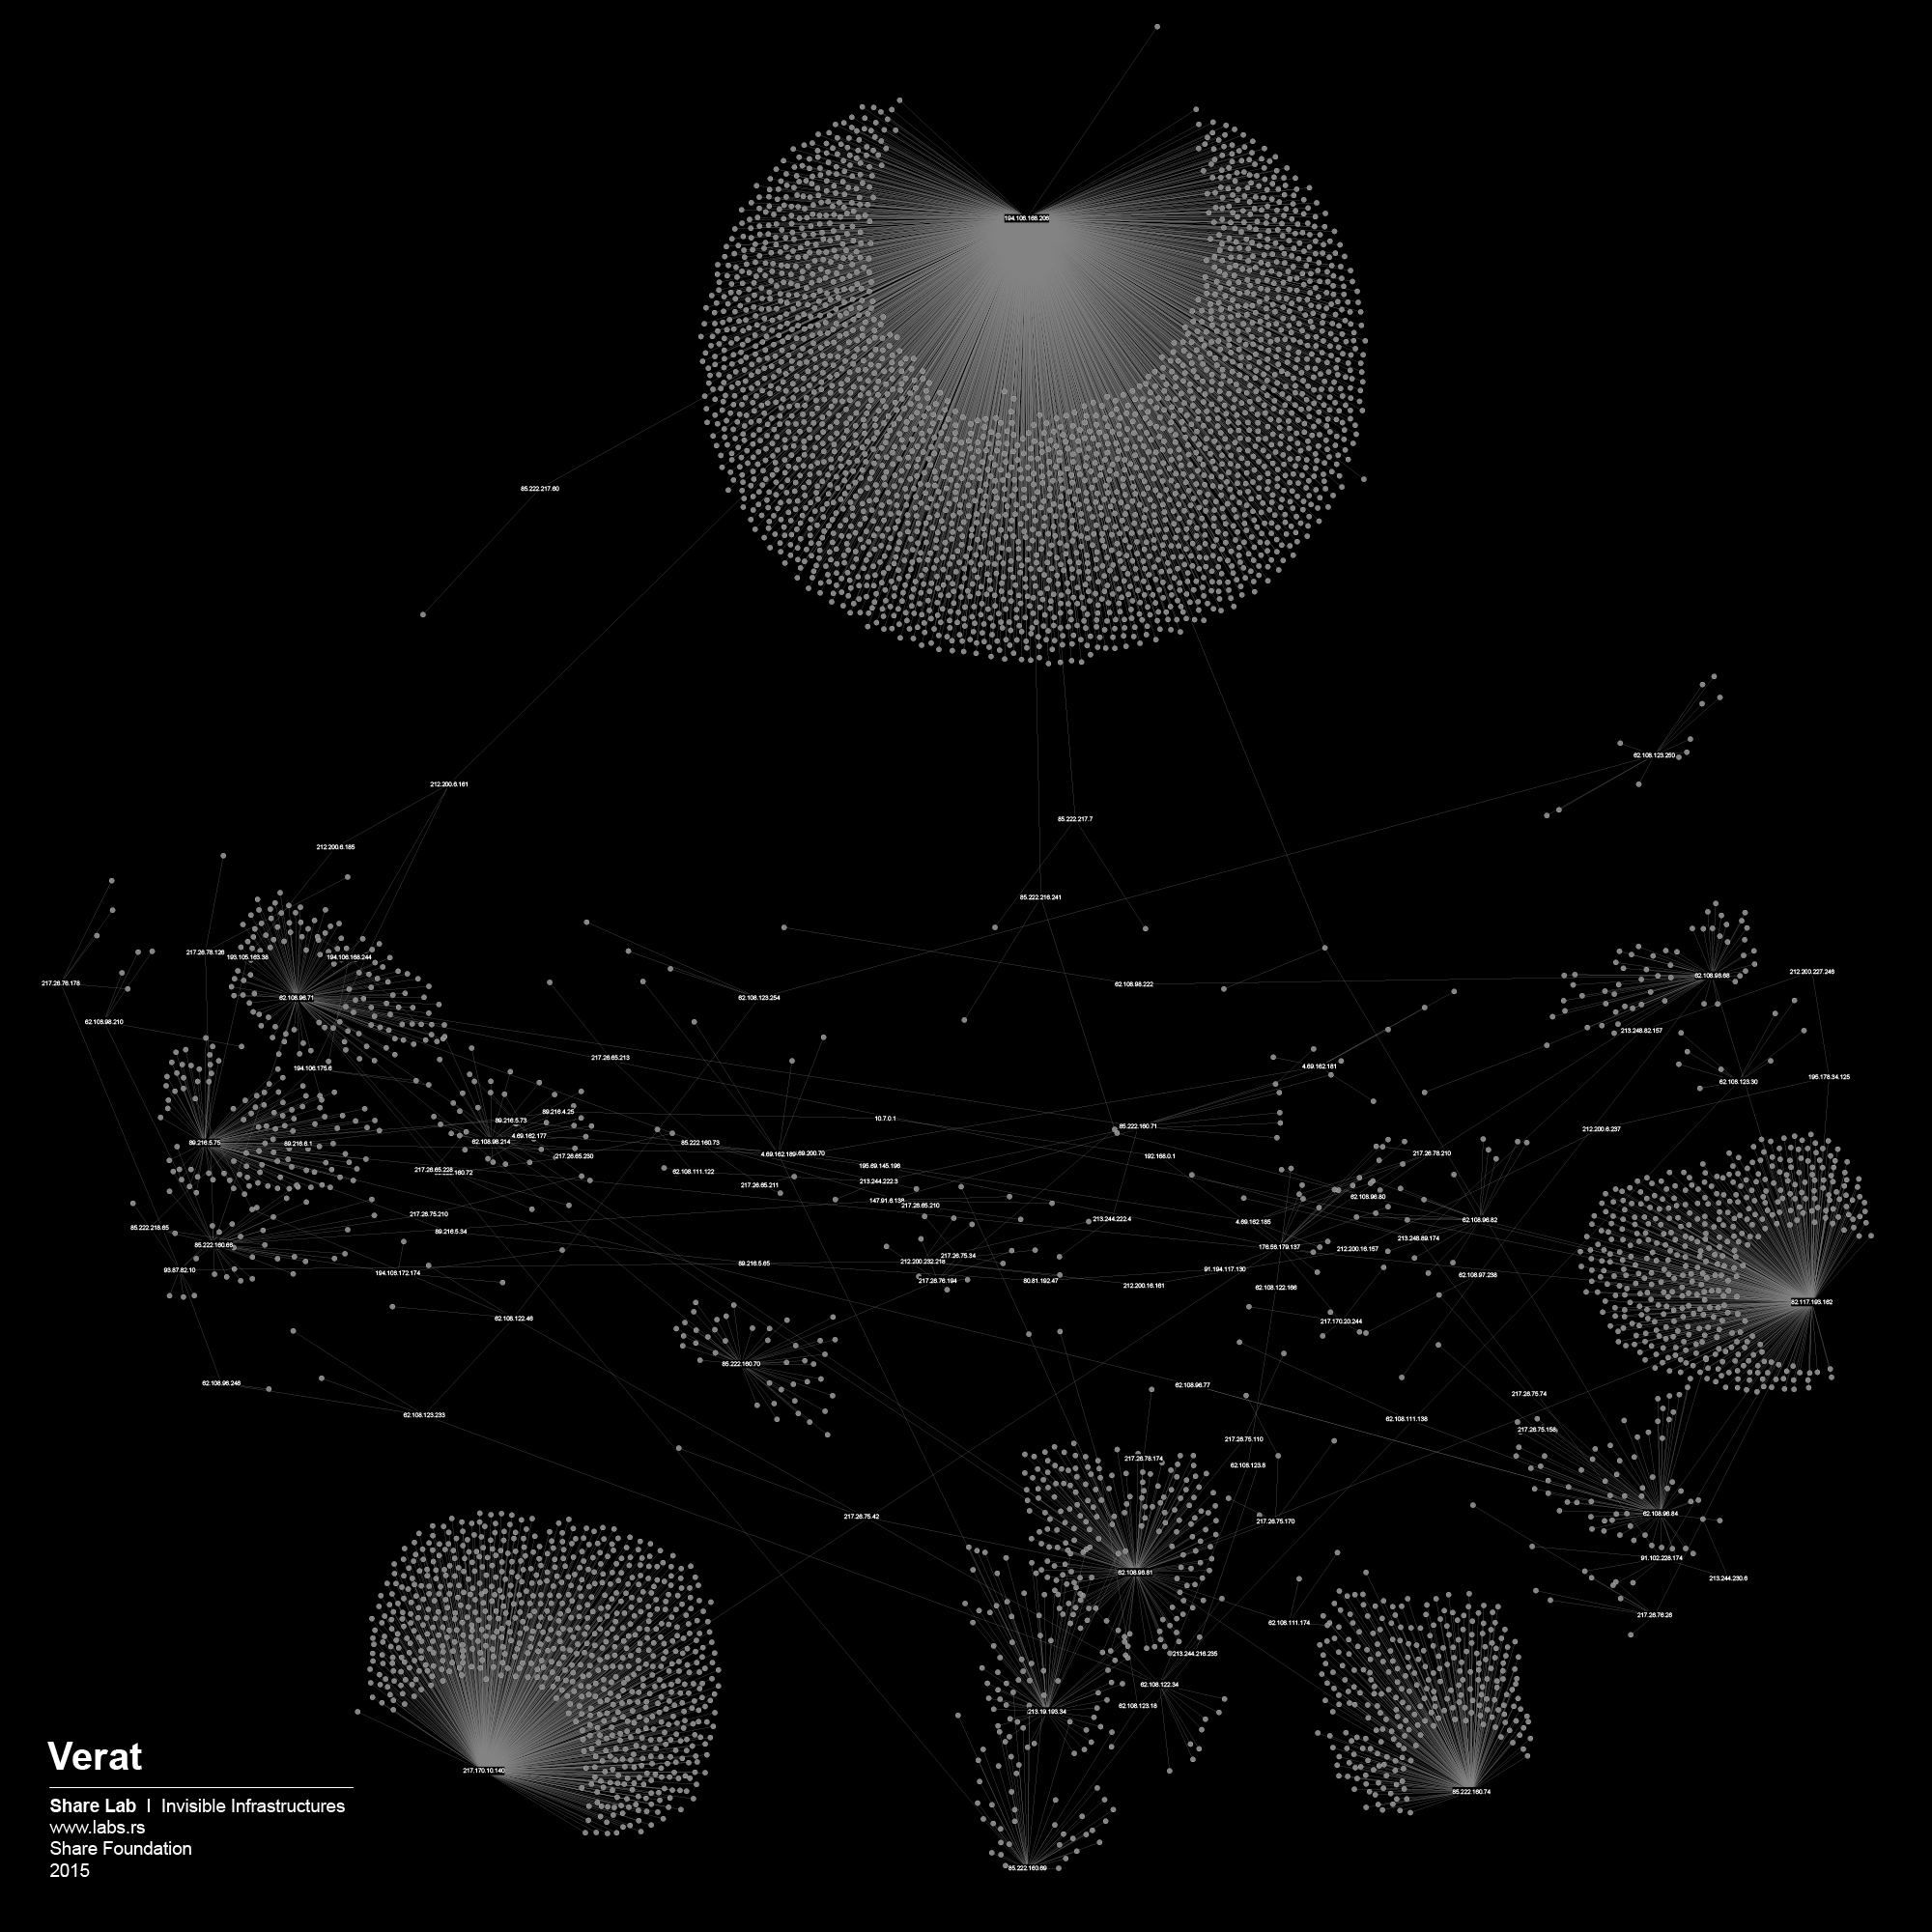
We played the Game of Filtering on the maps of the other ISPs as well, and each of them was a story for itself. Most of them were much more decentralized and we needed more efforts to find out where filtering could potentially happen. Decentralized networks are more complex to control, they have more crossroads, more points to cover if you want to have access to all the data flows. Although, it’s hard not to see the shape of the Panopticon structure in the case of the network organisation similar to the one we saw on the case of Telekom Serbia.
Given that our analysis is still only at the level of an individual ISP, this is just a small fragment of the story. The Internet is a network of networks, and to be able to create a full picture and to understand where the points of control are, we need to examine their local interconnections and links to the International networks. This is the topic of our next analysis.

- http://www.internetsociety.org/internet/how-it-works
- RIPE NCC for Europe and parts of Asia
- http://gephi.github.io/
- https://freedomhouse.org/report/freedom-net/freedom-net-2014
- http://www.shareconference.net/sh/defense/access-denied-blokiranje-sadrzaja-na-akademskoj-mrezi-srbije-amres
- http://www.parlament.gov.rs/upload/archive/files/cir/pdf/predlozi_zakona/4445-14.pdf
- Of Article 10 of the current law, i.e. new Item 16 of Paragraph 1